Oral cadmium exposure to environmental doses induces visceral adiposopathy in Wistar rats
Victor Enrique Sarmiento-Ortega, Diana Moroni-González, Alfonso Diaz, Eduardo Brambila, Samuel Treviño

TL;DR
This study shows that low levels of cadmium exposure in drinking water can cause inflammation and dysfunction in fat tissue in rats, potentially leading to metabolic diseases.
Contribution
The study is the first to demonstrate that environmental doses of cadmium induce visceral adiposopathy in rats.
Findings
Cadmium exposure increases proinflammatory cytokines and activates NF-κB in adipose tissue.
Cadmium exposure shifts macrophage phenotype and disrupts the adiponectin/leptin axis.
Fibrosis in adipose tissue develops in later stages of cadmium exposure.
Abstract
Chronic cadmium exposure, even in environmental doses, has been linked to multiple metabolic disturbances, including white adipose tissue (WAT) dysfunction. WAT dysfunction is defined as a loss of endocrine, immunologic, and metabolic homeostasis, characterized by a low-grade, progressive, and non-resolving inflammation development, namely adiposopathy. This study evaluated the immunometabolic effects of Cd exposure in drinking water on WAT of male Wistar rats, using concentrations of 15 and 32 ppm (environmental doses) over periods of up to 5 months. Inflammatory markers in serum and tissue were analyzed, along with macrophage phenotype, NF-κB pathway activation, leptin and adiponectin expression, correlations with the adiponectin/leptin (A/L) index, and the development of fibrosis. The results showed a progressive increase in proinflammatory cytokines (IL-6, TNF-α, IL-1β), sustained…
Genes, proteins, chemicals, diseases, species, mutations and cell lines named across the full text — each resolved to its canonical identifier and authoritative record.
Click any figure to enlarge with its caption.
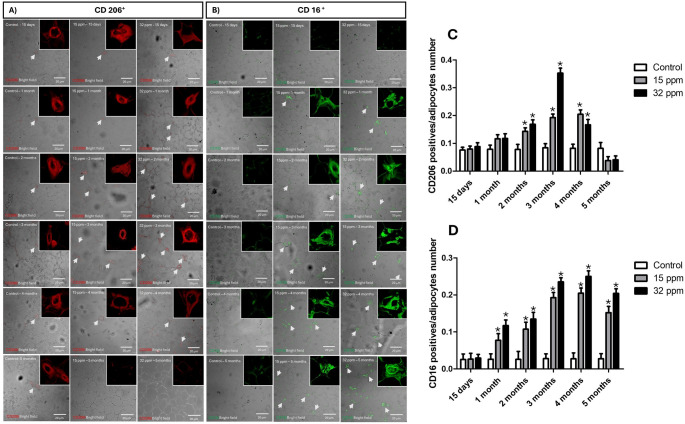 Figure 1
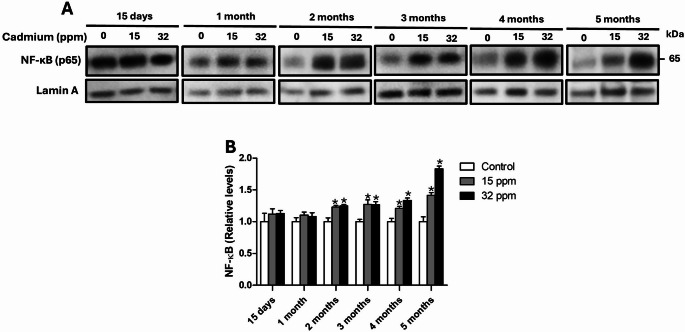 Figure 2
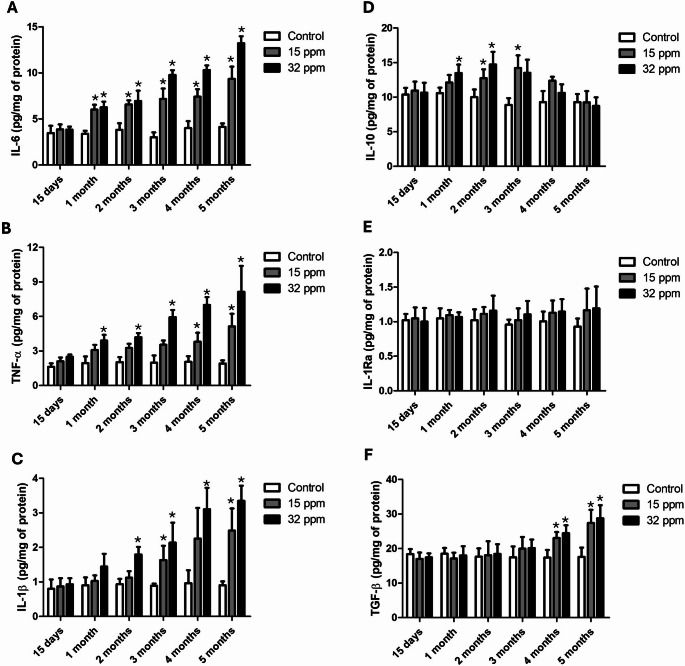 Figure 3
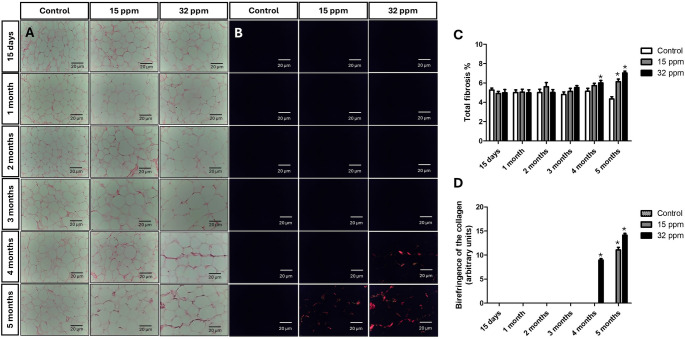 Figure 4
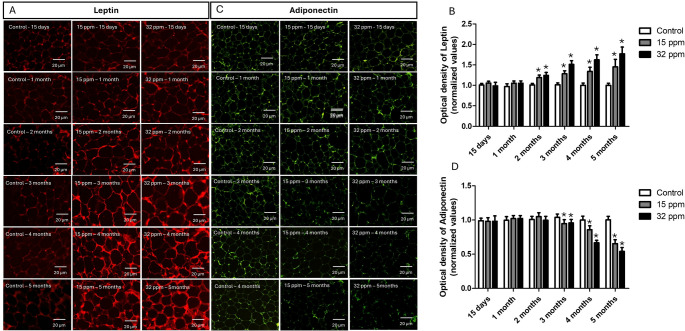 Figure 5
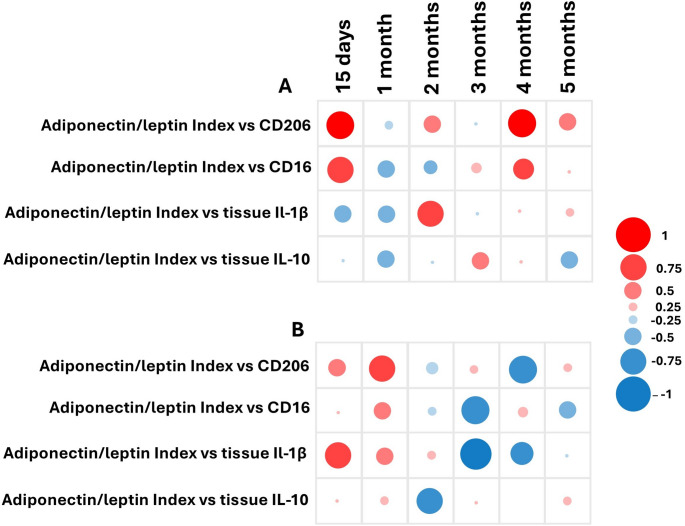 Figure 6
- —http://dx.doi.org/10.13039/501100015029Vicerrectoría de Investigación y Estudios de Posgrado, Benemérita Universidad Autónoma de Puebla
Peer Reviews
No public reviews on file for this paper yet. If you reviewed it on a platform where reviews are public (OpenReview, ICLR, NeurIPS, ICML), you can paste yours below so the community can read it here.
Videos
No videos yet. Explain this paper in a talk, walkthrough, or lecture? Add one.
Taxonomy
TopicsHeavy Metal Exposure and Toxicity · Adipokines, Inflammation, and Metabolic Diseases · Bone Metabolism and Diseases
Introduction
Environmental pollution by heavy metals represents a growing threat to global public health. Industrial, agricultural, and mining activities have significantly increased this type of pollution, posing a significant health risk (Dagdag et al. 2023). Cadmium (Cd) is recognized as one of the most toxic contaminants, primarily released through industrial activities, vehicular emissions, the use of phosphate fertilizers, and tobacco smoke (Yuan et al. 2019; Kubier et al. 2019). The Agency for Toxic Substances and Disease Registry (ATSDR) has defined the environmental Cd concentrations as the minimal risk level of daily exposure to metal that has no appreciable risk of adverse effects, such as cancer development. These are the no observable adverse effect level (NOAEL; < 1 μg of Cd/kg/day) and lowest observable adverse effect level (LOAEL; 1 μg to 2 mg of Cd/kg/day). Therefore, international organizations recommend in their guidelines a maximum Cd intake limit in drinking water (0.5 μg/kg/day) and in food (1 μg/kg/day). Due to Cd being progressively accumulated in tissues such as the kidney, liver, lung, bone, and adipose tissue, it has high bioavailability and a long half-life in the body, thereby exerting toxic effects (Satarug et al. 2010, 2023; Thévenod and Lee 2013; Sarmiento-Ortega et al. 2025a).
Chronic Cd exposure has been associated with a broad spectrum of diseases, including kidney and liver dysfunction, reproductive disorders, cardiovascular disease, cancer, and metabolic disturbances, many of them mediated by oxidative stress, inflammation, and persistent cellular damage (Edwards and Prozialeck 2009; Satarug et al. 2010; Luevano and Damodaran 2014; Edwards and Ackerman 2016; Sarmiento-Ortega et al. 2017, 2022, 2023; Das and Al-Naemi 2019; Chung and Chang 2025). However, recently, it has been questioned whether Cd exposure is related to obesity and adipose tissue dysfunction (Tinkov et al. 2017; Attia et al. 2022b, a; Sarmiento-Ortega et al. 2022, 2025b; Satarug 2023; Zhu et al. 2024).
White adipose tissue (WAT), traditionally considered an energy reservoir that provides insulation for the body, plays roles in thermoregulation and mechanical organ protection. Still, today it is recognized as an endocrine and immunologically active organ too. Its participation in energy and metabolic homeostasis depends on a delicate interaction between adipocytes, immune cells, and extracellular matrix (Yang Loureiro et al. 2022; Huang et al. 2024). WAT is predominantly located in subcutaneous and visceral depots, with smaller amounts found in bone marrow and muscle tissue. Visceral WAT comprises 10–20% of total body fat in men and 5–10% in women; however, it is also more prone to inflammation, contributing to a higher risk of chronic diseases. In rodents, the epididymis is the most studied visceral WAT because its dysfunction is a hallmark of metabolic and chronic-degenerative diseases (Lopez-Yus et al. 2024; Blüher 2024).
The hallmarks of visceral WAT dysfunction can be summarized as adipocyte hypertrophy with adiposopathy: hyperleptinemia, hypoadiponectinemia, selective adipocyte insulin resistance, immune cell infiltration of pro-inflammatory macrophage and lymphocyte that induce fibrosis, and conditions that contribute to ectopic fat deposition (in the liver, pancreas, and other organs), diabetes development, and atherogenic conditions (Reyes-Farias et al. 2021; Sarmiento-Ortega et al. 2025b). M1 pro-inflammatory macrophages in dysfunctional visceral WAT under chronic overproduce cytokines such as interleukin 6 (IL-6), tumor necrosis factor α (TNF-α), and interleukin 1-β (IL-1β), altering the secretion of adipokines such as leptin and adiponectin (Kawai et al. 2021; Kolb 2022; Tilg et al. 2025). In addition, chronic inflammation favors fibrosis, a condition that stiffens the architecture of adipose tissue, limits its functional expansion, and impairs its metabolic response capacity (Datta et al. 2018; Gliniak et al. 2023).
In this context, research on the effects of Cd on adipose tissue is still incipient, despite its potential to induce metabolic dysfunction. The work aims to deepen this relationship by evaluating the immunological, structural, and functional epididymal WAT alterations of male Wistar rats induced by chronic exposure to environmental doses of Cd, across subacute, subchronic, and chronic periods, with a focus on changes in inflammatory responses, macrophage polarization, fibrosis, and the dysregulation of leptin/adiponectin production.
Materials and methods
Animals and treatment
Ninety male Wistar rats (initial weight: 70–80 g) were procured from the “Claude Bernard” animal facility at the Universidad Autónoma de Puebla (Puebla, Mexico). Animals were housed in a temperature-controlled environment (22 °C), under a 12-h light/dark cycle, with unrestricted access to standard rodent chow and water. Animals were maintained on a balanced diet (5001, LabDiet; St. Louis, MO, USA) until reaching a body weight of approximately 200 g. Then, rats were randomly assigned to control (n = 30) and experimental groups (n = 60). The control group received Cd-free drinking water ad libitum, whereas the experimental groups were exposed to cadmium chloride (CdCl₂) via drinking water at concentrations of 15 ppm and 32 ppm. Control and experimental groups were evaluated at six different time points: 15 days, 1, 2, 3, 4, and 5 months (n = 5 per group). At the end of each experimental period, animals were fasted for 4–5 h before sample collection. Blood was obtained via cardiac puncture under deep anesthesia induced with a xylazine/ketamine combination (20/137 mg/kg). Serum was obtained by centrifugation and stored at − 70 °C until analysis. Epididymal adipose tissue was excised, rinsed with cold saline to remove residual blood, and either frozen at − 70 °C or fixed in 10% neutral buffered formalin for histological processing. All experimental procedures conformed to the ethical guidelines established by the Mexican Official Standard NOM-062-ZOO-1999 and were approved by the Institutional Animal Care and Use Committee (CICUAL: UALVIEP 22/2). The study was conducted in full accordance with national and international standards for laboratory animal welfare, and all efforts were made to reduce animal use and minimize distress or discomfort throughout the protocol.
Biochemical assays in serum
Serum levels of TNF-α, IL-6, IL-1β, interleukin 10 (IL-10, leptin, and adiponectin were determined using ELISA commercial kits (Merck Millipore; Toluca, Mexico) and quantified in a Stat fax 2600 plate reader at 415 nm (WinerLab Group, Buenos Aires, Argentina). The adiponectin/leptin index (A/L index) was calculated by dividing the adiponectin concentration by the leptin concentration (Frühbeck et al. 2018).
Adipose tissue techniques
CD206+ and CD16+ cells immunofluorescence staining
According to standard procedures, paraffin-embedded adipose tissue Sects. (9 µm thick) were deparaffinized and rehydrated. For immunofluorescence staining, tissue sections were subjected to antigen retrieval procedures. Subsequently, sections were incubated with CD206 and CD16 primary antibodies (Santa Cruz Biotechnology Inc., CA, USA), followed by a rhodamine-conjugated secondary antibody and a fluorescein isothiocyanate (FITC)- conjugated secondary antibody (Jackson ImmunoResearch Laboratories). Confocal microscopy was performed using a Nikon A1 confocal microscope (Tokyo, Japan); the objective Nikon Plan Apo 20X DIC M N2 (NA 0.75) was used to capture images at 20 × magnification. ImageJ software (NIH) was used for contrast, brightness, and pseudocolor adjustments. Results were expressed as a ratio of positive cells among adipocytes per field.
Picrosirius red staining
Picrosirius red staining was performed to evaluate tissue fibrosis. Paraffin-embedded adipose tissue Sects. (9 µm thick) were deparaffinized and rehydrated, incubated in Picrosirius red solution for one hour, and then washed with acidic water. Finally, they were assembled with resinous media. Photomicrographs were captured at 20X magnification using a polarized light microscope (Leica Microsystems GmbH, Wetzlar, Germany). ImageJ software (National Institutes of Health, USA) was used to quantify total fibrosis, which was expressed as the ratio of the area of fibrous tissue stained with picrosirius to the total area of the field (Coelho et al. 2018). The percentage of birefringent tissue was analyzed as the ratio of the area of birefringent tissue to the total area of the field using ImageJ software (National Institutes of Health, USA).
Leptin and adiponectin immunofluorescence staining
To perform immunofluorescence staining, tissue sections underwent antigen retrieval procedures. Afterward, the sections were incubated with a primary antibody targeting Leptin (Abcam, Cambridge, MA) and Adiponectin (Cell Signaling Technology, Massachusetts, USA.), followed by treatment with a secondary antibody conjugated to rhodamine (Jackson ImmunoResearch Laboratories) and FITC conjugated secondary antibody, respectively (Jackson ImmunoResearch Laboratories). Fluorescence microscopy equipped with an integrated camera (Leica Microsystems GmbH, Wetzlar, Germany) was utilized to acquire images at a magnification of 20X. For semi-quantitative analysis, ImageJ software (National Institutes of Health, USA) was used, with the results expressed in an arbitrary value.
Immunoblotting of NF-κB
Frozen epididymal adipose tissue was homogenized in ice-cold RIPA buffer supplemented with a protease inhibitor cocktail. After centrifugation at 3000 rpm for 10 min at 4 °C, the supernatant containing cytoplasmic proteins was collected. The remaining pellet was processed for nuclear protein extraction using a commercial buffer under constant agitation, followed by centrifugation at 15,000 rpm for 10 min at 4 °C to isolate the nuclear fraction. Protein lysates were mixed with Laemmli buffer and resolved by SDS-PAGE. Electrophoretic transfer to PVDF membranes was performed using Mini Trans-Blot systems (Bio-Rad). Membranes were blocked and incubated overnight at 4 °C with a primary antibody against nuclear factor-κB (NF-κB) (Santa Cruz, CA, USA), followed by incubation with HRP-conjugated secondary antibodies. Signal detection was performed via chemiluminescence (Immobilon Western HRP substrate, Millipore), and bands were visualized using a Nine Alliance Q9 mini photodocumenter. Densitometric analysis was conducted with Image Lab software (Bio-Rad), and band intensities were normalized to Lamin A as a loading control. Relative expression was reported as fold change using the control group (assigned a value of 1) for semi-quantitative comparison.
Pro-inflammatory and anti-inflammatory cytokines
Adipose tissue was homogenized in PBS with the addition of protease inhibitors, followed by centrifugation at 2500 × g for 30 min at 4 °C using a 17 TR microcentrifuge (Next Advance, Averill Park, NY). The concentrations of IL-1β, IL-6, TNF-α, IL-10, interleukin 1 receptor antagonist (IL-1Ra), and transforming growth factor beta (TGF-β) in the resulting supernatant were determined using ELISA kits (Merck Millipore; Toluca, Mexico) according to the manufacturer’s instructions. Cytokine levels were normalized to the total protein content and expressed as pg/mg of protein.
Heatmap
The adiponectin/leptin index was calculated based on the individual concentrations of these adipokines. To assess the relationship between the adiponectin/leptin index and inflammatory biomarkers at different time points throughout the experiment (15 days, 1 month, 2 months, 3 months, 4 months, and 5 months), Pearson’s correlation coefficient was determined using IBM SPSS Statistics. Correlation values were visualized in a correlation map using a bubble plot, where color represents the direction of the correlation (red for positive correlations and blue for negative correlations), and bubble size reflects the strength of the correlation.
Statistical analysis
The results are presented as the mean ± standard error of the mean (SEM). Data normality was assessed using the Shapiro–Wilk test. Statistical differences between groups for normally distributed data were determined using a one-way analysis of variance (ANOVA). To control for Type I error, post hoc analysis was performed using Bonferroni’s correction for pairwise comparisons against the control group. For data that did not follow a normal distribution (semi-quantitative data), the Kruskal–Wallis test was employed. These analyses were conducted using GraphPad Prism 8 (GraphPad Software Inc., USA). A Pearson’s correlation analysis was conducted to evaluate the linear relationship between specific variables using IBM SPSS Statistics, version 28.0 (IBM Corp., Armonk, NY, USA). All statistical tests were two-tailed, and a significance level of p < 0.05 was considered statistically significant.
Results
Impact of cadmium exposure on interleukin and serum hormones
Serum levels of TNF-α, IL-6, IL-1β, IL-10, adiponectin, and leptin were quantified in rats exposed to Cd at 15 ppm or 32 ppm at different time-cohorts (Table 1). At 15 days, only IL-10 increased in both exposure groups: 62.5% (15 ppm) and 72.8% (32 ppm). In the groups exposed for 1 month, the 15 ppm group increased IL-6 (17.3%) and IL-10 (84.9%), while the 32 ppm group increased IL-6 (28.9%), IL-1β (28.5%), and IL-10 (84.9%). By the second month, both groups presented progressive elevations in pro- and anti-inflammatory cytokines, dose-dependent. However, in the 32 ppm group, leptin was also augmented (14.6%). At 3 months, both Cd-exposed groups’ cytokines and leptin levels remained elevated, but adiponectin concentration diminished by 24.4% (15 ppm) and 30.1% (32 ppm). The severe inflammation induced by Cd was observed to persist during the fourth and fifth months of analysis, emphasizing the decline in adiponectin, which is suggestive of adipose dysfunction. Thus, we calculated the A/L index, which significantly diminished from 2 months (15 ppm: 27.3%; 32 ppm: 30.2%), 3 months (15 ppm: 30.0%; 32 ppm: − 36.7%), 4 months (15 ppm: 34.5%; 32 ppm: 44.8%), and 5 months (15 ppm: 36.6%; 32 ppm: 50.7%).Table 1. Effect of cadmium exposure on interleukin and serum hormonesTNF-α (pg/mL)IL-6 (pg/mL)IL-1β (pg/mL)IL-10 (pg/mL)Adiponectin (µg/mL)Leptin (ng/mL)A/L Index15 daysControl14.7 ± 0.7284.3 ± 1180.6 ± 832 ± 4.15.1 ± 0.42.8 ± 0.11.85 ± 0.0915 ppm15.2 ± 1.1291 ± 1484.5 ± 1052.7 ± 75.2 ± 0.32.9 ± 0.11.80 ± 0.0632 ppm14.9 ± 0.9311 ± 1286.1 ± 956 ± 5.85.1 ± 0.53.0 ± 0.21.82 ± 0.081 monthControl15.1 ± 1.4301 ± 8.982.8 ± 933 ± 3.54.7 ± 0.43.1 ± 0.11.78 ± 0.0415 ppm15.5 ± 0.6353 ± 1089.6 ± 1161.6 ± 5.74.9 ± 0.33.2 ± 0.41.70 ± 0.0732 ppm15.5 ± 1.1388 ± 13106.4 ± 879 ± 6.84.8 ± 0.43.0 ± 0.21.63 ± 0.092 monthsControl16.1 ± 1.4314 ± 1483 ± 933.7 ± 3.55.1 ± 0.13.14 ± 0.31.72 ± 0.0315 ppm21.3 ± 2.5368 ± 8108.4 ± 1377.4 ± 2.74.8 ± 0.83.5 ± 0.51.26 ± 0.0532 ppm23 ± 1.8372 ± 15120.7 ± 1199.8 ± 6.84.9 ± 0.33.6 ± 0.21.21 ± 0.093 monthsControl16.6 ± 0.8329 ± 1391.8 ± 1135 ± 65.3 ± 0.52.9 ± 0.31.54 ± 0.0815 ppm22.7 ± 1.5389 ± 12121.3 ± 1369 ± 8.94.0 ± 0.43.6 ± 0.21.07 ± 0.0632 ppm24.2 ± 1.3410 ± 10167 ± 1086.1 ± 4.63.7 ± 0.53.8 ± 0.10.96 ± 0.074 monthsControl17.1 ± 1.2319 ± 10105.8 ± 1239.4 ± 4.84.9 ± 0.33.3 ± 0.61.45 ± 0.0915 ppm23.2 ± 1.8428 ± 12143 ± 1556.9 ± 5.63.8 ± 0.43.9 ± 0.50.96 ± 0.0632 ppm25.1 ± 1.4444 ± 13195.2 ± 1467.3 ± 73.3 ± 0.54.5 ± 0.40.80 ± 0.055 monthsControl17.2 ± 1.4322 ± 8.598.3 ± 1041 ± 4.54.8 ± 0.63.4 ± 0.31.42 ± 0.0615 ppm24.6 ± 1.3451 ± 11184.6 ± 1344.7 ± 5.22.9 ± 0.44.3 ± 0.20.93 ± 0.0432 ppm31.4 ± 1.1531 ± 17233.1 ± 1450.3 ± 6.12.6 ± 0.34.8 ± 0.40.71 ± 0.05The results shown are the average of 5 different experiments ± SEM. (*) indicates a significant difference with respect to control groups by a one-way ANOVA followed by a Bonferroni test
Effect of Cd exposure on epididymal adipose infiltration of pro- and anti-inflammatory macrophages
The expression of anti-inflammatory (CD206⁺) and pro-inflammatory macrophages (CD16⁺) was evaluated in epididymal adipose tissue (Fig. 1A–D). The infiltration of inflammatory macrophages increased from the first month of Cd exposure in the groups, reaching 646.9% in the 15 ppm group and 812.5% in the 32 ppm group. However, CD206⁺ macrophages observed a maximal increase at 3 months of analysis, in both groups by 148.0% and 230.8%, respectively. In the consecutive time-cohort analysis, anti-inflammatory macrophages decreased even below the control group at 5 months.
Fig. 1. Effect of cadmium exposure on epididymal adipose expression of Pro and anti-inflammatory macrophages. A Representative images of CD206-positive. B CD206 positive cells by number of adipocytes. C Representative images of CD16-positive cells. D CD16-positive cells by number of adipocytes. The results shown are the average of 5 different experiments ± SEM. (*) indicates a significant difference regarding control groups (p ≤ 0.05) by a Kruskal–Wallis test
Cadmium exposure induces overexpression of NF-κB in the epididymal adipose
The expression of NF-κB in epididymal adipose tissue increased over time, but was not Cd dose-dependent until five months of exposure (Fig. 2A and B). In the group exposed to 15 ppm, a significant nuclear increase of 10.4% was observed starting at the second month and sustained over time: 22.8% (2 months), 27.0% (3 months), 20.7% (4 months), and 41.4% (5 months). Similarly, in the 32 ppm group, NF-κB expression increased progressively: 8.3% (2 months), 24.7% (3 months), 26.5% (4 months), 33.3% (5 months), reaching a peak of 83.1% at the fifth month of exposure.
Fig. 2. Effect of cadmium exposure on epididymal adipose expression of NF-κB. A Western transfer analysis of the expression of the protein NF-κB in nuclear extracts of the epididymal adipose tissue. B Densitometric analysis of NF-κB expression (normalized values). The results shown are the average of 5 different experiments ± SEM. (*) indicates a significant difference regarding control groups (p ≤ 0.05) by a one-way ANOVA followed by a Bonferroni post-test
Effect of cadmium exposure on epididymal adipose inflammatory and anti-inflammatory cytokines
The IL-6 concentration in epididymal adipose tissue increased significantly and progressively from the first month of exposure (Fig. 3A). In the 15 ppm group, IL-6 levels rose by 73.9% to 126.7%, and in the 32 ppm group by 84.5% to 220.2%. TNF-α exhibited the same dynamic, but it was more pronounced in the 32 ppm group (Fig. 3B). IL-1β increased from the third month onward by 83.7% to 175.3% in the 15 ppm group and from the second month in the 32 ppm group by 91.9% to 270.3% (Fig. 3C). In contrast, the anti-inflammatory cytokine IL-10 increased in the 15 ppm group starting in the second month (27.5%), peaking at the third month (59.3%), followed by a gradual decline in the fourth and fifth months. The 32 ppm group showed a similar pattern, with increases from the first month (27.3%), reaching 47.2% (2 months) and 51.9% (3 months), followed by a decline from the fourth month onward (Fig. 3D). IL-1Ra did not differ between experimental and control groups (Fig. 3E). Finally, TGF-β levels increased only in the last time cohort. In both Cd exposure groups, the levels increased by 32.3% and 55.7% (15 ppm), and 40.3% and 63.5% (32 ppm) at the fourth and fifth months (Fig. 3F).
Fig. 3. Effect of cadmium exposure on epididymal adipose inflammation and anti-inflammation. A IL-6; B TNF-α; C IL-1β; D IL-10; E IL-1Ra; F TGF-β. The results shown are the average of five different experiments ± SEM. (*) indicates a significant difference regarding control groups (p ≤ 0.05) by a one-way ANOVA followed by a Bonferroni post-test
Cadmium exposure induces fibrosis in the epididymal adipose tissue
Fibrosis in epididymal adipose tissue was evaluated by picrosirius red staining (Fig. 4A). A significant fibrosis deposit of 20.5% was observed only for 4 months in the 32 ppm group. At 5 months, epididymal adipose tissue fibrosis was more evident in both Cd exposure groups, by 41.3% in the 15 ppm group and by 126.0% in the 32 ppm group (Fig. 4B). Additionally, collagen birefringence under polarized light—indicative of organized collagen fiber deposition—was detected only at 4 months in the 32 ppm group, and at 5 months in both Cd exposure groups (Fig. 4C).
Fig. 4. Effect of cadmium exposure on collagen deposition in epididymal adipose tissue using Picrosirius red staining. A Collagen (red fibers) in epididymal adipose tissue. B Collagen by polarized light to detect birefringence. C Percentage of fibrosis (red fibers) per field. D Quantification of the Birefringence for collagen. The results shown are the average of 5 different experiments ± SEM. (*) indicates a significant difference regarding control groups (p ≤ 0.05) by a Kruskal–Wallis test
Effects of Cd exposure on leptin and adiponectin expression in epididymal adipose tissue
Leptin expression in epididymal adipose tissue increased progressively with Cd exposure, time- and dose-dependent (Fig. 5A). An increase immunoreactivity was observed in both Cd exposure groups from the second month by 18.2% and 24.3%, reaching 45.7% and 77.8% (Fig. 5B). In contrast, adiponectin expression declined over time (Fig. 5C), with statistically significant reductions observed from 3 months in both Cd exposure groups 6.1% and 7.8% to reach 35.4% and 46.6% in the fifth month (Fig. 5D), which was more drastic in the 32 ppm group. These results strongly suggest a WAT dysfunction.
Fig. 5. Effects of cadmium exposure on leptin and adiponectin expression in epididymal adipose tissue. A Leptin immunofluorescence expression. B Densitometric analysis of Leptin expression (normalized values). C Adiponectin immunofluorescence expression. D Densitometric analysis of adiponectin expression (normalized values). The results shown are the average of 5 different experiments ± SEM. (*) indicates a significant difference regarding control groups (p ≤ 0.05) by a Kruskal–Wallis test
Pearson’s correlation coefficients between the adiponectin/leptin ratio versus pro-inflammatory and anti-inflammatory markers after Cd exposure
Pearson’s correlation coefficients, which evaluate the relationship between the adiponectin/leptin ratio and pro-inflammatory (IL-1β and CD16) and anti-inflammatory (IL-10 and CD206) markers following Cd exposure. The data is stratified by dose (15 ppm and 32 ppm) and exposure duration (15 days, 1, 2, 3, 4, and 5 months). In the 15 ppm group, a strong positive correlation was observed between the adiponectin/leptin ratio and CD206 at 15 days (0.814) and 4 months (0.821). Similarly, strong positive correlations were found with CD16 at 15 days (0.672) and 4 months (0.629). A strong positive correlation with IL-1β (0.751) was also noted at 2 months. Meanwhile, the adiponectin/leptin ratio showed a negative correlation with IL-1β at 15 days and 1 month (− 0.445 and − 0.456), with IL-10 at 15 days (− 0.104), 1 month (− 0.557), and 5 months (− 0.635) (Fig. 6).
Fig. 6. Heat map showing Pearson’s correlation coefficients between the Adiponectin/leptin ratio versus pro-inflammatory and anti-inflammatory markers after cadmium exposure. Significant correlations are colored either in red (positive) or blue (negative) hues. Numerical values are shown in Supplemental Table S1
Cadmium exposure to 32 ppm showed a positive correlation with IL-1β at 15 days and 1 month (0.740 and 0.429). The ratio also showed a positive correlation with CD206 at 15 days (0.460) and 1 month (0.724). However, the analysis showed a negative correlation with IL-1β at 3 and 4 months (− 0.899 and − 0.662). Negative correlations were found with IL-10 at 2 and 5 months (− 0.736 and − 0.304, respectively). The ratio was also negatively correlated with CD16 at 3 and 5 months (− 0.860 and − 0.547).
Discussion
In this work, we investigated the relationship between the immunological, structural, and functional epididymal WAT alterations of male Wistar rats induced by chronic exposure to environmental doses of Cd over time. Previously, we reported that Cd at a minimal risk dose is accumulated in epididymal WAT, leading to adipocyte hypertrophy, selective insulin resistance, high triglyceride storage, and the release of free fatty acids, as well as poor glycogen levels and impaired dynamic synthesis/release of adipokines. Also, we demonstrated that adipose insulin resistance increased simultaneously with lipolysis and glucose intolerance despite high glucose transporter 4 expression (Sarmiento-Ortega et al. 2025a ). We have provided strong evidence that chronic Cd exposure at environmental levels has toxic effects, which are independent of oxidative stress and contribute to the development of metabolic disorders (Sarmiento-Ortega et al. 2022, 2023; Moroni-González et al. 2023, 2024). However, it remains unclear whether this is due to adiposopathy (adipocyte dysfunction) and inflammatory/immunologic changes in adipocytes, as seen in metabolic diseases resulting from hypercaloric diet consumption or sedentary lifestyle.
In this sense, adipose tissue is increasingly recognized as a key immunometabolic organ, whose function extends far beyond energy storage. Chronic inflammation within adipose tissue, characterized by cytokine overproduction and adipokine imbalance, such as in adiposopathy, plays a key role in the development of insulin resistance, type 2 diabetes, and other metabolic disorders (Kawai et al. 2021; Kolb 2022; Tilg et al. 2025). WAT inflammation has been extensively studied in the context of obesity and overnutrition; however, its modulation by environmental toxicants such as Cd remains unexplored. The present study demonstrates that chronic Cd exposure induces a progressive and sustained systemic pro-inflammatory response (Table 1). This was evidenced by a serum increase of IL-6, IL-1β, and TNF-α levels, accompanied by dynamic alterations in anti-inflammatory cytokines such as IL-10 and TGF-β. The cytokine pattern could be the cause or consequence of inflammation in other tissues. It has been described how Cd can alter both innate and adaptive immunity, promoting the production of pro-inflammatory cytokines (IL-1β, IL-6, TNF-α), the activation of signaling pathways such as, the mitogen-activated protein kinases (MAPKs) and phosphoinositol 3-kinase (PI3K)/ protein kinase B (Akt), and the increase of reactive oxygen species (ROS), which contributes to tissue damage and organ dysfunction which appear to be dose, time, and tissue dependent, with some conflicting evidence suggesting immunosuppressive effects (Arroyo et al. 2013; Das and Al-Naemi 2019; Hossein-Khannazer et al. 2020). Although its inflammatory role in organs such as the liver, lungs, intestine, and kidneys has been documented, its inflammatory effect on adipose tissue remains poorly studied.
Adipose tissue is composed of a variety of cells, including adipocytes, endothelial cells, fibroblasts, and immune cells. Adipose tissue macrophages (ATMs) are essential for maintaining homeostasis by removing dead adipocytes and taking up lipids during lipolysis (Chavakis et al. 2023; Kado et al. 2024). Our results showed that Cd exposure increases circulating pro-inflammatory cytokines, accompanied by dynamic changes in anti-inflammatory cytokines. These changes were paralleled by a marked infiltration of pro-inflammatory CD16⁺ macrophages and a reduction in CD206⁺ macrophages over time, which is another hallmark of adiposopathy (Fig. 1). Attia et al. found that after exposure to CdCl_2_ at a dose of 15 mg of Cd/kg of body weight for 10 weeks, the expression of monocyte chemotactic protein 1 (MCP-1) mRNA decreased in retroperitoneal and subcutaneous adipose tissue, while an upregulation of the abdominal adipose tissue was observed. In addition, they also observed trends of positive or negative regulation in the expression of TNF-α, IL-6, and IL-10 according to the location of adipose tissue, suggesting a differential inflammatory response induced by Cd according to the location of adipose tissue (Attia et al. 2022a). Despite limited information, we believe that the change in macrophage phenotype and inflammatory profile is due to the accumulation of metal in the tissue, even at doses of minimal risk, which modulates the redox balance, leads to insulin resistance, and alters the signaling pathway of this hormone (Sarmiento-Ortega et al. 2022, 2025b).
The pro-inflammatory cytokines activate the NF-κB signaling pathway, which promotes the transcription of proteins and mediators involved in inflammatory processes, thus intensifying inflammation in adipose tissue (Griffin 2022). The activation of the NF-κB signaling pathway plays a central role in modulating macrophage polarization within adipose tissue (Hill et al. 2015). Our results showed that the expression of NF-κB in adipose tissue is dose and time-dependent on the concentration of Cd exposed (Fig. 2) and may be a cause and/or consequence of the observed macrophage polarization. A study in hens after exposure to 150 mg/k of CdCl_2_ for 60 days showed an increase in the expression of the NF-κB transcript in adipose tissue, accompanied by a pro-oxidant, pro-inflammatory environment regulated by heat shock proteins (Sun et al. 2023). Together, these findings suggest a disruption by Cd exposure of adipose immune homeostasis and a shift toward an unresolved inflammatory state, as can be evidenced in our results of the concentration of these cytokines directly in adipose tissue (Fig. 3). The data presented reveal a progressive and dose-dependent increase in pro-inflammatory cytokines (IL-6, TNF-α, TGF-β, and IL-1β) in adipose tissue following Cd exposure, which correlates with the increased presence of CD16⁺ (M1) macrophages and enhanced NF-κB activation. Although IL-10 showed transient elevation in early stages, its decline in later time points indicates an exhaustion of anti-inflammatory responses, consistent with the observed reduction in CD206⁺ (M2-like) macrophages. This phenotypic switch not only amplifies local inflammation but also contributes to extracellular matrix remodeling. In particular, the sustained presence of M1 macrophages and elevated inflammatory signaling, mainly by a late increase in TGF-β.
It is widely recognized that TGF-β promotes collagen deposition and fibrotic responses that generate tissue remodeling and extracellular matrix accumulation (ECM). Consistent with this, our findings revealed increased collagen content and birefringence in late stages of cadmium exposure (Fig. 4), suggesting that chronic inflammation mediated by NF-κB, as well as activation and macrophage dysfunction, is closely associated with the development of adipose tissue fibrosis, which is a distinctive feature of adiposopathy. Collagen in adipose tissue fulfills dual functions: at physiological levels, it supports the architecture and metabolic functioning of the tissue, but its excessive accumulation, as occurs in fibrosis, compromises its flexibility and lipid storage capacity, favoring metabolic dysfunction (Datta et al. 2018). Fibrosis in adipose tissue represents a key feature of its dysfunction in contexts such as obesity, where ECM accumulates excessively, limiting tissue expansion and favoring chronic inflammation and insulin resistance. Macrophages play a dual role, contributing to both collagen production and purification, with the activation of toll-like receptor 4 (TLR4), TGF-β/Smad, NF-κB, and MAPKs being the key mechanisms in fibrogenesis. In addition, fibrosis imposes physical restrictions that modify adipocyte function through mechanosensitive pathways, altering adipokine secretion and decreasing insulin sensitivity (Datta et al. 2018; Marcelin et al. 2022; Gliniak et al. 2023; Eisinger et al. 2024; Dahdah et al. 2024).
Cadmium exposure has been associated with the development of fibrosis in different organs, including the kidney, liver, and lungs. In animal models, Cd has been shown to activate inflammatory and profibrotic pathways in kidneys such as NF-κB, MAPK, and TGF-β/Smad, promoting fibroblast proliferation, collagen synthesis, and ECM accumulation (Joardar et al. 2019). In the kidney and liver, these effects are aggravated under conditions of oxidative stress or Nrf2 deficiency (Chen et al. 2023; Xu et al. 2025). Although less studied, Cd has also been reported to induce fibrosis in adipose tissue. A study with subacute exposure to high concentrations of Cd (100 ppm for 30 days) in rats demonstrated a significant increase in fibrosis in adipose tissue, accompanied by inflammation and apoptosis (da Costa et al. 2024). Our findings become relevant by demonstrating that fibrosis in adipose tissue can develop even with doses of minimal risk, although in a progressive way, which highlights the sensitivity of adipose tissue to prolonged exposures to environmentally relevant and subclinical doses. Furthermore, the final puzzle piece to evidence adiposopathy develop is a reduction of adiponectin levels, coupled with increased leptin expression both in serum and in adipose tissue (Fig. 5), supporting the notion of adipose tissue dysfunction and a potentially insulin-resistant phenotype, mediated by inflammation and by observed fibrosis, which reinforce the hypothesis that Cd disrupts immunometabolic interactions in a time- and dose-dependent manner, but reinforces the importance of considering the cumulative Cd effects in tissue remodeling processes.
Finally, we analyzed our most important results in a correlation map to identify dynamic patterns and relevant biochemical/clinical associations in our study. The results show that the balance between adiponectin and leptin, represented by the A/L index, is closely linked to the immune status of adipose tissue and that this relationship is profoundly altered by chronic Cd exposure. Under normal conditions, a high A/L index is usually associated with an anti-inflammatory profile, while a low index is linked to inflammation and adipocyte dysfunction (Frühbeck et al. 2018). The data show that the relationship between the A/L ratio and inflammatory biomarkers is dynamic and time-dependent, with differences between Cd exposure to 15 ppm and 32 ppm. While at 15 ppm, a mostly positive correlation with CD206 was observed, at 32 ppm, correlations with IL-1β suggest a progressive inflammatory response to a greater concentration of Cd exposure. The correlations observed reveal that under Cd exposure (especially at 32 ppm), the A/L index loses its protective relationship and inverts or weakens as the exposure time progresses. For example, the transition from positive to negative correlations with IL-1β and CD16 suggests that, despite an eventual early compensatory response, the tissue environment ends up favoring the activation of proinflammatory macrophages and the production of cytokines such as IL-1β, indicative of chronic inflammation. Loss of correlation with IL-10 and CD206 in advanced stages suggests depletion or suppression of the anti-inflammatory axis, likely due to persistence of the toxic stimulus and failure to resolve inflammation. This aligns with the concept of “dysfunctional immunometabolism” of adipose tissue, where hormonal signaling and innate immunity are decoupled, losing their regulatory synchrony (Kumari et al. 2018; Trim et al. 2018; Basso et al. 2025).
In summary, we demonstrate that chronic Cd exposure to environmental doses progressively induces inflammation in adipose tissue, evidenced by increased pro-inflammatory cytokines (IL-6, TNF-α, IL-1β), activation of the NF-κB pathway, infiltration of M1 macrophages (CD16⁺), and reduction of M2 macrophages (CD206⁺). These immunological changes were accompanied by endocrine dysfunction of the tissue, reflected in the imbalance of the leptin/adiponectin axis and the decrease in the A/L index. In addition, a late increase in TGF-β and development of fibrosis were observed in chronicity. Dynamic correlations between the A/L ratio and immune biomarkers suggest a progressive loss of tissue immunometabolic control. Hallmarks of adiposopathy were evidenced for the first time, induced by Cd exposure. In conclusion, Cd exposure at low concentrations deteriorates the immunometabolic homeostasis of adipose tissue and promotes an inflammatory and profibrotic environment, contributing to adiposopathy. These findings reinforce the need to consider adipose tissue as a sensitive target for environmental pollutants in the development of metabolic diseases.
Supplementary Information
Below is the link to the electronic supplementary material.
Supplementary Material 1
The reference list from the paper itself. Each links out to its DOI / PubMed record.