Application of LAMP and TaqMan qPCR for the rapid diagnosis of Anaplasma Capra (an emerging tick-borne zoonotic pathogen) and comparison with Nested-PCR
Kursat Altay, Ufuk Erol, Omer Faruk Sahin, Husnu Furkan Sakar

TL;DR
This study develops and compares new diagnostic tests for a tick-borne pathogen called Anaplasma capra, showing that LAMP and qPCR are more sensitive than traditional methods.
Contribution
The study introduces LAMP and TaqMan qPCR as novel, more sensitive diagnostic tools for Anaplasma capra detection.
Findings
qPCR and LAMP had detection limits 10 and 100 times greater than nested-PCR, respectively.
LAMP detected 3.33% positives in field samples, outperforming nested-PCR and qPCR.
The methods showed consistency in results, as confirmed by Cohen’s kappa test.
Abstract
Anaplasma capra was first detected in goats from China in 2012, and in the process, its presence has been demonstrated in humans, domestic animals, wild animals, and ticks in three continents (Asia, Europe, and Africa). Although there is limited information, it is thought that the agent may cause clinical symptoms in humans and animals. This study aimed to develop two molecular diagnostic assays [Taqman real-time PCR (qPCR) and Loop-Mediated Isothermal Amplification (LAMP)] that can be used in the diagnosis of A. capra, including known genotypes, by targeting the groEL gene, and to compare the limit of detection (LoD) and the effectiveness in field samples with nested-PCR. The detection limits of groEL-nested-PCR, qPCR, and LAMP methods were also investigated. PCR, qPCR, and both colorimetric and conventional LAMP assays were able to identify 8.25 × 10⁴, 8.25 × 10³, and 8.25 × 10²…
Genes, proteins, chemicals, diseases, species, mutations and cell lines named across the full text — each resolved to its canonical identifier and authoritative record.
Click any figure to enlarge with its caption.
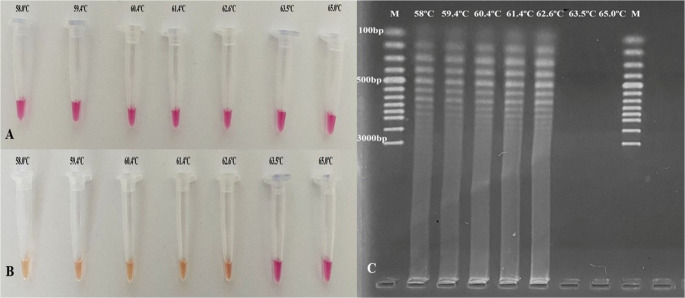 Figure 1
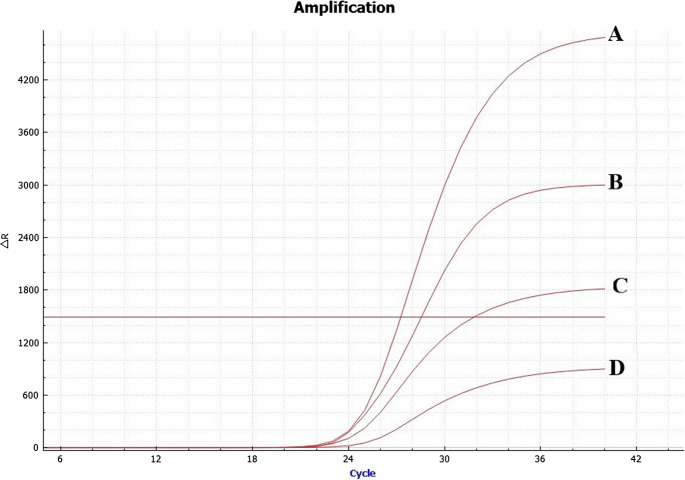 Figure 2
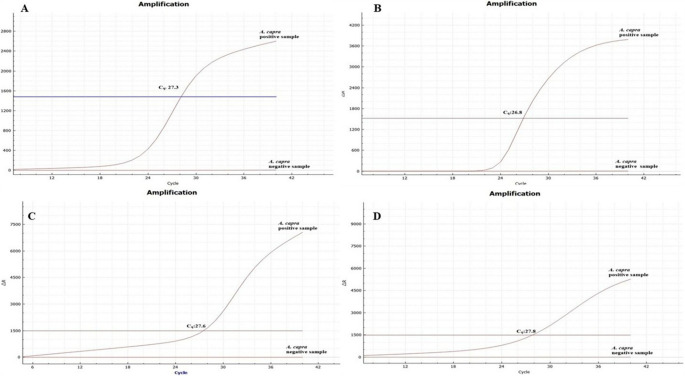 Figure 3
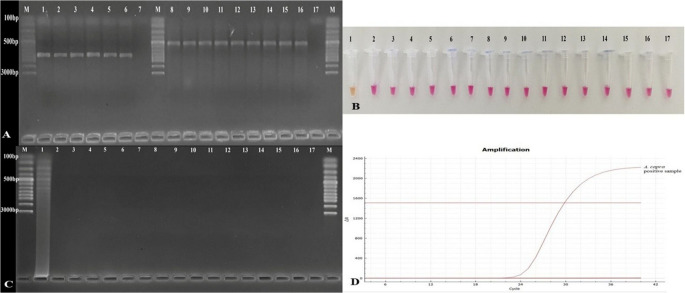 Figure 4
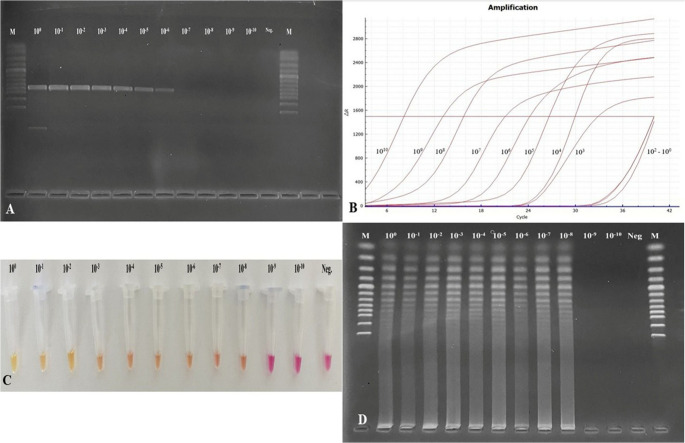 Figure 5
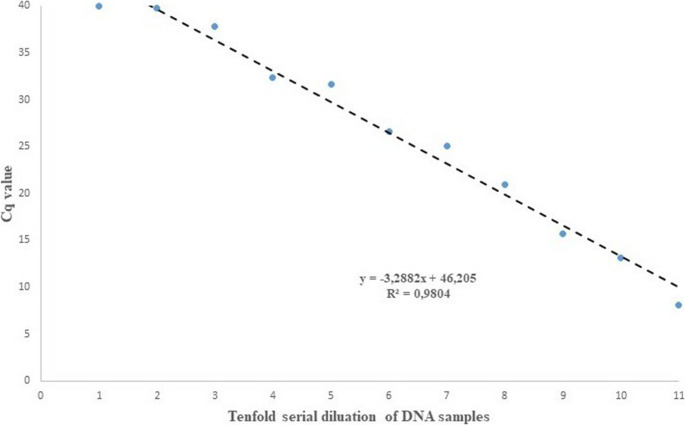 Figure 6
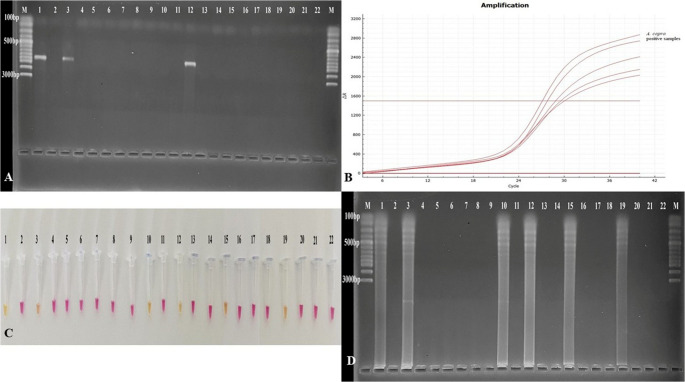 Figure 7
- —Sivas Cumhuriyet University
Peer Reviews
No public reviews on file for this paper yet. If you reviewed it on a platform where reviews are public (OpenReview, ICLR, NeurIPS, ICML), you can paste yours below so the community can read it here.
Videos
No videos yet. Explain this paper in a talk, walkthrough, or lecture? Add one.
Taxonomy
TopicsVector-borne infectious diseases · Vector-Borne Animal Diseases · Bartonella species infections research
Introduction
Anaplasma capra (genus: Anaplasma, family: Anaplasmataceae) is a gram-negative, obligate intracellular bacterium (Li et al. 2015; Peng et al. 2021). This pathogen was first identified in goats in China in 2012 as uncultured Anaplasma sp. (Liu et al. 2012). Subsequently, in 2015, the pathogen was identified in people with a history of tick bites in China by Li et al. (2015). The near-full sequence of 1,499 bp 16 S rRNA gene showed 27–73 nucleotide differences compared to other Anaplasma species, and the isolate was designated as A. capra (Li et al. 2015). In studies conducted by Khumalo et al. (2018) and Shi et al. (2020), it was determined that A. centrale identified in cattle and deer and Anaplasma sp. detected in serow were A. capra based on phylogenetic analyses of the 16 S rRNA gene, highlighting that this species had been circulating undetected for years among hosts. The zoonotic potential of A. capra was identified within just three years of its discovery, much faster than the approximately 60 years it took for A. phagocytophilum. The pathogen has since been detected in several domestic animals (cattle, sheep, horses, buffalo, dogs, and cats) and wildlife species, including various deer and onagers [reviewed by Altay et al. (2024a)].
Anaplasma species are classified as tick-borne pathogens (TBPs) due to their biological transmission through ixodid ticks (Dumler et al. 2001; Dumanli et al. 2012). Nevertheless, they can also be transmitted through contaminated surgical instruments, other blood-sucking arthropods, or even transplacental (Scoles et al. 2005a, b; Kocan et al. 2010; Aubry and Geale 2011). A. capra was initially identified in Ixodes persulcatus by Li et al. (2015). Since then, it has also been detected and reported in both engorged and host-seeking ticks, such as Haemaphysalis longicornis (Yan et al. 2021), Hae. qinghaiensis (Han et al. 2019), Rhipicephalus microplus (Guo et al. 2018), I. kashmiricus (Numan et al. 2023), Dermacentor everestianus and D. nuttalli (Han et al. 2019). Additionally, A. capra was detected in the salivary glands of a female Hae. concinna tick (Jouglin et al. 2025). Although current studies have documented the presence of A. capra in ticks, their vector competence should be confirmed with experimental studies.
The clinical manifestations of A. capra infection in its hosts remain poorly characterized due to the limited number of reported cases. Shi et al. (2019) reported a direct association between A. capra infection and anemia in dogs, while Staji et al. (2021) observed mild reductions in red blood cell, hematocrit, and hemoglobin levels, along with leukopenia, lymphopenia, thrombocytopenia, hypoalbuminemia, and hyperbilirubinemia in two Persian onagers. To date, only one study has described A. capra infection in humans, with clinical manifestations, including influenza-like symptoms (fever, malaise, headache, dizziness, and chills), gastrointestinal symptoms (nausea, vomiting, or diarrhea), rash, eschar, and regional lymphadenopathy. These cases were managed with doxycycline therapy (Li et al. 2015).
After it was understood that A. capra threatened human and animal health, numerous epidemiological studies were conducted, the pathogen has been reported in approximately 20 countries, including Angola, China, Ghana, Greece, France, India, Iran, Japan, Kyrgyzstan, Malaysia, Morocco, Pakistan, South Korea, Spain, Sweden, and Türkiye (Kawahara et al. 2006; Liu et al. 2012; Seo et al. 2018; Koh et al. 2018; Grandi et al. 2018; Jouglin et al. 2019; Staji et al. 2021; Barradas et al. 2021; Elhachimi et al. 2021; Altay et al. 2022a, b, c; Ishaq et al. 2022; Remesar et al. 2022; Saratsis et al. 2022; Addo et al. 2023; Kumar et al. 2023), suggesting that A. capra is a cosmopolitan species. Accurate epidemiological data are essential for effective disease control. To achieve these data, it is necessary to employ identification methods with high specificity and sensitivity to investigate the pathogens in intermediate and definitive hosts. However, studies conducted to date have shown that only conventional PCR methods have been used in the diagnosis of A. capra, and that different molecular-based methods have not been used (Koh et al. 2018; Jouglin et al. 2019; Staji et al. 2021; Barradas et al. 2021; Elhachimi et al. 2021; Altay et al. 2022a; Ishaq et al. 2022; Remesar et al. 2022; Addo et al. 2023; Kumar et al. 2023; Lin et al. 2023; Sahin et al. 2023). Molecular-based methods (such as LAMP and qPCR), which have higher specificity and sensitivity compared to the conventional PCR method (Notomi et al. 2000; Kubista et al. 2006; Bustin et al. 2009), can be used for the diagnosis of A. capra. Aims of this study were; (i) to apply LAMP and TaqMan qPCR methods targeting the groEL gene, which this gene is more informative than the 16 S rRNA gene, both in distinguishing Anaplasma species and in determining intraspecific genetic diversity of A. capra (Lew et al. 2003; Li et al. 2015; Yang et al. 2016a; Khumalo et al. 2018; Sahin et al. 2022), (ii) to determine specificity, sensitivity, limit of detection of LAMP and TaqMan qPCR assays, (iii) to assess diagnostic performance of these assays in field samples obtained from various hosts species.
Materials and methods
Anaplasma capra groEL-LAMP assays
Design of Anaplasma capra groEL-specific LAMP primers
Before designing LAMP primers, all A. capra groEL gene sequences available in GenBank were analyzed. A total of 205 groEL sequences isolated from cattle, sheep, goat, buffalo, dog, cat, human, red deer, swamp deer, roe deer, Persian onager, Korean water deer, R. microplus,* Hae. longicornis*,* Hae. qinghaiensis*, and D. everestianus were retrieved from GenBank; however, 192 were suitable for primer design, because the remaining sequences were too short to cover the target region. The sequences were aligned using the MEGA-11 software (Tamura et al. 2021). The nucleotide sequence of A. capra (GenBank accession number ON783820), selected as a representative of the 192 aligned sequences, were used for primer design. The primer sets were designed (Table 1) using the online program (NEB LAMP primer design tool (https://lamp.neb.com/#!/). The primers’ specificities were analyzed using the BLASTn algorithm.
Table 1*A. capra groEL-*specific LAMP primersThe name of primersNucleotide sequences (5’−3’)AcpF3TCGCAATGCAACGATAAGGTAcpB3GCGGATATRGTGGCAACCTGAcpFIPGTATCAGCGCCAGCAGCCTTG - CRTGYTCCATACTCACCGCAAcpBIPTGGGATTCTGAARGCYAAGGARG - CTTCAGAYRCAACTTCRCGCAcpLoop FCYTTRGCMACTTCCTCTATRACCTTAcpLoop BGCCGCCYTRCTGTCAATGAA
Optimization of Anaplasma capra groEL-LAMP (Conventional and Colorimetric LAMPs)
Optimal incubation temperature is critical for LAMP efficacy. The LAMP mix was incubated at several temperatures (58 °C to 65 °C) for 60 min to determine the optimal amplification temperature. A. capra positive DNA that was obtained from a water buffalo (Bubalus bubalis) blood sample (GenBank accession number: ON783820) and negative (DNase-RNase-free sterile water, Cat No.: 129114, Qiagen, Germany) controls were employed during the optimization process of both conventional and colorimetric LAMP assays.
The conventional groEL-LAMP was performed using Bst II Pro DNA Polymerase Large Fragment kit (Cat. No: P703-02, Vazyme). Conventional LAMP master mix was prepared in a final 25 µL reaction volume using; 2.5 µL 10× IsothermalAmp Buffer, 1.5 µL MgSO_4_ (100 mM), 3.5 µL dNTP Mix (10 mM each) (Cat. No: R0192, Thermo Scientific, Lithuania), 1.6 µM FIP, 1.6µM BIP, 0.2 µM F3, 0.2 µM B3, 0.8 µM LoopF, 0.8 µM LoopB, 0.32 U/µL Bst II Pro DNA Polymerase Large Fragment (8 U/µL), 1 µL template DNA (GenBank accession number: ON783820). 14.2 µL DNase/RNase-free distilled water (Cat No: 129114, Qiagen, Germany) was added to make the final reaction volume 25 µL. The amplification was performed in a PCR thermal cycler (TurboCycler (TCST-9622), Blue Ray Biotech, Taiwan) at 58–65 °C for 60 min, and a 10-minute incubation at 90 °C was applied for the enzyme inactivation. The LAMP amplification products were visualized on a 2% agarose gel stained with ethidium bromide after gel electrophoresis. The best amplification temperatures were recorded.
The colorimetric groEL-LAMP was carried out using WarmStart Colorimetric LAMP 2× Master Mix (Cat. No: M1800, New England Biolabs). Colorimetric LAMP master mix was done with a volume of 25 µL using; 12.5 µL WarmStart Colorimetric LAMP 2× Master Mix, 1.6 µM FIP, 1.6 µM BIP, 0.2 µM F3, 0.2 µM B3, 0.8 µM LoopF, 0.8 µM LoopB, 1.6 µM FIP, 1.6 µM BIP, 0.2 µM F3, 0.2 µM B3, 0.4 µM LoopF, 0.4 µM LoopB, 1 µL template DNA (GenBank accession number: ON783820). 9 µL DNase/RNase-free distilled water (Cat No: 129114, Qiagen, Germany) was added to make the final reaction volume 25 µL. The amplification was performed in the same temperature and time conditions as the conventional groEL-LAMP described above. The results of the colorimetric LAMP assay were evaluated visually according to color shift (pink to yellow in positive samples), and recorded.
Anaplasma capra groEL-TaqMan qPCR
Design of Anaplasma capra groEL-specific qPCR primers and prob
TaqMan qPCR primers and one probe were designed to target an 89 bp fragment of the groEL gene of A. capra (Table 2). During the design of primers and probe, the same sequences described in the section “Design of Anaplasma capra groEL-specific LAMP primers” were used. Following sequence analysis in MEGA-11 (Tamura et al. 2021), primers and probe were designed using the Real-time PCR (TaqMan) Primer and Probes Design Tool (https://www.genscript.com/) and the PrimerQuest Tool (https://eu.idtdna.com/). Primers and probes were evaluated using OligoAnalyzer (https://eu.idtdna.com/calc/analyzer) in accordance with their GC content, hairpin formation, and the melting temperature values. The most appropriate sequences were identified. The specificity of the primers and probe were evaluated using the BLASTn algorithm.
Table 2A. capra groEL-specific TaqMan qPCR primers and probeThe name of primers and probeNucleotide sequence (5’−3’)Acp TaqMan-FGCAAAGGGTTCAAAGACCTMGAAcp TaqMan- ProbeFAM-TGCAGTTYGATCGCGGATACCTTT-BHQAcpTaqMan-RCTCAAACTCTACCAGCATCTTCTC
Optimization of Anaplasma capra groEL- TaqMan qPCR
The A. capra groEL-specific TaqMan qPCR assay was performed using the TaqMan probe-based qPCR kit (BlasTaq™ Probe 2× qPCR MasterMix, abm^®^, Canada). The reaction mixture was prepared according to the manufacturer’s instructions, and the method was run at varying primers (200nM-500nM) and probe (100nM-300nM) concentrations to determine their optimal concentrations. A. capra positive DNA (GenBank accession number: ON783820) was used in the assay. The TaqMan qPCR assay was run after enzyme activation at 95 °C for 3 min, followed by 40 cycles of denaturation at 95 °C for 15 s and at 58 °C for 1 min. Amplification curves were controlled, and the required primer concentration was picked to create an efficient amplification curve. Furthermore, the TaqMan qPCR method was also carried out to determine the optimal annealing temperature. For this purpose, TaqMan qPCR assay was run at 95 °C for 3 min, followed by 40 cycles of denaturation at 95 °C for 15 s and annealing at varying temperatures (57–60 °C) for 1 min. The reaction mixture was prepared according to the manufacturer’s instructions (BlasTaq™ Probe 2× qPCR MasterMix, abm^®^, Canada), 300 nM primer and 150 nM probe were used in the final volume of the qPCR mixture. Amplifications was done using the Q1000 + Real-Time System (LongGene, China). Samples with a quantification cycle (Cq) value ≤ 35 were considered positive. A. capra positive DNA that was obtained from water buffalo blood (Bubalus bubalis) sample (GenBank accession number: ON783820) and negative (DNase-RNase free water, Cat No: 129114, Qiagen, Germany) controls were included in the above-mentioned TaqMan qPCR assays.
Determination of specificities of LAMP and TaqMan qPCR assays
To evaluate assay specificity, positive control DNAs from common tick-borne haemoparasite species were included. The corresponding details are listed in Table 3.
Prior to conducting the specificity assays, the positive control DNA samples listed in Table 3 were subjected to PCR with primers AnaplsppF (5′-AGAAGAAGTCCCGGCAAACT-3′) and AnaplR3 (5′-GAGACGACTTTTACGGATTAGCTC-3′) which amplify approximately 800 bp fragment of the 16 S rRNA gene region of species in the Anaplasma species (Zobba et al. 2014), and BJ1 (5′-GTCTTGTAATTGGAATGATGG-3′) and BN2 (5′-TAGTTTATGGTTAGGACTACG-3′) which amplify approximately 500 bp fragment of the 18 S rRNA gene region of species in the Theileria and Babesia species (Casati et al. 2006), to assess their integrity and quality prior to their inclusion in the specificity assays. PCR assays were performed as described by Zobba et al. (2014) and Casati et al. (2006). After the PCR amplification, specific amplicons were visualized by a UV transilluminator following agarose gel electrophoresis. The results were recorded, and the samples were used to determine the specificities of the LAMP (conventional and colorimetric) and TaqMan qPCR assays. LAMPs and TaqMan qPCR assays were performed as described in the relevant sections above.
Table 3. Positive control DNA samples used in the specificity analyses of the LAMP and TaqMan qPCRSpeciesThe type of animal from which it was obtainedThe detection methodReferences A. capra CattlePCR Altay et al. 2022a A. ovis SheepPCR Altay et al. 2022b A. bovis CattlePCR Altay et al. 2024b A. marginale CattlePCR Altay et al. 2020 A. centrale CattlePCR Altay et al. 2024cA. phagocytophilum like-1 and like-2 mixSheepPCR Erol et al. 2022 B. bigemina CattleRLB Altay et al. 2020 B. major CattleRLB Altay et al. 2022b B. occultans CattleRLB Altay et al. 2022b T. annulata CattleRLB Altay et al. 2022b T. orientalis CattleRLB Altay et al. 2022bTheileria sp. MK.SheepRLB Altay et al. 2017 T. ovis SheepRLB Altay et al. 2017Theileria sp. OT3SheepRLB Altay et al. 2017 T. equi HorsePCR Altay et al. 2024cPCR polymerase chain reaction, RLB reverse line blotting
Determination of limit of detection (LoD) of groEL-nested PCR, LAMP, and TaqMan qPCR
Recombinant plasmids were constructed by inserting an 874 bp fragment of the A. capra groEL gene. Before this process, A. capra groEL gene was amplified by nested PCR using Outer f (5′-GCGAGGCGTTAGACAAGTCCATT-3′)/Outer r (5′-TCCAGAGATGCAAGCGTGTATAG-3′) and Inner f (5′-TGAAGAGCATCAAACCCGAAG-3′)/Inner r (5′-CTGCTCGTGATGCTATCGG-3′) (Yang et al. 2016a) to obtain target A. capra DNA. Nested-PCR assay was performed as described by Yang et al. (2016a). Specific amplicons were analysed using a UV transilluminator, subsequent to agarose gel electrophoresis following the PCR test.
The amplicon was excised from the agarose gel and purified using a PCR Clean-up & Gel Extraction Kit (Cat. No: NA006–0300, GeneDireX, Taiwan) following the company’s protocol prior to cloning into the plasmid. The purified PCR products were cloned into pJET1.2/blunt cloning vector using CloneJET PCR Cloning Kit (Ref No: K1232, Thermo Scientific, Lithuania) following the Blunt-End Cloning Protocol. Confirmation of the recombinant clones was carried out using PCR amplification of the inserted fragment. The recombinant plasmids were purified using GeneJet Plasmid Miniprep Kit (Ref No: K0502, Thermo Scientific, Lithuania), and stored at −20 °C until the primer detection limits were determined.
To determine the limit of detection of the nested PCR, LAMP, and TaqMan qPCR, the purified recombinant plasmids were quantified using a NanoDrop (Denovix Ds-11, USA). The number of DNA copies in the each sample was calculated using an online programme (https://www.technologynetworks.com/tn/tools/copynumbercalculator) with the following formula:
\documentclass[12pt]{minimal} \usepackage{amsmath} \usepackage{wasysym} \usepackage{amsfonts} \usepackage{amssymb} \usepackage{amsbsy} \usepackage{mathrsfs} \usepackage{upgreek} \setlength{\oddsidemargin}{-69pt} \begin{document}$$Number\;of\;copies=\frac{DNA\;concentration\;\left(ng/\mu L\right)\times\left[6.022\times10^{23}\right]}{Length\;of\;template\;\left(bp\right)\;\times\;\left[1\times10^9\right]\times650}$$\end{document}Samples with a known DNA concentration were serially diluted tenfold to obtain a range of DNA amounts (from 10^0^ to 10^− 10^), which were then used as templates to determine the limits of detection of the methods. Moreover, these samples were also used for determination of the standard curve and TaqMan qPCR efficiency. The efficiency was calculated using the following formula: Efficiency (%) = 100 × (10^− 1/slope^−1). The linearity of data (R^2^ > 0.98), the E value in the 90–110% interval, and the stability of Cq values between five repetitions were considered indicators that the assay was well optimized. In this work, repeatability (intra-assay) was determined from the Cq-values of triplicates using the serially diluted A. capra DNA samples. Reproducibility (inter-assay) was determined from the mean Cq-values of five independent experiments using above mentioned samples. Both are referred to as coefficients of variation (CV = SD/mean×100) and were calculated for each concentration.
Assessment and comparison of the diagnostic performance of nested PCR, LAMP, and TaqMan qPCR methods using field samples
To demonstrate the usability and performace of the groEL-LAMP and groEL-qPCR assays in field samples and to compare the groEL-nested PCR, a total of 150 samples [(25 samples from each animal species: cattle (Bos taurus), buffalo (Bubalus bubalis), sheep (Ovis aries), goats (Capra hircus), cats (Felis catus), and dogs (Canis lupus familiaris)] collected from different regions of Türkiye were tested using with all three methods. In groEL-nested PCR, outer and inner primers were used as described by Yang et al. (2016a). For the LAMP and TaqMan qPCR, the samples were processed according to the respective protocols detailed in earlier sections. A. capra positive DNA (GenBank accession number: ON783820) and negative (DNase-RNase free water, Cat No: 129114, Qiagen, Germany) controls were included in the nested-PCR, LAMP, and TaqMan qPCR assays to monitor for inhibition and prevent false-positive results.
Levels of agreement between nested-PCR, TaqMan qPCR, and LAMP assays were calculated with Cohen’s kappa test (Cohen 1960), using the following formula;
\documentclass[12pt]{minimal} \usepackage{amsmath} \usepackage{wasysym} \usepackage{amsfonts} \usepackage{amssymb} \usepackage{amsbsy} \usepackage{mathrsfs} \usepackage{upgreek} \setlength{\oddsidemargin}{-69pt} \begin{document}$$K=\frac{Pr\left(a\right)-Pr\left(e\right)}{1-Pr\left(e\right)}$$\end{document}After the calculation, the obtained results were interpreted according to the standard recommended by Landis and Koch (1977).
Results
Optimization of Anaplasma capra specific diagnostic methods
Conventional and colorimetric groEL-LAMP
The reaction temperature and duration were determined for the *A. capra groEL-*colorimetric and conventional LAMP assays. To achieve this objective, temperatures ranging from 58 to 65 °C were implemented. No amplicon was obtained above 62.6 °C (Fig. 1). When the reactions were incubated starting from 30 min and increasing by 10 min, the best results were obtained in 60 min. False positive results began to appear after 90 min of incubation (data not shown). Therefore, all the subsequent analyses were conducted at 62 °C for 60 min.
Fig. 1. Colorimetric (A and B) and conventional LAMP (C) assays at different temperatures. A. The colorimetric LAMP method before being run at different temperatures (58–65 °C) B. A color shift from pink (negative) to bright yellow (positive) was observed. C. Ladder-like amplicons were seen in samples at appropriate temperatures (58–62.6 °C), and no amplicons were seen in other samples
GroEL-TaqMan qPCR
As a result of the optimization performed to determine primer and probe concentrations, it was observed that the positive sample did not pass the threshold value at 200 nM primers and 100 nM probe concentrations. It was seen that positive sample exceeded the threshold value at 31.8 Cq at 250 nM primers and 125 nM probe concentrations. With 300 nM primers and 150 nM probe concentrations, the positive sample passed threshold value at 28.3, while at 500 nM primers and 300 nM probe concentrations, the positive sample exceeded the threshold value at 27.6 (Fig. 2). Considering that there is no significant difference between the concentrations of the last two primers and probes, and that false positives may occur when using high concentrations of primers and probes, it has been decided to use 300 nM primer and 150 nM probe concentrations.
TaqMan qPCR annealing temperature was also optimized, and the optimal temperature was established at 58 °C. It was observed that the positive sample passed the threshold value at 26.8 C_q_, and there was no fluctuation in the negative control sample (Fig. 3). In other temperatures, it was observed that the positive sample exceeded the threshold value at higher C_q_ values (Cq value of 27.3 at 57 °C, 27.6 C_q_ at 59 °C, and 27.8 C_q_ at 60 °C). Consequently, the annealing temperature for the qPCR assay was determined to be 58 °C in accordance with the optimization assay.
Fig. 2. Optimization process of primer and probe concentration for the TaqMan qPCR assay. Curve A: 500 nM primers and 300 nM probe concentration, Curve B: 300 nM primers and 150 nM probe concentration, Curve C: 250 nM primers and 125 nM probe concentration, Curve D: 200 nM primers and 100 nM probe concentration
Fig. 3. The optimization of annealing temperatures for the TaqMan qPCR using A. capra positive and negative samples at different temperatures. A: Annealing temperature: 57 °C, B: Annealing temperature: 58 °C, C: Annealing temperature: 59 °C, D: Annealing temperature: 60 °C. A sigmoidal wave was observed in the positive sample
Specificity of conventional and colorimetric groEL-LAMP and groEL-qPCR assays
The primers and probe developed for the LAMP and TaqMan qPCR (Tables 1 and 2) were initially evaluated using BLASTn. It was revealed that these primers and probe were exclusively specific to the groEL gene of A. capra.
Furthermore, these primers and probe were also tested against 15 common TBPs (Table 3) isolated from cattle, sheep, and horses, in the laboratory. The DNA samples were checked for DNA degradation prior to use by PCR, and no degradation was detected (Fig. 3A). These 15 DNA samples, known to be positive for different pathogens, were examined using LAMP and TaqMan qPCR. Each method gave positive results exclusively for A. capra (Fig. 4B, C, D). These findings indicated that LAMP (conventional and colorimetric) and qPCR assays can be effectively employed to identify A. capra in hosts.
Fig. 4. Specificity assays of molecular methods. A: (1) A. capra, (2) A. ovis, 3. A. bovis, 4. A. marginale, 5. A. centrale, 6. (A) phagocytophilum like-1 and like-2 mix, 7. Anaplasma negative, 8. (B) bigemina, 9. B. major, 10. B. occultans, 11. T. annulata, 12. T. orientalis, 13. Theileria sp. MK., 14. T. ovis, 15. Theileria sp. OT3, 16. T. equi, 17. Theileria/Babesia negative. B: The colorimetric LAMP gave positive results (color change) for A. capra (1), but negative results for other Anaplasma/Theileria/Babesia samples. C: Conventional LAMP gave positive results (ladder-like amplicons) for A. capra (1), but negative results for other Anaplasma/Theileria/Babesia samples. D: The TaqMan qPCR gave positive results (sigmoidal wave) for A. capra (1) and negative results for other Anaplasma/Theileria/Babesia species
Limit of detection (LoD) of PCR, LAMP, and TaqMan qPCR
A sample containing 342.66 ng/µL (8.25 × 10^10^ copies of DNA/µL) of A. capra DNA was used to determine the limit of detection of the assays. Tenfold serial dilutions (from 10^0^ to 10^− 10^) were performed on the samples, and samples containing different amounts of DNA were obtained. As a result of conventional-PCR assay, positive results were obtained up to 10^− 6^ dilutions (8.25 × 10^4^ copies of DNA/µL) (Fig. 5A). A positive result was detected at 10^− 7^ dilutions (8.25 × 10^3^ copies of DNA/µL) in TaqMan qPCR (Fig. 5B). Color shift was seen up to 10^− 8^ dilutions in the colorimetric method (Fig. 5C), and similarly, the amplicon product was determined in the gel at 10^− 8^ (8.25 × 10^2^ copies of DNA/µL) dilutions in conventional LAMP (Fig. 5D). Consequently, the TaqMan qPCR assay was 10 times more sensitive than conventional PCR. The LAMP assay demonstrated even greater sensitivity, being 100 times more sensitive than PCR and 10 times more sensitive than TaqMan qPCR.
Fig. 5. Detection limit of molecular methods. A: groEL-nested PCR (positive amplicon was up to dilution of 10^− 6^), B: groEL-TaqMan qPCR (sigmoidal waves were present up to dilution of 10^− 7^), C: groEL-colorimetric LAMP (color shift was observed up to a dilution of 10^− 8^), D: groEL-conventional LAMP (ladder-like amplicons were seen up to a dilution of 10^− 8^)
Efficiency, repeatability and reproducibility of the TaqMan qPCR
In this work, the linear regression of the method was assessed as R^2^ > 0.98, and the efficiency value was determined as 101.42% (slope of curve:−3.2882) (Fig. 6).
Fig. 6. Standard curve demonstrating the linearity of the A. capra qPCR test. The efficiency value was calculated as 101.42%
The repeatability and reproducibility of the TaqMan qPCR were evaluated with the inter-run and intra-run standard deviation (SD) and coefficient of variation (CV). The inter-run SD varied between 0.000 and 0.678, and the intra-run SD varied between 0.000 and 0.695. The maximum coefficient of variation (CV%) was between 0.00 and 3.43, suggesting low variance among different repetitions and runs (Table 4).
Table 4. Reproducibility (inter-assay) and repeatability (intra-assay) variation values of the TaqMan-qPCR assay for tenfold serial dilutions of A. capra. The samples were researched three times in five independent assays (n = 15)Log10 copy numberMean CqInter-run SDIntra-run SDTotal SDTotal CV (%)10^10^8.1490.00980.0680.0690.8510^9^13.0330.4190.1540.4463.4310^8^15.4200.4040.1330.4202.7210^7^21.1000.2600.2380.3531.6710^6^24.9860.2400.2020.3141.2610^5^26.5000.5440.1450.5632.1210^4^31.6270.3300.1790.3741.1810^3^32.7330.6780.3220.7512.2910^2^39.0130.1960.6950.7221.8510^1^39.8000.2180.1280.2530.6410^0^40.0000.0000.0000.0000.00
Investigation of Anaplasma capra in field samples by LAMP, TaqMan qPCR, and nested PCR tests, and comparison of results
A total of 150 blood samples collected from cattle (n:25), sheep (n:25), goats (n:25), buffalo (n:25), dogs (n:25), and cats (n:25) were tested for A. capra using nested-PCR, LAMP, and TaqMan qPCR assays. A. capra was detected in two samples (1.33%, one cattle and one sheep) by nested PCR, four samples (2.66%, one cattle, two sheep, and one goat) by TaqMan qPCR, and five samples (3.33%, one cattle, two sheep, one goat, and one buffalo) by both colorimetric and conventional LAMP assays (Table 5). Two samples that were positive by groEL-nested PCR were also positive by TaqMan qPCR and LAMP. Additionally, all four samples that were identified as positive for TaqMan qPCR were also positive for LAMP. Detailed information on the molecular analysis of field samples is presented in Supplementary Table 1.
Table 5. Detection of A. capra in field samples (cattle, sheep, goat, buffalo, dog, and cats) based on GroEL by nested-PCR, TaqMan qPCR, colorimetric, and conventional LAMPMethodsNumber of tested samplesNumber of positive samplesNumber of negative samplesNested-PCR1502148TaqMan qPCR1504146Conventional LAMP1505145Colorimetric LAMP1505145
The representative test results of 20 (including all the positive samples and four from each animal species) of the 150 studied are shown in Fig. 7. The results of samples 10, 15, and 19 were positive with both colorimetric and conventional LAMP, as illustrated in Fig. 7, but they were negative with groEL-nested PCR. The sample number 19 was positive in LAMP and negative in TaqMan qPCR. On the other hand, two samples, numbered 3 and 12, gave positive results in groEL-nested PCR as well as positive results with both LAMP and TaqMan qPCR. While the assay results are consistent with each other, LAMP appears to be more sensitive to the detection of A. capra in field samples than both groEL-nested PCR and TaqMan qPCR.
Fig. 7. Investigation of A. capra in field samples. A: Nested-PCR results. M: marker, 1: positive control, 2: negative control, two positive samples [one cattle (3) and one sheep (12)]. B: TaqMan qPCR results. Positive samples [one positive control, four positive samples (one cattle, two sheep, and one goat)]. C: colorimetric LAMP and D: Conventional LAMP results. 1: positive control, 2: negative control, five positive samples [one cattle (3), two sheep (10 and 12), one goat (15), and one buffalo (19)]
Cohen’s kappa test results revealed that the level of agreement values between nested-PCR and LAMP assay was κ = 0.58; the value was κ = 0.67 for nested-PCR and TaqMan qPCR assay, and κ = 0.89 for LAMP and TaqMan qPCR. These results demonstrate nearly perfect agreement between LAMP and TaqMan qPCR. Results regarding the evaluation of other results are presented in Table 6.
Table 6. Determination of the level of agreement between identification assaysAssaysCohen’s kappa valueLevel of agreementNested-PCR vs. LAMP0.58ModerateNested-PCR vs. TaqMan qPCR0.67SubstantialLAMP vs. TaqMan qPCR0.89Almost perfectLevels of agreement values; 0.00–0.20.00.20; Slight, 0.21–0.40.21.40; Fair, 0.41–0.60.41.60; Moderate, 0.61–0.80.61.80; Substantial, 0.81–1.00.81.00; Almost perfect (Landis and Koch 1977)
Discussion
Tick-borne pathogens can cause mild to severe infection in hosts, including domestic animals and humans, resulting in economic losses, reaching billions of dollars in the world each year (Lew-Tabor and Valle 2016). Species in the Anaplasma genus are important TBPs, and these pathogens may cause severe clinical symptoms and even death in various hosts (Kocan et al. 2010; Li et al. 2015; Sahin et al. 2022). A. capra is one of these species, and its detection generally relies on PCR-based molecular diagnostic methods (Li et al. 2015; Koh et al. 2018; Staji et al. 2021; Barradas et al. 2021; Elhachimi et al. 2021; Altay et al. 2022a; Remesar et al. 2022; Addo et al. 2023; Kumar et al. 2023; Lin et al. 2023; Sahin et al. 2023). Recent studies have shown that molecular-based methods have many advantages and disadvantages compared to each other in terms of specificity, sensitivity, limit of detection, cost, and duration (Notomi et al. 2000; Mori et al. 2001; Seo et al. 2018; Peng et al. 2021). In this study, LAMP (conventional and colorimetric) and TaqMan qPCR methods were developed and optimized for the diagnosis of A. capra in different hosts, and the results of these methods, such as sensitivity, specificity, LoD, and performance of these methods in field samples, were compared with the results of the groEL-nested PCR method.
Loop-Mediated Isothermal Amplification is a molecular diagnostic method that amplifies target DNA in the sample under isothermal conditions (Notomi et al. 2000). The most important advantages of the LAMP are that the method is completed in approximately one hour, it does not require expensive equipment, and its specificity and sensitivity are higher compared to other molecular methods (Notomi et al. 2000; Mori et al. 2001, 2009). Several LAMP assays have been developed to facilitate the diagnosis of vector-borne pathogens (Ikadai et al. 2004; Alhassan et al. 2007; Ma et al. 2011; Yang et al. 2016b; Wang et al. 2018; Giglioti et al. 2019). On the other hand, there is no LAMP method for the diagnosis of A. capra. As a result of optimization processes of the LAMP assay designed in this study, it was observed that A. capra could be diagnosed in 60 min at 62.0 °C (Fig. 1), but false positives were observed at times over 90 min (data not shown). The advantages of the LAMP method, such as the ability to work in laboratories with limited infrastructure, obtaining results in a short time, specificity and sensitivity, etc., and the results obtained within the aim of the study showed that both conventional and colorometric LAMP methods can be used successfully in the diagnosis of A. capra in hosts.
Real-time PCR method, which is fast, reliable, and highly specific and sensitive, has been successfully used in the diagnosis of several Anaplasma species (Reinbold et al. 2010; Dahmani et al. 2015; Díaz-Sánchez et al. 2020; Nkosi et al. 2025). Real-time PCR has been employed in only one investigation for the detection of A. capra (Song et al. 2020). Nevertheless, the genetic diversity of A. capra was only characterized in 2022. Consequently, the primers and probes used in the 2020 study do not cover all currently recognized genotypes, potentially resulting in false-negative detections (data not shown). In this study, TaqMan qPCR primer and probes were designed for the detection of A. capra genotypes in hosts (Table 2). The results obtained during the optimization process of the TaqMan qPCR assay (Figs. 2, 3 and 4D) have demonstrated that this method can be successfully used in the diagnosis of A. capra. The TaqMan qPCR efficiency value was calculated as 101.42%, and this value was found to be within acceptable ranges (90–110%) for qPCR (Rogers-Broadway and Karteris 2015). In this work, repeatability (intra-assay) and reproducibility (inter-assay) variation values were revealed, which a strong correlation between the tests (Table 4). This study also demonstrated that A. capra can be diagnosed much more quickly and reliably using a TaqMan qPCR assay (approximately one hour) compared to conventional PCR (at least two hours, maybe more). It is considered that this will also make an important contribution to researchers.
It is widely recognized that molecular-based approaches exhibit greater specificity and sensitivity than serological and microscopic procedures. Therefore, researchers have preferred molecular methods for the identification of pathogens, like Anaplasma, in hosts (Barradas et al. 2021; Staji et al. 2021; Altay et al. 2022a, b, c). Nevertheless, research has demonstrated that the specificity and sensitivity of molecular techniques may vary (Mori et al. 2009; Ma et al. 2011; Noden et al. 2018; Díaz-Sánchez et al. 2020; Foo et al. 2020). Specificity testing of the LAMP (both conventional and colorimetric) and TaqMan qPCR methods developed in this study was performed by both in-silico analysis (using the BLASTn database) and laboratory testing of common TBPs listed in Table 3. The specificity test findings of both methods indicated that they exclusively amplified A. capra and did not give cross-reactions with other pathogens (Fig. 4). In addition, the LoD of the TaqMan qPCR assay and LAMPs were investigated, and the results were compared to those of the PCR assay. The results obtained after these procedures showed that the LoD of the LAMP method was 10 times higher than qPCR and 100 times higher than conventional PCR (Fig. 5). Similar results were seen in sensitivity and specificity analyses of LAMP and qPCR methods developed for the diagnosis of A. bovis (Wang et al. 2018), A. marginale (Giglioti et al. 2019; Díaz-Sánchez et al. 2020), Ehrlichia ruminantium (Nakao et al. 2010), Entamoeba histolytica (Foo et al. 2020), and Toxoplasma gondii (Lin et al. 2012). Vector-borne pathogens such as A. capra can cause long-lasting, persistent infections in hosts (Kocan et al. 2010; Brown and Barbet 2016; Jouglin et al. 2019). Given that the amount of pathogen in the bloodstream of such animals may be quite low, the diagnosis of persistently infected animals can be difficult. However, persistently infected animals can become a source of infection for vectors in the environment. Consequently, vectors can facilitate the transmission of these infections to various hosts. It is believed that methods with high sensitivity should be employed to prevent this situation and to protect both animals and humans in the environment (Kocan et al. 2010; Brown and Barbet 2016). LAMPs and TaqMan qPCR methods with high sensitivity were developed by targeting the groEL gene for the diagnosis of A. capra, and it is thought that these methods will be useful in studies aimed at determining the species identification and epidemiology.
The diagnostic performance of the LAMP and TaqMan qPCR assays developed in this study was also tested on field samples. In this work, 150 field samples were researched, and as can be seen in Table 5, more positive results were obtained with LAMP than with TaqMan qPCR and groEL-nested PCR (Fig. 7). Furthermore, when the levels of agreement between assays were calculated with Cohen’s kappa test, consistency between the methods was also observed (Table 6). Furthermore, the study employed TaqMan qPCR and LAMPs to analyze blood samples from cattle, sheep, goats, buffaloes, dogs, and cats. The results indicated that DNA of above-mentioned animals was not amplified. When evaluated together with the LoD, these results show the superiority of its sensitivity along with other usage advantages in epidemiological studies of blood parasites such as A. capra. In this case, it is important in studies to determine the epidemiology of a species with a wide host spectrum, such as A. capra.
Conclusion
In this study, for the first time, groEL-conventional and colorimetric LAMP and TaqMan qPCR assays were developed and optimized for the identification of A. capra in hosts. Data obtained during the optimization of the LAMP and TaqMan qPCR assay showed that both methods have higher specificity and sensitivity compared to conventional PCR. It has also been determined that both methods provide results much faster than PCR. LAMP and TaqMan qPCR assays, whose effectiveness is also determined in field studies using samples from different hosts, can make a great contribution to the understanding of the epidemiology of A. capra. Therefore, it is thought that these methods should be used in large-scale epidemiological studies involving more host species (such as various tick species and wild animals).
Supplementary Information
Below is the link to the electronic supplementary material.
Supplementary Material 1