Comparative efficacy of seed biopriming and soil drenching with Bacillus altitudinis TM22 and Bacillus atrophaeus MCM61 on the suppression of Fusarium wilt of cotton
Tahir Mahmood, Anam Moosa, Faisal Zulfiqar, Muhammad Naveed Aslam, Ohud Muslat Alharthy, Fatimah Hadadi, Ahmad F. Alhomodi, Seham Sater Alhelaify, Eman Fayad, Asim Alsenani, Salman Aloufi, Tolga İzgü

TL;DR
This study shows that using Bacillus strains TM22 and MCM61 via seed treatment is more effective than soil application in fighting cotton wilt and improving plant health.
Contribution
The study compares seed biopriming and soil drenching with Bacillus strains for the first time in suppressing Fusarium wilt of cotton.
Findings
Seed biopriming with TM22 and MCM61 reduced disease incidence and improved plant biomass more than soil drenching.
Co-application of TM22 and MCM61 enhanced defense enzymes and gene expression in cotton plants.
TM22 produced more hydrogen cyanide and had higher in vitro inhibition of the pathogen than MCM61.
Abstract
Bacillus species suppress fungal pathogens by producing antimicrobial peptides. However, there is limited evidence of comparative effects of seed biopriming and soil drenching with Bacillus on pathogen suppression. Among six Bacillus species, B. altitudinis TM22 exhibited the highest in vitro inhibition of Fusarium oxysporum f. sp. vasinfectum (FOV) associated with Fusarium wilt of cotton. Lipopeptides (LPs) and polyketides (PKs) were extracted from the two most inhibitory strains: B. altitudinis TM22 and B. atrophaeus MCM61, where LPs from TM22 showed higher in vitro inhibition of FOV. Liquid chromatography‐time‐of‐flight mass spectrometry (LC‐TOF/MS) analysis detected iturin, fengycin, surfactin, bacillibactin, bacillomycin, bacilysin and bacillaene in TM22, whereas iturin was deficient in MCM61. TM22 produced larger amounts of hydrogen cyanide, correlating with its higher…
Genes, proteins, chemicals, diseases, species, mutations and cell lines named across the full text — each resolved to its canonical identifier and authoritative record.
Click any figure to enlarge with its caption.
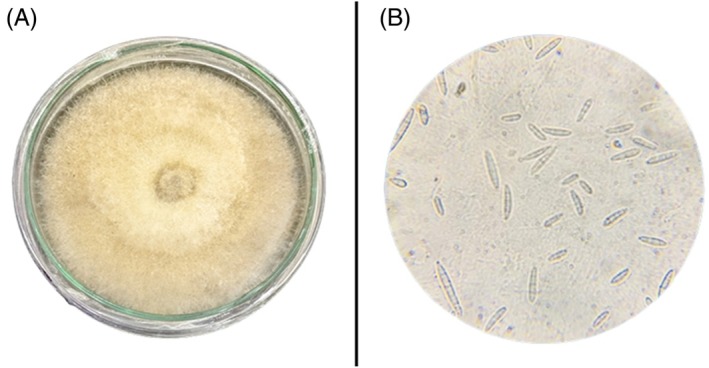 Figure 1
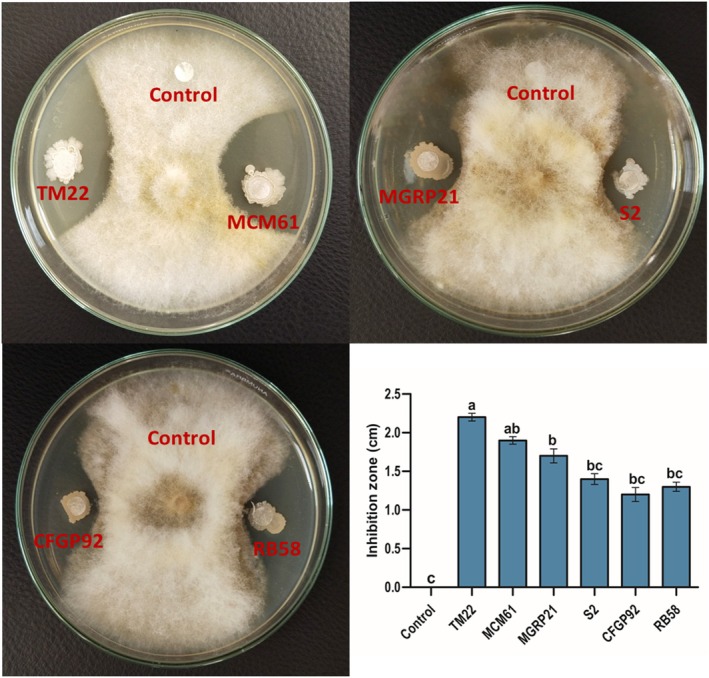 Figure 2
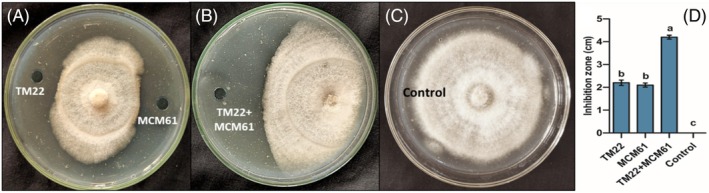 Figure 3
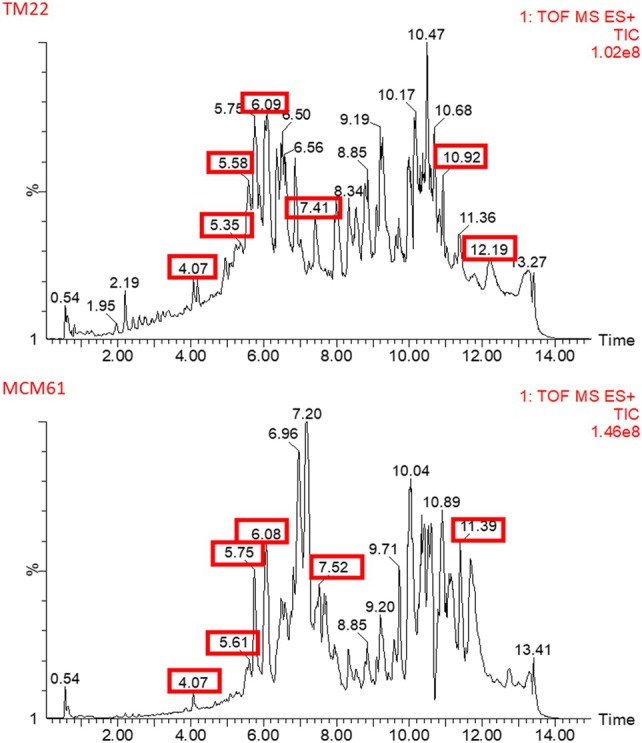 Figure 4
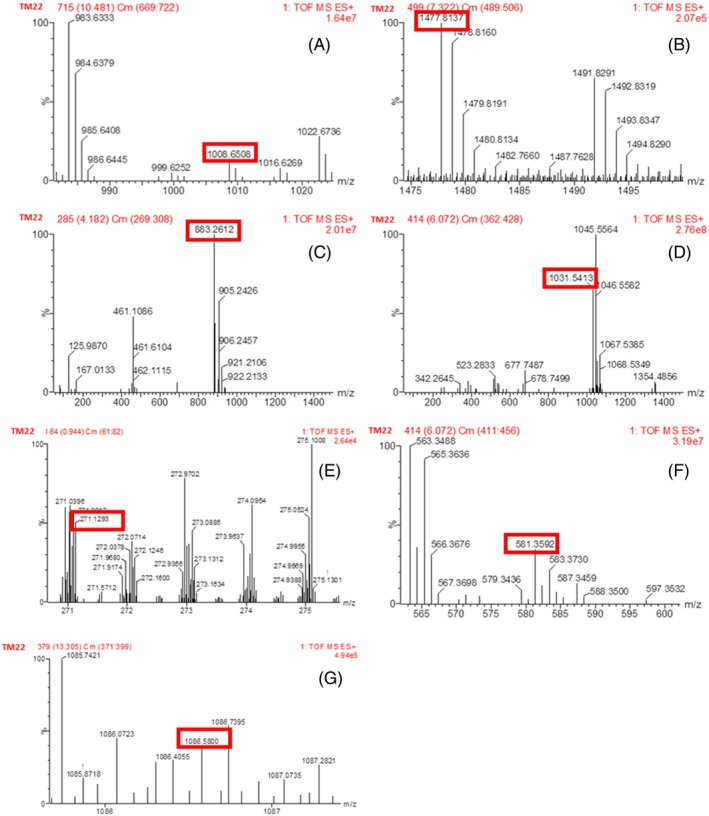 Figure 5
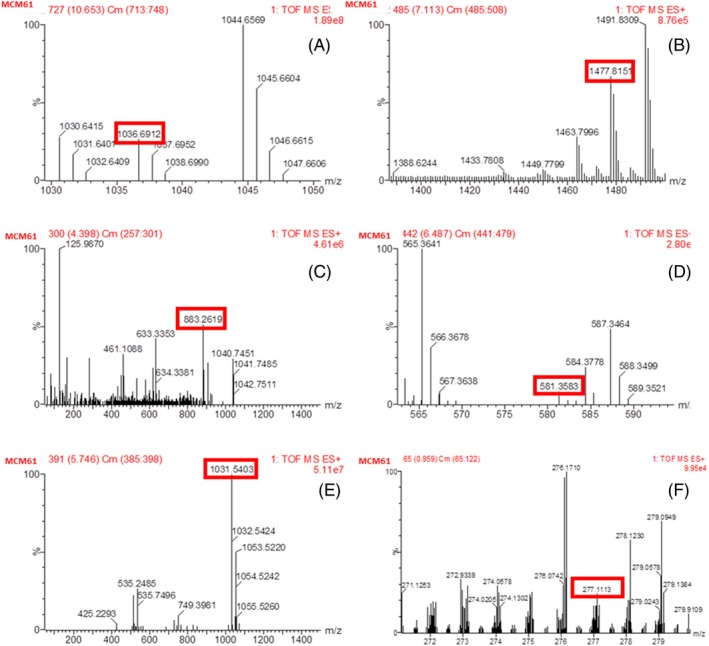 Figure 6
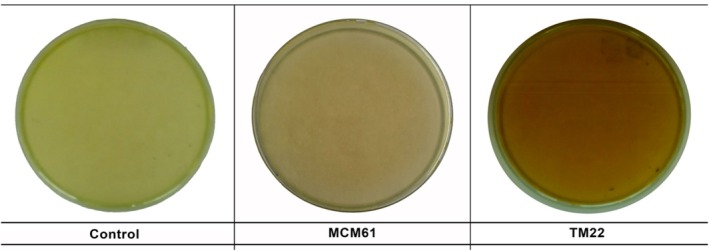 Figure 7
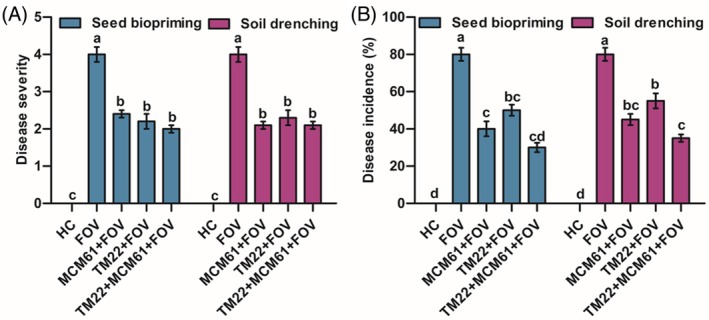 Figure 8
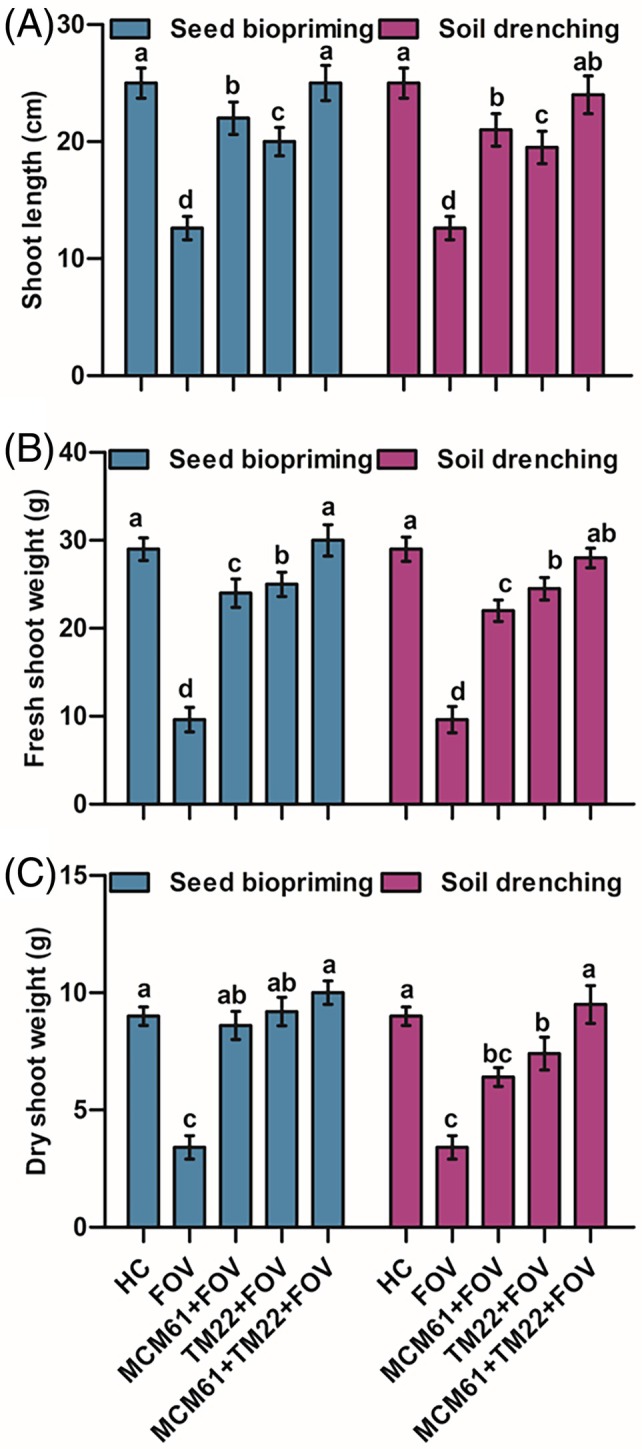 Figure 9
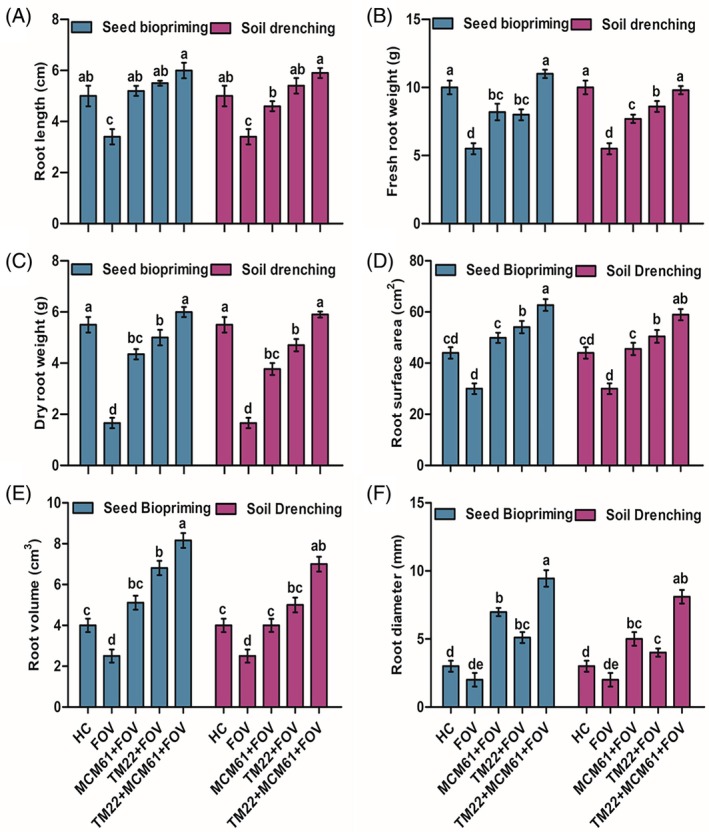 Figure 10
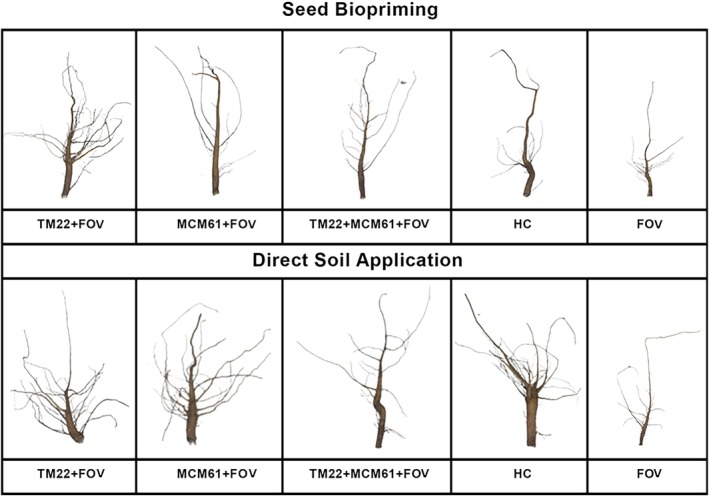 Figure 11
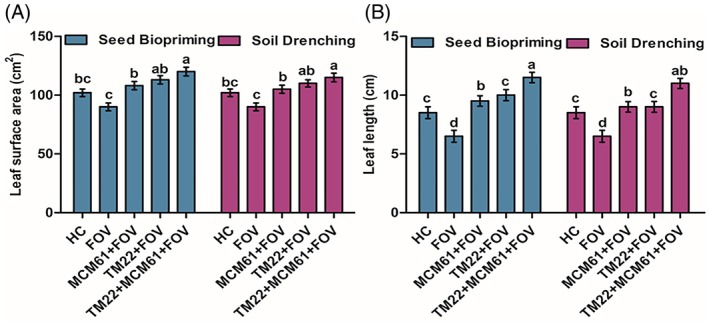 Figure 12
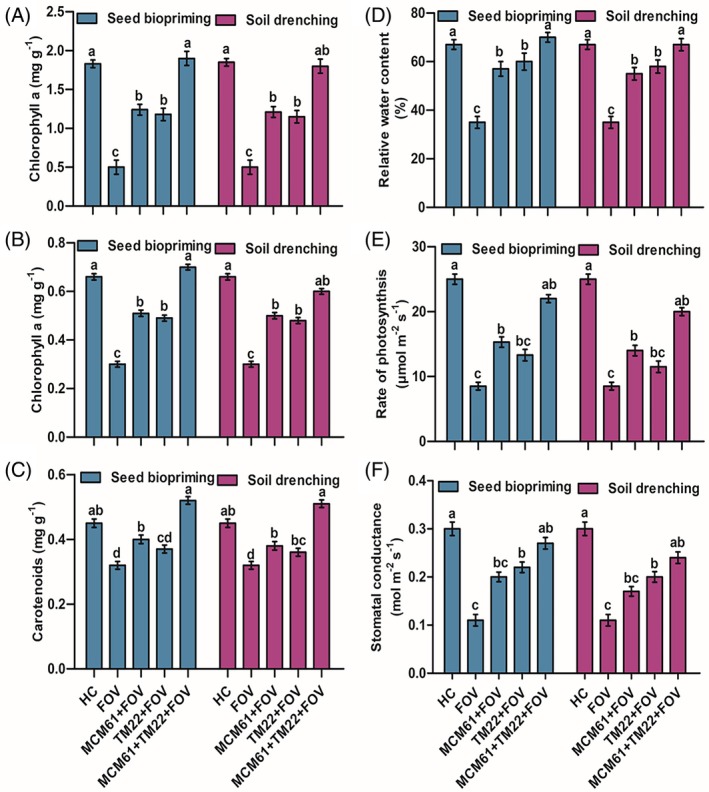 Figure 13
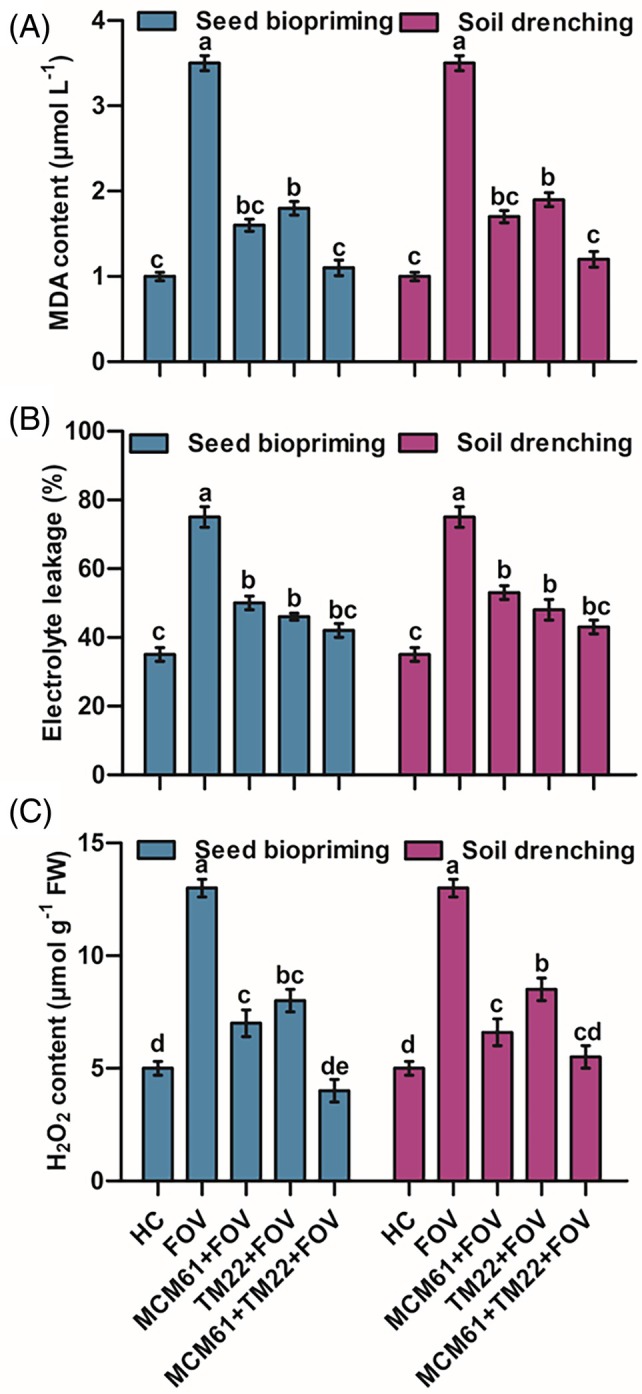 Figure 14
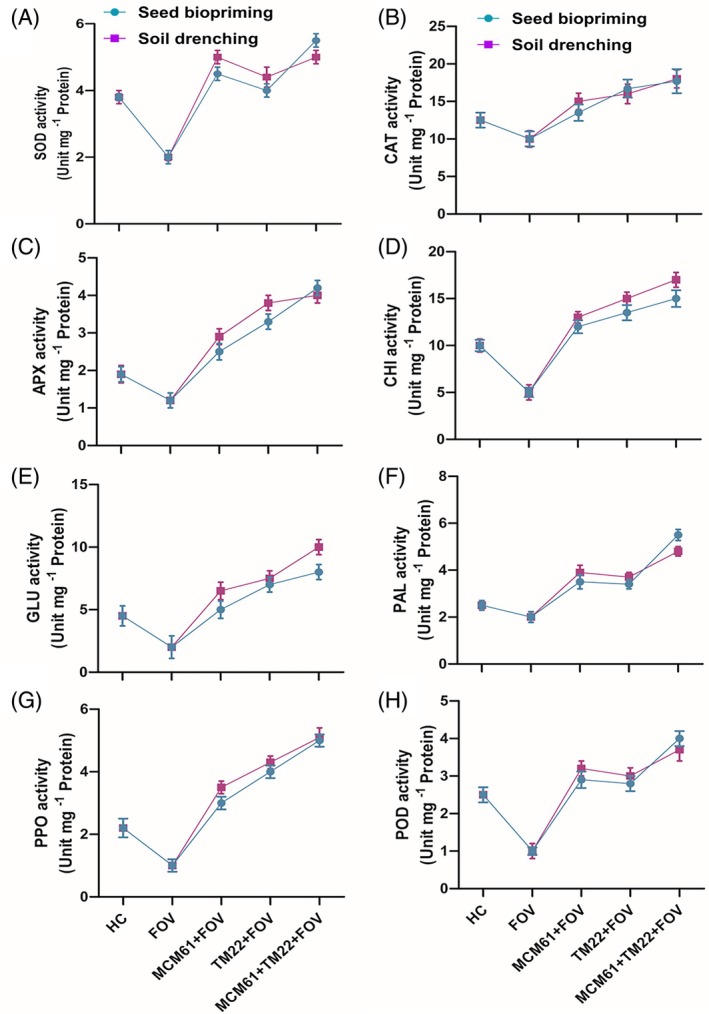 Figure 15
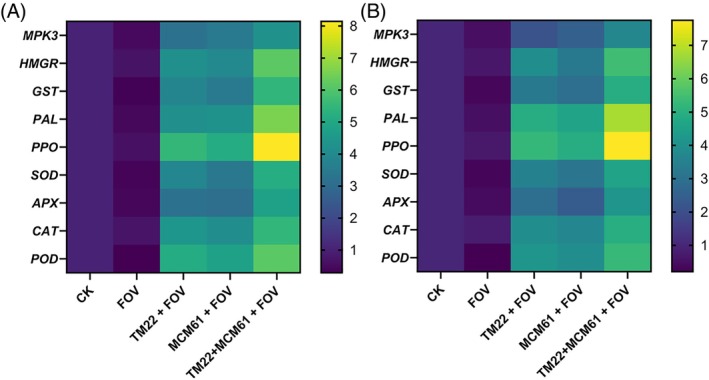 Figure 16
| Sr. No. | Treatment | Application | |
|---|---|---|---|
| Soil drenching | Seed biopriming | ||
| 1 | TM22 + FOV | Plants soil drenched with 50 mL of | Seeds soaked in 250 mL of 24‐h‐old |
| 2 | MCM61 + FOV | Plants soil drenched with 50 mL of | Seeds soaked in 250 mL of 24‐h‐old |
| 3 | TM22 + MCM61 + FOV | Plants soil drenched with co‐application of 25 mL | Seeds soaked in 125 mL of 24‐h‐old |
| 4 | FOV | Plants treated with LB broth only and inoculated with conidial suspension of FOV only | Seeds soaked in 250 mL LB broth only for 24 h |
| 5 | HC | Healthy control plants treated with LB broth only and not inoculated with | Seeds soaked in sterilized distilled H2O only for 24 h and not inoculated with |
| No. | Gene | Code | Primers (5′ to 3′) | Annealing temperature (°C) | Function |
|---|---|---|---|---|---|
| 01 | Mitogen‐activated protein kinase 3 |
| AAATACCCTAAGCCATCCACC | 61 | Signal transduction and gene activation |
| CCAACCCAATTCCCATTTGTG | |||||
|
| |||||
| 02 | 3‐hydroxy‐3‐methylglutaryl‐coenzyme A reductase |
| GTTACAACCGAGGAAGACGAG | 58 | Activation of SAR, pathogen signaling |
| CAATGGCAAACCCGATAACG | |||||
|
| |||||
| 03 | Phenylalanine ammonia‐lyase |
| ATGTTTGCTCAGTTTTCGGAAC | 59 | Antimicrobial compound, involved in lignin synthesis |
|
| GGCACTTTGAACATGGTTGG | ||||
| 04 | Glutathione‐S‐transferase |
| TCAGTGCTTTCCTACCCTTTG | 60 | ROS detoxification, Protection against oxidative damage |
|
| ATACCCAACAGAGCTAGCAAC | ||||
| 05 | Superoxide dismutase |
| CTGCCTCTGTCTCGATCATTG | 58 | Activation of antioxidant defense |
|
| ACCTTTCTGAATAGCCTCATGG | ||||
| 06 | Polyphenol oxidase |
| GAGTCAAGGTTCGTGATAGCC | 59 | Antifungal compound, involved in cell death |
|
| GGTGATGTTCTTTGTTTCGGC | ||||
| 07 | Ascorbate peroxidase |
| TTCCAAAGGGCTAACACACATC | 60 | ROS scavenging, H2O2 detoxification |
|
| CGAAGCATGATAGGAGCGCA | ||||
| 08 | Catalase |
| TGGACCCAGAGGTCCGATT | 60 | Control the level of ROS, H2O2 detoxification |
|
| TCCAGGTGCTCGCAGAAAAT | ||||
| 09 | Peroxidase |
| CAGTGTCGGCAGAACTCACT | 58 | Strengthens cell wall, ROS modulation, and involved in plant defense |
|
| GGTGTCCCACGATCGTTTCT | ||||
| 10 | Actin |
| TTAGCCCCAAGCAGCATGAA | 60 | Involved in cell shape, movement and cell division |
|
| TGAGAACGCCTCTGTTTGTAAG | ||||
| 11 | Beta‐tubulin |
| TGTGCCATGTATTGTGGCAA | 59 | Involved in intracellular transport and cell structure |
| GTGTCTATTGCCTGGGGCAT | |||||
|
|
| Sr. No. | Species | Species code | Accession no. | |
|---|---|---|---|---|
|
|
| |||
| 1 |
| MCM61 | ||
| 2 |
| RB58 | ||
| 3 |
| MGRP21 | ||
| 4 |
| CFGP92 | ||
| 5 |
| S2 | ||
| 6 |
| TM22 | ||
| Strain | Peak | Mass M/S [M + H]+ | Lipopeptide family | Retention time (min) | Reference |
|---|---|---|---|---|---|
| TM22 | 1 | 1008.65 | Surfactin | 10.92 |
|
| 2 | 1477.81 | Fengycin A | 7.41 |
| |
| 3 | 883.26 | Bacillibactin | 5.35 |
| |
| 4 | 271.12 | Bacilysin | 4.07 |
| |
| 5 | 1031.54 | Bacillomycin D | 5.58 |
| |
| 6 | 581.36 | Bacillaene | 6.09 |
| |
| 7 | 1086.58 | Iturin | 12.19 |
| |
| MCM61 | 1 | 1036.69 | Surfactin | 11.39 |
|
| 2 | 1477.81 | Fengycin A | 7.52 |
| |
| 3 | 883.26 | Bacillibactin | 5.61 |
| |
| 4 | 581.36 | Bacillaene | 6.08r |
| |
| 5 | 1031.54 | Bacillomycin D | 5.75 |
| |
| 6 | 271.12 | Bacilysin | 4.07 |
|
- —Taif University, Saudi Arabia10.13039/501100006261
Peer Reviews
No public reviews on file for this paper yet. If you reviewed it on a platform where reviews are public (OpenReview, ICLR, NeurIPS, ICML), you can paste yours below so the community can read it here.
Videos
No videos yet. Explain this paper in a talk, walkthrough, or lecture? Add one.
Taxonomy
TopicsPlant-Microbe Interactions and Immunity · Entomopathogenic Microorganisms in Pest Control · Insect Resistance and Genetics
INTRODUCTION
1
Fusarium oxysporum f. sp. vasinfectum (FOV), associated with wilt disease in cotton (Gossypium hirsutum L.), is one of the most dangerous and devastating soil borne pathogens affecting yield and fiber quality.1 Several disease control strategies have been employed to mitigate the attack of Fusarium wilt of cotton, such as cultural practices, biological control, botanical extracts, resistant varieties and chemical pesticides.2 However, using chemical pesticides is highly undesirable because it is detrimental to human health and environmental safety. The use of chemical pesticides to fight against Fusarium wilt disease in cotton causes water and soil pollution, while disturbing beneficial microbes and environmental safety.3
Biological control of plant pathogens represents a promising alternative to chemical pesticides because they offer a sustainable, eco‐friendly management solution. Plant growth‐promoting rhizobacteria (PGPR) are one of the most promising biological control agents that protect the plants from pathogen attack and promote plant growth.4, 5 Bacillus species hold the most prominent position among all PGPR. Bacillus strains are regarded as ‘Generally Recognized As Safe’ (GRAS), according to the U.S. Food and Drug Administration, because they have no potential risks to the environment and ecosystem.6 They can form resilient endospores, which provide more consistent biocontrol activity under harsh environmental conditions compared to other PGPR, such as Pseudomonas species.7 Bacillus survives in various environmental conditions and soil types for extended periods by forming endospores, which tolerate harsh environments.8 The formation of endospores also improves the cell viability of Bacillus in commercial formulations. Several suppression mechanisms are utilized by Bacillus species, including the production of antimicrobial compounds such as lipopeptides (LPs) and polyketides (PKs), hydrolytic enzymes and volatile organic compounds, elicitation of induced systemic resistance (ISR), and competition for space and nutrients.9, 10 Bacillus‐derived LPs and PKs provide long‐lasting control without endangering human health or the environment, and they have promising antimicrobial efficacy.11 Iturin, surfactin, fengycin, bacilysin, bacillibactin, and several nonpeptides such as PKs, phospholipids and amino‐sugars, are among the most significant antimicrobial compounds that are produced by Bacillus species.12 The three prominent families of LPs–surfactin, iturin and fengycin–have exceptional antifungal properties; they improve the antifungal and antimicrobial activity of Bacillus species, facilitate the colonization of biological niches, decrease surface tension, inhibit spore germination, create ion channels in the fungal membranes, increase the permeability of the hyphal cells and plasma membrane, and promote the formation of biofilm.10
The search for novel Bacillus species with strong potential to suppress plant pathogens requires the detection of antimicrobial compounds produced by these Bacillus species.13 The techniques used for the detection of antimicrobial compounds produced by Bacillus species include: liquid chromatography time‐of‐flight mass spectrometry (LC‐TOF/MS), matrix‐assisted laser desorption/ionization time‐of‐flight mass spectrometry (MALDI‐TOF MS), gas chromatography–mass spectrometry (GC–MS) and high‐performance liquid chromatography (HPLC). Several researchers have used LC‐TOF/MS as one of the most reliable methods to detect antimicrobial compounds produced by Bacillus species because it is a highly sensitive and rapid detection method.13, 14
Plants activate their defense‐related enzymes such as superoxide dismutase (SOD), ascorbate peroxidase (APX), peroxidase (POD), catalase (CAT), polyphenol oxidase (PPO), phenylalanine ammonia‐lyase (PAL), β‐1,3‐glucanase (GLU) and chitinase (CHI) when exposed to LPs produced by Bacillus species. These defense‐related enzymes play vital roles in suppressing plant pathogens by activating a series of plant defense mechanisms.15 They support systemic acquired resistance (SAR) as an essential defense mechanism against plant pathogens.16 The LPs play an essential role in activating plant defense mechanisms, such as defense‐related gene expression, ISR and the production of antimicrobial compounds.17
In this study, we hypothesized that Bacillus species applied via seed priming and soil drenching can suppress Fusarium wilt of cotton by modulation of plant defense. Therefore, the present research aimed to assess the antagonistic potential of Bacillus species, particularly B. altitudinis TM22 and B. atrophaeus MCM61, against Fusarium wilt of cotton through a series of in vitro and glasshouse experiments. The study intended to detect the LPs and PKs produced by antagonistic Bacillus species through LC‐TOF/MS analysis. The study also intended to understand the mechanisms by which treatment with Bacillus affects defense‐related enzyme activities, defense‐related gene expression, physiological processes and stress markers in cotton plants.
MATERIAL AND METHODS
2
Fungal culture
2.1
Fungal culture was isolated from infected cotton plants, which showed typical symptoms of Fusarium wilt with visible vascular browning in the cross‐section of the stem. The cotton plant samples were collected from the Faqir Wali (62050), Haroon Abad, Bahawalnagar, Province Punjab, Pakistan (29.6081° N, 73.1468° E). The samples were excised into 5‐mm segments and surface‐disinfested with 2% sodium hypochlorite (NaOCl) and plated on potato dextrose agar (PDA) in 9‐cm Petri dishes and incubated at 25 ± 2 °C. The plates were observed every 12 h, and the fungal growth was transferred to fresh PDA medium (Oxoid Ltd, Hampshire, UK) immediately after it appeared. The identity of the fungal pathogen was verified based on morphological and molecular characterization. For morphological identification, the pathogen was observed at ×100 on an Olympus compound microscope (Olympus, Tokyo, Japan). The genomic DNA was extracted from the pathogen using PrepMan Ultra Reagent (Thermo Fisher Scientific, Waltham, MA, USA) at 100 °C for 15 min in a thermocycler (BioRad/ Thermo Fisher Scientific). The Internal Transcribed Spacer region (ITS) and Translation Elongation Factor (TEF) genes were amplified in a Thermocycler (Bio‐Rad, Hercules, CA, USA). The PCR reaction was carried out at the following conditions: initial denaturation for 5 min at 94 °C, 35 cycles of denaturation at 94 °C for 30 s, annealing for 30 s at 52 °C for ITS, 54 °C for TEF, followed by elongation for 30 s at 72 °C, with the final elongation performed at 72 °C for 8 min. The PCR product was purified and sent for sequencing to Macrogen (Seoul, Korea). The obtained nucleotide sequences of the pathogen were submitted to GenBank, NCBI and Isolation and identification of fungal culture. Phylogenetic analysis was performed to confirm the identity of the pathogen using mega (v11) software, and a maximum‐likelihood (ML) phylogenetic tree was made using the bootstrap method and Tamura–Nei model. The pathogenicity test was performed on healthy mature cotton plants to confirm Koch's postulates. Purified fungal culture was kept in an incubator (MIR‐154; Panasonic Healthcare Co. Ltd, Tokyo, Japan) at 26 ± 2 °C for further use in the subsequent experiments.
Bacterial cultures
2.2
The bacterial species were procured from the Molecular Plant Pathology Laboratory at the Islamia University of Bahawalpur, Punjab, Pakistan. Phylogenetic analysis was performed to confirm the identity of Bacillus species using mega (v11) software, and a neighbor‐joining phylogenetic tree was made using the bootstrap method and Tamura–Nei model. The bacterial species were preserved in a 30% glycerol stock solution at –80 °C. Before the experiments, the bacterial cultures were revived on Luria Bertani (LB) medium, and a 24‐h‐old culture was used for each experiment.
Dual culture assay
2.3
The antagonistic activity of six Bacillus species against the fungal pathogen was assessed in a dual culture plate assay in vitro. Bacillus species were grown in LB broth at 28 ± 1 °C for 24 h. FOV was cultured on PDA medium for 7 days at 25 ± 2 °C. A 5‐mm block of 7‐day‐old pathogen culture was placed at the center of a 90‐mm petri dish containing full‐strength PDA medium. Then, 5‐mm sterilized filter paper discs were placed at a 3 cm distance from the center on three sides of the Petri plate (one filter paper disc for control and two for treatments). Later, 5 μL of the respective Bacillus suspension was dropped on the sterilized filter paper discs using a micropipette, and the plates were incubated at 25 ± 2 °C for 5 days. At the control side, the filter paper discs were impregnated with 5 μL LB broth only. The zone of inhibition between the fungal colony (where the growth of the fungus was restricted) and the bacterial colony was measured 5 days postincubation (dpi). The inhibition zones were measured using a measuring scale in cm. Each Bacillus treatment had five replicates, and the in vitro assay was repeated thrice.18
Antifungal assay with lipopeptides
2.4
The two best‐performing Bacillus species from the antifungal assay (see Section 2.3) were selected to extract LPs. The strains were selected based on their strong antifungal activity and their consistent and reproducible results across multiple replicates and repeated experiments. The extraction of LPs from Bacillus species was carried out using the method described by Fatima et al 14 A 5‐mm culture block from a 7‐day‐old pathogen culture was inoculated at one side of full‐strength PDA medium, poured into a sterilized Petri dish (90 mm) and incubated at 25 ± 2 °C for 24 h. Then, 5 μL of 400 μg mL^−1^ LPs extract prepared in 0.01 m phosphate buffer solution (PBS) was poured on a sterilized filter paper disc placed on the other side of the plate. The concentration 400 μg mL^−1^ was selected based on our previous study.19 To assess the combined effect of TM22 and MCM61 the pathogen culture block was inoculated at the center of the plate and 5 μL of 400 μg mL^−1^ LPs extract was poured on sterilized filter paper discs placed on both sides of the plate. In the control group, only 5 μL PBS solution was poured on a filter paper disc. Inhibition was calculated in percentage 5 dpi. Inhibition was calculated using the following formula; Inhibition (%) = C – T/C × 100, where C is the growth of pathogen in control plate and T is the growth of pathogen in the treatment plate. Each treatment had five replicates, and the assay was performed twice under the same experimental settings.
Liquid chromatography time of flight mass spectrometry LC‐TOF/MS analysis
2.5
The LC‐TOF/MS analysis was carried out on a surveyor LC‐TOF/MS system (G2 QT of‐XS; Waters, Milford, MA, USA) using the protocol described by Hajji et al.20 to detect the LPs. A UPLC C18 2.1 × 100 mm column with ACQUITY UPLC BEH 1.7 μm particles was employed to perform the separations. The mobile phase to perform this analysis consisted of solution (A) formic acid (HCOOH) (0.1%) in water (H_2_O) and solution (B) HCOOH (0.1%) in acetonitrile (C₂H₃N). The methanolic samples were eluted in 5% solution A (formic acid 0.1% in H_2_O) for 2 min, followed by 15 min in 95% solution B (formic acid 0.1% in acetonitrile), and then 2 min in 95% solution B. The injection volume to conduct the analysis was 5 μL, and the flow rate was maintained at 200 μL min^−1^. The MS analysis was performed in the 50–1200 m/z range, with an electrospray source operating in positive ion mode and MSE acquisition mode. Following previously established parameters, LC‐TOF/MS modalities were applied to the chosen ions. The collision energy of 40 eV, 2.5 kV source voltage, 12 °C source temperature and 400 °C dissolution gas temperature was used for the LC‐TOF/MS analysis. masslynx (v 4.1) software was utilized to collect and process the obtained data from LC‐TOF/MS analysis.17
Hydrogen cyanide (HCN) production assay
2.6
The synthesis of HCN by B. altitudinis TM22 and B. atrophaeus MCM61 was tested in a qualitative assay.21 The specific King's B agar medium for testing HCN production was prepared by adding 20 g proteose peptone, 1.5 g magnesium sulfate heptahydrate, 1.5 g dipotassium hydrogen phosphate agar 20 g, and 1000 mL sterilized distilled water (SDW). The pH of the medium was maintained at 7.0. Briefly, 1 mL of 24‐h‐old culture of B. altitudinis TM22 and B. atrophaeus MCM61 was spread on King's B agar medium. Later, Whatman No. 1 filter paper (9 mm diameter) was soaked in 0.5% picric acid and 2% Na_2_CO_3_ solutions and placed in the plate's lid to detect the presence of HCN. The plates were tightly sealed with parafilm to trap the gas inside and prevent release. Later, these plates were incubated at 30 °C for 4 days. After 24–48 h, the color of the Whatman No. 1 filter paper changed from yellow to dark reddish‐brown, which was considered indicative of HCN production.22
In planta experiment
2.7
Cotton seeds cv. ‘SS32’ were surface‐disinfested with NaOCl solution (5%) for 1 min. The seeds were then rinsed thoroughly with SDW three to four times. The plants were given two different treatment applications: soil drenching and seed biopriming. For seed biopriming, 70 g cotton seeds were added to a container containing 250 mL of 24‐h‐old liquid Bacillus culture prepared in LB broth [1 × 10^8^ colony‐forming units (CFU) mL^−1^] [optical density at 600 nm (OD_600_) = 2.5] and suspended for 24 h. Later, the seeds were air‐dried and used for planting. The seeds were soaked in LB broth for 24 h for control treatment. The seeds were sown in clay loam soil filled in sterilized clean plastic pots with 14 cm height and a base diameter of 10 cm. The pots containing sterilized soil were inoculated with 50 mL of Bacillus culture prepared in LB broth (1 × 10^8^ CFU mL^−1^) (OD_600_ = 2.5) for soil drenching treatment. The healthy control plants were treated with 50 mL LB broth only and uninoculated with Bacillus or FOV suspensions. After 1 week, the treated seeds were sown in these pots (5 seeds per pot). The cotton plants were inoculated at four leaf stages with 1 × 10^5^ spore mL^−1^ conidial suspension of FOV. In a glasshouse, the pots were kept under controlled conditions at 25 °C temperature under a 16 h:8 h, light:dark photoperiod. Each treatment was repeated 10 times, and the experiment was performed thrice under the same experimental conditions. The treatments used in the experiment and how they were made is explained in Table 1. Disease assessments were made at 60 days post‐sowing (dps). Disease severity was measured using a 0–5 vascular browning scale.23 The vascular browning was observed by cutting the cross‐section of the stem vertically. On a 0–5 disease severity scale, 0 = no browning in the vascular system, 1 = 1–20% browning in the vascular system, 2 = 21–40% browning in the vascular system, 3 = 54–60% browning in the vascular system, 4 = 61–80% browning in the vascular system and 5 = 81–100% browning in the vascular system. Disease incidence for each treatment was calculated using the formula of Sukorini et al 24
Assessment of vegetative traits
2.8
The leaf surface area, volume and length were measured at 60 dps on a Leaf Scanner (Perfection V800 Photo; EPSON, Amsterdam, Netherlands) with leaf scanning software (winfolia, model J221B). The root area, volume and length were measured on a root scanner (EPSON STD4800) using RhizoScanning software (winrhizo, model J221B).
Assessment of photosynthetic pigments
2.9
In order to assess photosynthetic pigments including chlorophyll a (Chl a), chlorophyll b (Chl b) and carotenoids, the extract of freshly harvested leaves was prepared in 80% acetone. The absorption was recorded at 663, 645 and 470 nm for Chl a, Chl b and carotenoid contents using a spectrophotometer (Shimadzu, Kyoto, Japan).25
Assessment of relative water content, rate of photosynthesis and stomatal conductance
2.10
In order to determine the relative water content (RWC) the third cotton leaf from the top was removed, and equal‐sized pieces of leaves were excised and their fresh weight (FW) was recorded on a digital weight measuring scale; the leaf pieces were soaked in SDW for 24 h so that the leaves may uptake H_2_O and become turgid then the turgid weight (TW) was recorded. Later, the leaf pieces were kept in an incubator for drying at 80 °C for 1 h and the dry weight (DW) was recorded. RWC was calculated by using the following formula: RWC (%) = (FW – DW)/(TW – DW) × 100.26 The rate of photosynthesis (Pn) in cotton plants, and stomatal conductance (gs) were measured on an infrared gas analyzer (IRGA) system (LI‐6400; Li‐Cor Inc., Lincoln, NB, USA) before harvest.27
Assessment of oxidative stress markers
2.11
The oxidative stress markers, including electrolyte leakage (EL), hydrogen peroxide (H_2_O_2_) and malondialdehyde (MDA) levels were measured in cotton plants. MDA level was assessed using the protocol of Cakmak & Horst28 with slight modification. The leaves were macerated in a clean pestle and mortar in 5 mL of 0.1% (w/v) trichloracetic acid (TCA). The resulting extract was centrifuged at 14 000 × g for 16 min at 4 °C. Then, 0.5 mL supernatant was collected, and 1.5 mL of 0.5% 2‐thiobarbituric acid (TBA; prepared in 20% TCA) was added in the supernatant and vortexed briefly, followed by incubation at 90 °C for 20 min. The reaction was terminated in an ice bath, and the sample was centrifuged at 14000 × g for 5 min at 25 °C. The absorbance of the reaction was measured at 600 nm wavelength on a spectrophotometer (Shimadzu, Japan).29 For the assessment of EL, four leaves per plant were taken from six randomly chosen cotton plants and excised into 1‐cm pieces. These pieces were rinsed four times with SDW to wash off the particles adhering to the surface and placed in separate vials containing 10 mL SDW. Then, these samples were incubated at room temperature (25 °C) on a shaking incubator (120 rpm) for 24 h.30 The reading for electrical conductivity of the bathing solution (EC1) was recorded postincubation, and the EC2 value was measured after autoclaving at 121 °C for 20 min; then, the solution was allowed to cool down for 30 min.31 The EL was calculated using the following formula; Electrolyte leakage (%) = EC1/EC2 × 100. To assess the H_2_O_2_ content, cotton leaf tissues of 0.2 g were macerated in liquid nitrogen in a clean pestle and mortar. Then, the macerated sample was homogenized in 2 mL reaction mixture containing 5 mm potassium phosphate buffer (pH 6.8) and 1 mm hydroxylamine. The reaction mixture was dissolved and centrifuged at 10 000 × g for 16 min at 4 °C. After centrifugation, the supernatant was collected, and 100 μL supernatant was added to 100 μm ferric ammonium sulfate, 25 mm of H_2_SO_4_, 250 μm of xylenol orange and 100 mm sorbitol, and the final volume was maintained at 2 mL. The mixture was incubated in completely dark conditions at 25 °C for 25–30 min. The absorbance of the mixture was measured in a spectrophotometer (Shimadzu) at 560 nm.32
Assessment of defense enzymes activities
2.12
The mature leaves of cotton plants from all treatments were taken to assess the activities of defense enzymes in 45‐day‐old cotton plants. To prepare the extract, the leaves were rinsed thoroughly, and 2 g cotton leaves were crushed in 0.1 m sodium phosphate buffer (10 mL) (pH 7.8) and centrifuged at 16 000 × g for 20 min at 2 °C. Later, the supernatant was collected and the pellet was thrown away. The enzyme activity was determined in the supernatant. The amount of total protein was determined by following the complete steps in Bradford's protocol.33 The activities of CAT, GLU, APX, SOD, CHI, POD and PPO were assessed following the protocol of Cao et al 34 The activity of PAL was measured using the protocol given by Ballester et al 35 The absorbance of every tested enzyme was measured at a specific wavelength for each enzyme on a spectrophotometer (Shimadzu, Japan). The activity of all enzymes was expressed in U mg^−1^ protein. The enzyme activity was assessed in five replicates of each treatment.
Gene expression analysis
2.13
The expression of defense‐related genes in cotton plants was measured in a quantitative real‐time polymerase chain reaction (qRT‐PCR) in a QuantStudio Real‐Time PCR machine (Thermo Fisher Scientific). RNA was extracted from cotton leaves using an RNA extraction kit (Omega Bio‐Tek, Norcross, GA, USA). To determine the extracted RNA's concentration and purity, a NanoDrop 1000 (Thermo Fisher Scientific), USA was used. An Evo M‐MLV reverse transcriptase (Accurate Biology, Hunan, China) kit was employed to prepare first‐strand cDNA. The expression of defense‐related genes–HMGR, MPK3, GST, PAL, PPO, APX, POD, CAT and SOD–were analyzed by qRT‐PCR with the SYBR Green Premix Taq HS qPCR kit (Accurate Biology). The primer information of the defense‐related genes and annealing temperatures are given in Table 2. Actin and beta‐tubulin were used as internal control genes to normalize the gene expression levels. Five replicates were tested from each treatment to determine the final expression levels of the target genes using the 2^−ΔΔCt^ method.36
Statistics analysis
2.14
Analysis of all the data obtained in this study was conducted using the Spss statistical package (v29). All of the experiments were performed in a completely randomized design (CRD) under controlled conditions. The comparisons in treatment means were made using post hoc Tukey's honestly significant difference (HSD) at a significance level of P ≤ 0.05 after appropriate ANOVA.
RESULTS
3
Identification of fungal pathogen
3.1
The pathogen developed dense, white, cottony colonies on PDA [Fig. 1(A)]. Under the microscope, both macroconidia and microconidia were observed at 100× [Fig. 1(B)]. Macroconidia were slightly curved or straight with three to five septations with foot‐shaped basal cell measuring 19.1 to 38.5 × 3.5 to 5.3 μm (n = 40). Microconidia were also observed. They were oval‐shaped without any septa and appeared on short monophialides measuring 5.8–11.2 to 2.7–4.9 μm (n = 40) [Fig. 1(B)]. The sequence obtained after molecular sequencing of ITS and TEF genes was submitted to GenBank, NCBI with ITS accession no. OR523451.1 and TEF accession no. PV324757.1 as F. oxysporum TM23. Phylogenetic analysis of TM23 showed 100% identity with F. oxysporum type strain NRRL25387 based on a ML tree (Supporting Information, Fig. S1).
Colony morphology and microscopic features of F. oxysporum f. sp. vasinfectum: (A) pure culture plate of FOV on PDA; (B) microscopic view of conidia at ×100 magnification.
Identification of bacterial cultures
3.2
Six different Bacillus strains were identified in this study based on molecular identification and phylogenetic analysis (Table 3). Based on phylogenetic analysis there were six different clades and B. mojavensis was used as an outgroup. The strain CFGP92 grouped together with B. amyloliquefaciens accession nos OP888971, FN652780 and KY777246. Strain RB58 appeared in a separate clade with B. velezensis OQ920283 and OQ626815. MCM61 grouped together with B. atrophaeus accession no. AF272016, MW879354 and MT254069. The strains S2 and MGRP21 were placed in a single clade with B. subtilis accession nos JX977127 and MW401274. In the fifth clade grouped together with two isolates of B. altitudinis accession nos OQ408169 and MK608736 (Fig. S2).
In vitro antagonism assay
3.3
In an in vitro antagonism assay, all tested Bacillus species exhibited considerable inhibition of the colony growth of FOV. B. altitudinis TM22 caused the highest inhibition compared to other treatments (Fig. 2). TM22 produced an inhibition zone of 2.2 cm. B. atrophaeus MCM61 was the second most inhibitory strain, producing an inhibition zone of 1.9 cm. B. amyloliquefaciens CFGP92 produced the lowest inhibition with an inhibition zone of 1.2 cm (Fig. 2).
In vitro antagonism of F. oxysporum f. sp. vasinfectum by Bacillus species in a dual culture assay. The comparisons among the treatments were made by applying post hoc Tukey's HSD test, with small letters placed over the column indicating different treatment groups based on significant differences at P ≤ 0.05.
Antagonism assay with lipopeptides
3.4
LPs were extracted from B. altitudinis TM22, and B. atrophaeus MCM61 produced considerable inhibition of the colony growth of FOV. The clear zones around the fungal colonies indicated the inhibition of the pathogen by the respective Bacillus species applied as single treatments [Fig. 3(A)]. In the case of combined treatment where both TM22 and MCM61 were applied together considerably highest inhibition was produced compared to single treatments [Fig. 3(B)] and the control plate had no inhibition zones [Fig. 3(C)]. TM22 produced the higher inhibition of the colony growth of FOV with an inhibition zone of 2.4 cm compared to MCM61 where the inhibition zone was 1.5 cm [Fig. 3(D)].
Antifungal efficacy of lipopeptides against colony growth of the pathogen: (A) Treatment with B. altitudinis TM22 at left side of the plate and treatment with MCM61 at right side of the plate; (B) combined treatment with B. altitudinis TM22 and B. atrophaeus MCM61; (C) control treatment (uninoculated with Bacillus); and (D) measurement of inhibition zones produced by Bacillus species. The comparisons among the treatments were made by applying post hoc Tukey's HSD test, with small letters placed over the column indicating different treatment groups based on significant differences at P ≤ 0.05.
Liquid chromatography time of flight mass spectrometry LC‐TOF/MS analysis
3.5
LC‐TOF/MS analysis detected the presence of six LPs–surfactin, fengycin, iturin, bacilysin, bacillibactin and bacillomysin– and one PK bacillaene in B. altitudinis TM22 at different retention times (RT). The LPs were separated based on m/z values by comparing these values with reported peaks in previous literature and their corresponding retention times are reported in Table 4. Surfactin, fengycin A, iturin, bacilysin, bacillibactin, bacillaene and bacillomysin were detected at different peaks of m/z 1008.65 (10.92 min RT), 1447.81 (7.41 min RT), 1086.58 (12.19 min RT), 271.12 (4.07 min RT), 883.26 (5.35 min RT), 581.35 (6.09 min RT) and 1031.54 (5.58 min RT), respectively (Figs 4 and 5) (Table 4). The LC‐TOF/MS analysis of B. atrophaeus MCM61 revealed the presence of five LPs (surfactin, fengycin, bacilysin, bacillibactin, bacillomysin) and one PK bacillaene. By comparing the peaks with previous literature, the detected LPs and PK were identified based on m/z values and RT. Surfactin, fengycin, bacilysin, bacillibactin, bacillaene and bacillomysin were detected at peaks of m/z 1036.69 (11.39 min RT), 1477.81 (7.52 min RT), 271.121 (4.07 min RT), 883.26 (5.61 min RT), 581.35 (6.08 min RT) and 1031.54 (5.75 min RT), respectively (Figs 4 and 6) (Table 4).
Liquid chromatography time of flight mass spectrometry analysis based on retention time for B. altitudinis TM22 and B. atrophaeus MCM61.
Liquid chromatography time of flight mass spectrometry analysis of B. altitudinis TM22: peaks for (A) surfactin, (B) fengycin, (C) bacillibactin, (D) bacillomysin, (E) bacilysin; (F) bacillaene and (G) iturin.
Liquid chromatography time of flight mass spectrometry analysis of B. atrophaeus MCM61: peaks for (A) surfactin, (B) fengycin, (C) bacillibactin, (D) bacillaene, (E) bacillomysin and (F) bacilysin.
Hydrogen cyanide (HCN) production assay
3.6
The change in color from light yellow to light reddish‐brown and dark reddish‐brown confirms that HCN is produced by B. atrophaeus MCM61 (Fig. 7) and B. altitudinis TM22 (Fig. 7). B. altitudinis TM22 showed a darker color, indicating higher HCN production, which corresponds to the more substantial antagonism potential of TM22. In the control plate, the color of the medium was light yellow (Fig. 7).
Hydrogen cyanide‐producing ability of Bacillus species on King's B agar medium.
Greenhouse experiment
3.7
The co‐application of B. altitudinis TM22 and B. atrophaeus MCM61 applied via seed biopriming showed the lowest disease severity 2.0 [Fig. 8(A)] and disease incidence of 30% [Fig. 8(B)] of Fusarium wilt of cotton as compared to the infected control, whereas in the case of soil drenching, combined treatment showed the lowest disease severity 2.1 [Fig. 8(A)] and disease incidence 35% [Fig. 8(B)] indicating the combined or additive effect of Bacillus species in disease suppression. In infected control plants, the disease severity was 4.0, and the incidence was 80%. Healthy control plants were asymptomatic and disease free.
Disease assessment of Fusarium wilt of cotton in the glasshouse experiment: (A) disease severity and (B) disease incidence. The treatments were compared by applying post hoc Tukey's HSD test, with small letters placed over the column indicating different treatment groups based on significant differences at P ≤ 0.05.
Vegetative traits
3.8
The vegetative traits of cotton plants, including shoot length, shoot FW and shoot DW, were the highest in plants treated with co‐application of TM22 and MCM61 applied via seed biopriming compared to healthy control treatment [Fig. 9(A)–(C)]. The shoot length, shoot FW and shoot DW were the lowest in infected control plants, indicating that the pathogen infection negatively impacted the growth of the plants [Fig. 9(A)–(C)]. Likewise, the root parameters root length, root FW, root DW, root surface area, root volume and root diameter also were considerably high in plants treated with co‐application of TM22 and MCM61 and inoculated with FOV where the Bacillus species were applied as seed biopriming compared to soil drenching [Fig. 10(A)–(F)]. The images of rhizoscanning analysis of cotton plant roots subject to treatment with Bacillus species applied as seed biopriming and soil drenching are displayed in Fig. 11. The leaf scanning analysis revealed that leaf surface area and length also were the highest in plants treated with TM22 + MCM61 + FOV applied via seed biopriming compared to other treatments [Fig. 12(A), (B)]. Overall, seed biopriming with Bacillus species performed better than soil drenching application to improve the vegetative traits of cotton plants.
Effect of Bacillus species on vegetative traits of plants applied via seed biopriming and soil drenching: (A) shoot length, (B) shoot FW and (C) shoot DW. The comparisons among the treatments were made by applying post hoc Tukey's HSD test, with small letters placed over the column indicating different treatment groups based on significant differences at P ≤ 0.05.
Effect of Bacillus species applied via seed biopriming and soil drenching on root growth parameters: (A) root length, (B) root FW, (C) root DW, (D) root surface area, (E) root volume and (F) root diameter. The comparisons among the treatments were made by applying post hoc Tukey's HSD test with small letters placed over the column indicating different treatment groups based on significant differences at P ≤ 0.05.
Rhizoscanning images of cotton plant roots subjected to treatment with Bacillus species applied via seed biopriming and soil drenching.
Effect of Bacillus species applied via seed biopriming and soil drenching on leaf‐growth parameters: (A) leaf surface area and (B) leaf length. The comparisons among the treatments were made by applying post hoc Tukey's HSD test with small letters placed over the column indicating different treatment groups based on significant differences at P ≤ 0.05.
Effect of Bacillus species on physiological parameters
3.9
The treatment TM22 + MCM61 + FOV via seed biopriming showed the highest Chl a [Fig. 13(A)], Chl b [Fig. 13(B)], carotenoid contents [Fig. 13(C)], RWC [Fig. 13(D)], rate of photosynthesis [Fig. 13(E)], and stomatal conductance [Fig. 13(F)] compared to infected control (FOV), and healthy control treatment. Individual applications of TM22 and MCM61 also enhanced the Chl a, b, carotenoid content, RWC, rate of photosynthesis, and stomatal conductance compared to control treatments [Fig. 13(A)–(F)]. The lowest amount of Chl a, b, and carotenoid content, RWC, rate of photosynthesis, and stomatal conductance were observed in infected control plants [Fig. 13(A)–(F)].
Effect of Bacillus species on physiological parameters of cotton plants: (A) chlorophyll a, (B) chlorophyll b, (C) carotenoids, (D) relative water content, (E) rate of photosynthesis and (F) stomatal conductance. The comparisons among the treatments were made by applying post hoc Tukey's HSD test, with small letters placed over the column indicating different treatment groups based on significant differences at P ≤ 0.05.
Determination of stress markers
3.10
The activities of oxidative stress markers MDA, EL and H_2_O_2_ were the highest in infected control plants, indicating a high‐stress level in response to pathogen attacks. The treatment MCM61 + TM22 + FOV showed the lowest activities of MDA, EL and H_2_O_2_ [Fig. 14(A)–(C)]. Likewise, single applications of TM22 and MCM61 also reduced MDA, EL and H_2_O_2_ levels compared to infected control treatment [Fig. 14(A)–(C)].
Effect of Bacillus species on oxidative stress markers: (A) MDA, (B) EL and (C) H2O2 contents. The comparisons among the treatments were made by applying post hoc Tukey's HSD test with small letters placed over the column indicating different treatment groups based on significant differences at P ≤ 0.05.
Assessment of defense‐related enzyme activities
3.11
Bacillus species applied individually or in combination significantly enhanced the activities of all tested defense‐related enzymes compared to healthy control (HC) and infected control (FOV). The combined treatment TM22 + MCM61 + FOV showed the highest increase in all enzymes including SOD [Fig. 15(A)], CAT [Fig. 15(B)], APX [Fig. 15(C)], CHI [Fig. 15(D)], GLU [Fig. 15(E)], PAL [Fig. 15(F)], PPO [Fig. 15(G)] and POD [Fig. 15(H)] in both types of treatment applications; seed biopriming and soil drenching. However, a slightly higher increase in CHI, GLU, CAT and PPO was observed in soil drenching compared to seed biopriming, where POD, SOD, PAL and APX activities were higher in cotton plants treated with TM22 + MCM61 + FOV. The lowest activities of all tested enzymes were observed in the infected control treatment. Individual applications of TM22 and MCM61 under pathogen stress also enhanced the activities of POD, CAT, SOD, APX, GLU, CHI, PAL and PPO applied via seed biopriming and soil drenching compared to infected control and healthy control treatments.
Effect of Bacillus species on the activities of defense enzymes of cotton plants: (A) SOD, (B) CAT, (C) APX, (D) CHI, (E) GLU, (F) PAL; (G) PPO and (H) POD. The comparisons among the treatments were made by applying post hoc Tukey's HSD test at P ≤ 0.05.
Gene expression analysis
3.12
The expression of defense‐related genes, including MPK3, HMGR, GST, PAL, PPO, SOD, APX, CAT and POD [Fig. 16(A), (B)], was the highest in cotton plants treated with co‐application of TM22 + MCM61 and inoculated with FOV compared to infected control and healthy control plants. The most highly upregulated genes were PPO (8.14‐fold), PAL (6.58‐fold), HMGR (6.14‐fold) and POD (6.13‐fold) in cotton plants treated with TM22 + MCM61 + FOV applied via seed biopriming, whereas in case of soil drenching the expression was PPO (7.75‐fold), PAL (6.78‐fold), HMGR (5.43‐fold) and POD (5.26‐fold). The expression of all defense‐related genes was slightly higher in plants subjected to seed biopriming compared to soil drenching. The lowest expression of all defense‐related genes was observed in infected control (FOV) treatment.
Gene expression analysis of defense‐related genes of cotton plants subjected to: (A) seed biopriming with Bacillus species and (B) soil drenching with Bacillus species.
DISCUSSION
4
The rhizospheric soil serves as a primary reservoir of PGPR while providing both an environmentally friendly and sustainable approach for the effective management of plant diseases.42 The successful implementation of biological control methods requires the selection of new and novel antagonistic microorganisms with strong disease suppression effects. In this study, we identified two Bacillus species from cotton plant rhizosphere soil, including B. altitudinis TM22 and B. atrophaeus MCM61, because they showed great potential for antagonism of FOV, causing Fusarium wilt in cotton and promoted plant growth. Bacillus species reduce the soil pH and improve soil nutrient levels. They provide additional benefits to the plants by improving nutrient absorption and plant nutrient uptake.43
Endophytic Bacillus species adopt multifaceted modes to control plant pathogens and enhance plant growth.44 Among these MoAs, the synthesis of antimicrobial compounds, including LPs, PKs, hydrolytic enzymes and volatile compounds, is the most promising mechanism. In this study, B. altitudinis TM22 and B. atrophaeus MCM61 and their extracted LPs and PKs showed the most promising inhibition of FOV among the other Bacillus species in an in vitro plate assay. The in vitro inhibitory activity of Bacillus species is attributed to the production of antimicrobial compounds.13 Bacillus are considered antimicrobial compound‐producing factories because they produce a plethora of secondary metabolites with high antimicrobial activity.45 In support of our work, several previous research reports have documented the in vitro inhibitory activity of Bacillus strains against several fungal pathogens including F. oxysporum,46 Verticillium dahliae,17 F. oxysporum f. sp. ciceris,14 F. solani f. sp. phaseoli,47 Penicillium italicum,48 Alternaria alternata,49 Magnaporthe oryzae,50 and P. digitatum.51 The in vitro antagonism assays provide a baseline for screening the best Bacillus strains that can be used for field applications. The main cause of pathogen inhibition during in vitro assays stems from two factors: the competition between antagonist and pathogen, and the production of antimicrobial compounds.52 The bacteria produce antimicrobial compounds which cause inhibition of fungal pathogens during in vitro assays, which is visible by the production of inhibition zones around the fungal colonies.53 LPs and PKs are the key antimicrobial compounds responsible for causing the direct suppression of fungal pathogens.54 In this study, we have identified six LPs, including fengycin, iturin, surfactin, bacilysin, bacillibactin and bacillomycin, and one PK bacillaene using LC‐TOF/MS from B. altitudinins TM22. At the same time, only iturin was not detected in B. atrophaeus MCM61. B. altitudinis TM22 co‐produced three prominent families of LPs, including surfactin, fengycin and iturin in support of our previous work; Bacillus species co‐producing these three LPs were regarded as the most promising antagonists,55 and their additive efficacy has been documented against several plant pathogens.56, 57 Iturin is the principal inhibitory compound in the biological control activity of Bacillus species.58 Iturin makes pores in biological membranes, causing an osmotic disturbance.59 Iturin anchors into the lipid bilayer membrane and creates irreversible pores in the membrane by inserting surfactin molecules, which causes disruption and solubilization of the biological membrane.60 In agreement with our work, Kim et al.61 isolated a UV mutant strain BSM54 producing high levels of iturin with two‐fold higher inhibitory activity against F. oxysporum compared to wild‐type B. velezensis. They attributed the enhanced activity of BSM54 to the production of high levels of iturin. In previous studies, it has been reported that Bacillus strains co‐producing surfactin and iturin have higher antifungal activity, because surfactin makes mixed micelles with iturin.62, 63 Therefore, the higher inhibitory activity of B. altitudinis TM22 in our study can be attributed to the co‐production of surfactin and iturin. Surfactin has promising surface‐ and membrane‐active, emulsifying and foaming properties.64 Bacillus bacteria with surfactin‐producing ability exhibit biofilm formation and swarming motility, facilitating bacterial cell movement. Fengycin is another essential LP showing considerable inhibition of filamentous fungi.52 It interacts with the lipid bilayer membrane, leading to membrane solubilization, altered membrane structure and permeability, and the creation of ion channels in the lipid bilayer membrane.65 Likewise, the production of bacillomycin, bacilysin, bacillibactin and bacillaene also has been reported to be antimicrobial.66 The synergistic action of LPs and PKs has been reported in a previous study where mutant Bacillus strains deficit in any LP or PK biosynthesis have exhibited low antagonistic activity supporting the importance of synergism.67, 68 For instance, some LPs may not be strongly antimicrobial by themselves but they enhance the activity of other LPs. For example, surfactin facilitates biofilm formation and enhances membrane penetration of iturin. It has been reported that the antagonistic activity is significantly lower when certain LPs are missing in Bacillus. For example, a double mutant of B. amyloliquefaciens FZB42 lacking both bacillomycin and fengycin showed no suppression of F. graminearum.69 Therefore, the co‐production of these three LPs and other LPs and PKs by Bacillus species can be considered the cause of the promising antifungal potential of B. altitudinis TM22.
Bacillus altitudinis TM22 exhibited a strong ability to produce HCN in a qualitative test where the filter paper turned reddish‐brown. HCN‐producing Bacillus species are safe for the plants with no reported detrimental effects on plant health.70 HCN is a systemic poison, and its toxic effect is caused by its ability to inhibit crucial enzymes such as cytochrome c oxidase, which is responsible for causing suppression of Fusarium species.71 HCN is a potent secondary metabolite which disrupts cellular respiration and prevents oxygen‐use efficiency in plant pathogens. It interferes with the electron transport chain by irreversible binding with iron‐containing cytochrome c oxidase (complex IV) in mitochondria of fungal cells and ultimately blocks the final step of aerobic respiration.72 It also inhibits the reduction of O_2_ to H_2_O, halts the process of ATP production resulting in loss of energy in fungal cells.72 In an earlier report by Agha et al.,70 B. velezensis showed the ability to produce HCN and suppress F. oxysporum in wheat plants (Triticum aestivum L.). Ahmad et al.73 reported in their study that 50% of the tested Bacillus isolates were able to produce HCN, which was correlated with their potential to suppress plant pathogens.
Furthermore, in this investigation, treatment of cotton seeds with B. altitudinis TM22 and B. atrophaeus MCM61 showed more pronounced suppression of Fusarium wilt and improved vegetative traits of cotton plants compared to soil drenching. Most previous studies have used only the direct application method in the soil. However, we compared the efficacy of two treatment delivery methods; seed biopriming and soil drenching, for their antagonistic effect against Fusarium wilt in cotton plants. Seed priming with Bacillus strains had a more positive effect on reducing the disease development and enhancing the plant biomass compared to soil drenching. In agreement with our study, Zhang et al.74 reported that seed priming of cotton seeds with B. subtilis and Gliocladium virens reduced the infection of Fusarium wilt disease, resulting in more vigorous and higher‐yielding plants. In another instance, Hasan et al.17 reported a substantial decrease in the development of Verticillium wilt in Bacillus‐treated cotton plants. Likewise, Akram et al.75 reported that coating seeds with the B. aryabhattai strain Z‐48 suppressed Fusarium wilt disease in tomato plants and enhanced the biomass. In this study, we have compared the effects of seed biopriming and soil drenching with Bacillus application on the suppression of Fusarium wilt and growth promotion of cotton plants. However, there is a lack of research reports on the comparative effects of seed biopriming and soil drenching with Bacillus on the suppression of plant diseases and plant growth promotion. Seed coating with PGPR Bacillus species helps to protect seeds and seedlings against pathogen attack during seed germination and development while simultaneously promoting plant growth.76 Seed priming with Bacillus species enables the bacteria to colonize the seeds and protect the plants from disease through direct or indirect mechanisms, including competition for space and nutrient acquisition, production of antimicrobial compounds, hydrolytic enzymes and the induction of systemic resistance.77 By applying Bacillus directly to the seeds, it ensures better colonization of the soil, providing a competitive edge over plant pathogens during the early growth stages of plants.76 The close association between Bacillus and plants induces systemic defense, improves germination rate and seedling vigor, and also promotes biofilm formation, which ultimately results in better plant growth. Seed biopriming with Bacillus species also improves physiological processes in the seed and, thus, plant growth.78 Compared to seed biopriming, soil drenching results in poor survival of biological control agents as a consequence of competition, inefficient root colonization and environmental instability.79 In agreement with our findings, several previous studies have reported that seed biopriming with Bacillus performed consistently better to suppress plant diseases and improve plant growth compared to soil drenching.76, 79 In our study the growth parameters of cotton plants were significantly improved in Bacillus‐treated plants. Several previous studies have reported the growth‐promoting effect of endophytic Bacillus species on a variety of plants, including chilli pepper (Capsicum annum L.),80 tomato (Solanum lycopersicum L.),81 tobacco (Nicotiana tabacum),82 cotton5 and soybean.83 Bacillus species promote plant growth by producing growth hormones such as indole‐3‐acetic acid and gibberellic acid, and through phosphate solubilization and siderophore production.5, 84 In the control treatment herein LB broth was used which had no reported effects on plant growth and pathogen inhibition.
The use of Bacillus as a bio‐fungicide through seed biopriming and soil‐drenching application methods boosted carotenoid levels, together with chl a and chl b contents, alongside improved RWC, photosynthetic rate and stomatal conductance in plants under pathogen attack. A previous investigation by Xie et al.85 showed that B. subtilis OKB105 species enhances photosynthesis rate together with chlorophyll production in tobacco plants. Likewise, Rashid et al.86 reported that the biomass of wheat plants was increased after treatment with B. megaterium, and the amount of photosynthetic pigments, RWC and osmolytes was improved under drought conditions. Previous studies also have reported that the application of Bacillus species resulted in higher rates of photosynthesis‐related gene expression and improved photosynthetic performance.87, 88 The findings of our study indicate that applying Bacillus strains improved the physiological processes in cotton plants. The positive and growth‐promoting effects of Bacillus species are likely to be responsible for the increased plant biomass and enhanced rate of physiological processes.
This research showed that Bacillus‐treated cotton plants displayed reduced stress markers, including EL, H_2_O_2_ and MDA, whereas the infected control plants maintained high‐stress marker levels. In a previous study, the application of B. subtilis combined with Trichoderma viride reduced the levels of H_2_O_2_, EL and MDA, thus preventing Rhizoctonia fragariae from causing black root rot in strawberries.89 Under drought and heat stress conditions, B. mycoides strain A3 effectively decreased the H_2_O_2_, EL and MDA levels in Arabidopsis thaliana seedlings.90 The cell membrane is a dynamic structure involving several physiological and biochemical processes which control cell membrane permeability. Plant pathogens penetrate the cell membranes directly, rapidly changing membrane permeability.91 The pathogen attacks the plant cells directly, resulting in enhanced electrolyte leakage.92 MDA is the final product in the process of lipid peroxidation.93 Lipid peroxidation is another physiological process triggered by free radicals causing membrane damage. The earliest defense mechanism of plants in response to pathogen attack is oxidative burst where reactive oxygen species (ROS) are released.94 H_2_O_2_ is a ROS that is converted into O_2_ and H_2_O, and triggers lipid peroxidation and cellular damage. The high accumulation of ROS is lethal for cells because unpaired electrons scavenge the other electrons from cell molecules to acquire stability, resulting in protein oxidation, lipid peroxidation and cellular damage.89 Cellular damage results in increased electrolyte leakage from the cell, ultimately leading to cell death.95 Therefore, the decrease in EL, MDA and H_2_O_2_ levels can be attributed to the effect of Bacillus species, which has reduced cell damage and maintained cell membrane integrity.
In order to further understand the potential of Bacillus species in defense elicitation, the activity of defense‐related enzymes was evaluated in treated cotton plants. Both Bacillus species TM22 and MCM61 enhanced the activity of plant defense‐related enzymes and conferred enhanced plant defense. Bacillus species have been reported to improve plant defense activity against biotic and abiotic stresses by enhancing the activities of defense enzymes, including SOD, POD, CAT, PPO and PAL.96 In a previous study, Wu et al.97 reported that B. subtilis SL‐44 enhanced the activity of SOD, PPO, PAL, CAT and POD to protect pepper plants (Capsicum annuum) from Rhizoctonia solani infection. Another study by Chen et al.,67 supported our findings, where B. subtilis B579 increased the activity of POD, PAL and PPO against Fusarium wilt of cucumber. Xu et al.98 reported that B. siamensis N‐1 reduced the disease incidence of soft rot in pitaya caused by F. oxysporum by regulating the activity of GLU, CHI, PAL, PPO and POD enzymes. Each of these enzymes plays vital and unique roles in plant defense. The phenylpropanoid pathway is an essential plant metabolic process that produces several toxic phenols and flavonoids. POD is an important defense enzyme that takes part in the final stage of lignin biosynthesis and converts phenolic compounds into very toxic quinones.49
The enzyme PPO converts phenols and lignin into extremely harmful quinones, inhibiting pathogens.51 The biochemical function of CAT is to convert H_2_O_2_ into O_2_ gas and H_2_O, which function together as O‐scavenging components.99 Through the breakdown of superoxide anion (O^2•−^), SOD prevents cellular damage by generating harmless end‐products.100 The enzyme APX functions like SOD by breaking down H_2_O_2_ to O_2_ gas and H_2_O by using ascorbate as an electron donor for protecting plant cells from oxidative damage.101 The main structural component of fungal cell walls, chitin, is destroyed by the action of chitinase enzyme, which results in weakening or destruction of the cell wall of fungal pathogens.102 Therefore, it is concluded that these defense‐related enzymes utilize diverse MoAs to protect the plants from pathogen attack.
The expression of defense‐related genes HMGR, GST, PAL, PPO, MPK3, APX, POD, CAT and SOD was assessed in cotton plants in response to treatment with Bacillus species. The research findings by Chandrasekaran & Chun103 validated our study, which demonstrated that SOD, CAT, PAL, PPO, POD and GLU genes displayed enhanced activity in tomato plants treated with B. subtilis strain CBR05 against Erwinia carotovora subsp. carotovora. Hasan et al.17 studied how endophytic Bacillus species enhanced the expression of MPK3, SOD, PAL, GST, PPO and HMGR genes in upland cotton plants against Verticillium wilt disease. The use of B. thuringiensis reduced the infection of Ralstonia solanacearum in tomato plants by increasing the expression of defense‐related genes and provided protection against subsequent pathogen attacks.104 Plants are protected by the pathogen attack by increasing the expression of defense‐related genes and their transcription and translation into corresponding defense‐related compounds. The MPK3 gene produces critical defense signaling proteins known as mitogen‐activated protein kinases which are involved in pathogen‐related signal transductions.105 The MPK3 gene has been reported to be the key factor that offers initial resistance against Botrytis cinerea infection.106 The GST gene encodes the glutathione S‐transferase enzyme, an important detoxifying enzyme that enhances resistance against biotic and abiotic stresses.107 The HMG‐CoA reductase enzyme encoded by the HMGR gene catalyzes the first step in the mevalonate (MVA) pathway. Isoprenoids are synthesized in the MVA pathway, which is essential for defense elicitation against biotic and abiotic stresses.108, 109 Therefore, suppression of Fusarium wilt in cotton is likely to be associated with the potential of Bacillus species to enhance the activity of defense‐related enzymes and expression of relevant genes.
CONCLUSION
5
Conclusively, our study demonstrates the promising antagonistic potential of B. altitudinis TM22 and B. atrophaeus MCM61 to protect cotton plants from Fusarium wilt disease in a series of in vitro and glasshouse experiments. Application of these Bacillus strains via seed biopriming and soil drenching reduced disease development. Moreover, these strains improved the biomass of cotton plants by improving physiological processes, defense‐related enzyme activity, the expression of defense‐related genes and by lowering the oxidative stress. These findings reveal that Bacillus species hold great promise as biocontrol agents for developing sustainable and eco‐friendly management strategies to control the Fusarium wilt of cotton. In the future, novel Bacillus strains with high antagonistic potential should be explored, and their applications at the field level must be tested.
FUNDING INFORMATION
This research was funded by Taif University, Taif, Saudi Arabia, Project no. (TU‐DSPP‐2024‐37).
CONFLICT OF INTEREST
The authors disclose no potential conflicts of interest.
AUTHOR CONTRIBUTIONS
Conceptualization: T.M., A.M., F.Z., E.F., T.I.; methodology: T.M., A.M., M.N.A.; software: O.M.A., F.H.; validation: A.M., F.Z., F.H., A.F.A., S.S.A, A.A., S.A.; investigation: A.M., F.Z., F.H., A.F.A., S.S.A, A.A., S.A., T.I., data curation: T.M., A.M., F.Z., A.F.A., S.S.A, A.A., writing—original draft preparation: A.M., T.M.; writing—review and editing: T.M., A.M., F.Z., M.N.A., E.F., T.I., F.H., A.F.A., S.S.A, A.A., S.S.A., A.A., S.A; supervision: A.M., M.N.A.; project administration: A.M.
Supporting information
Fig. S1. Maximum‐likelihood phylogenetic tree of F. oxysporum f. sp. vasinfectum. The evolutionary distances are computed using the Tamura–Nei model. The gaps and missing data were completely eliminated resulting in a final set comprising 574 positions. Fig. S2. Neighbor‐joining phylogenetic tree of Bacillus species. The optimal tree shown in this figure has a sum of branch length 1.751. The tree is drawn to scale where the evolutionary distances are computed using the Tamura–Nei model. All ambiguous positions were deleted using pairwise deletion method with a final set comprising 2478 positions.
The reference list from the paper itself. Each links out to its DOI / PubMed record.
- 1Lou H , Zhu J , Zhao Z , Han Z and Zhang W , Chitinase gene Fo Chi 20 in Fusarium oxysporum reduces its pathogenicity and improves disease resistance in cotton. Int J Mol Sci 25:8517 (2024). 10.3390/ijms 25158517.39126085 PMC 11312659 · doi ↗ · pubmed ↗
- 2Zhao Y , Liu S , He B , Sun M , Li J , Peng R et al., Phosphate‐solubilising bacteria promote horticultural plant growth through phosphate solubilisation and phytohormone regulation. N Z J Crop Hortic Sci 52:125–140 (2024). 10.1080/01140671.2022.2103156. · doi ↗
- 3Chaudhary P , Xu M , Ahamad L , Chaudhary A , Kumar G , Adeleke BS et al., Application of synthetic consortia for improvement of soil fertility, pollution remediation, and agricultural productivity: a review. Agronomy 13:643 (2023).
- 4Ngalimat MS , Mohd Hata E , Zulperi D , Ismail SI , Ismail MR , Mohd Zainudin NAI et al., Plant growth‐promoting bacteria as an emerging tool to manage bacterial rice pathogens. Microorganisms 9:682 (2021).33810209 10.3390/microorganisms 9040682 PMC 8065915 · doi ↗ · pubmed ↗
- 5Mahmood T , Moosa A , Zulfiqar F , Aslam MN , Zhao H , Mohammadi M et al., Comparative effects of Bacillus strains applied via seed biopriming and soil drenching applications on the morpho‐physiological and transcriptional aspects of cotton. J Basic Microbiol 65:e 2400665 (2025). 10.1002/jobm.202400665.39916338 · doi ↗ · pubmed ↗
- 6Jeżewska‐Frąckowiak J , Seroczyńska K , Banaszczyk J , Jedrzejczak G , Żylicz‐Stachula A and Skowron PM , The promises and risks of probiotic Bacillus species. Acta Biochim Pol 65:509–519 (2018). 10.18388/abp.2018_2652.30521647 · doi ↗ · pubmed ↗
- 7Haas D and Défago G , Biological control of soil‐borne pathogens by fluorescent pseudomonads. Nat Rev Microbiol 3:307–319 (2005). 10.1038/nrmicro 1129.15759041 · doi ↗ · pubmed ↗
- 8Akinsemolu AA , Onyeaka H , Odion S and Adebanjo I , Exploring Bacillus subtilis: ecology, biotechnological applications, and future prospects. J Basic Microbiol 64:2300614 (2024). 10.1002/jobm.202300614.38507723 · doi ↗ · pubmed ↗