EPB41L family serves as a prognostic biomarker for kidney renal clear cell carcinoma
Gonglin Tang, Kai Sun, Guixin Ding, Jitao Wu, Jian Ma, Hongwei Zhao

TL;DR
The EPB41L gene family is linked to worse outcomes in kidney cancer and could help predict patient survival.
Contribution
This study identifies EPB41L as a novel prognostic biomarker for kidney renal clear cell carcinoma.
Findings
EPB41L expression is reduced in kidney cancer tissue and linked to lower survival rates.
Low EPB41L levels correlate with overall survival and immune cell infiltration in KIRC.
Increased EPB41L methylation is associated with poor prognosis in KIRC patients.
Abstract
EPB41L1-5 is known to maintain cell morphology and signal transduction, with evidence suggesting it can inhibit tumor progression. However, its role in kidney renal clear cell carcinoma (KIRC) is not fully understood. This study evaluated EPB41L1-5’s prognostic value in KIRC using bioinformatics methods and validation through qPCR, immunohistochemistry, and cell functional experiments. The results demonstrated a decreased expression of EPB41L in KIRC tissue compared to normal renal tissue, correlating with lower survival rates. Low EPB41L expression was also associated with overall survival in KIRC. Additionally, EPB41L was found to be involved in extracellular matrix regulation, G protein-coupled receptor ligand binding, and multiple immune cell infiltrations. In addition, their elevated methylation levels are associated with poor prognosis in KIRC patients. Overall, EPB41L family is a…
Genes, proteins, chemicals, diseases, species, mutations and cell lines named across the full text — each resolved to its canonical identifier and authoritative record.
Click any figure to enlarge with its caption.
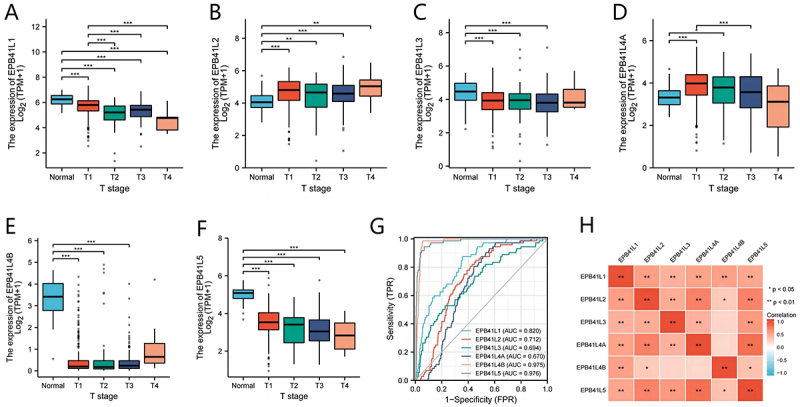 Figure 1
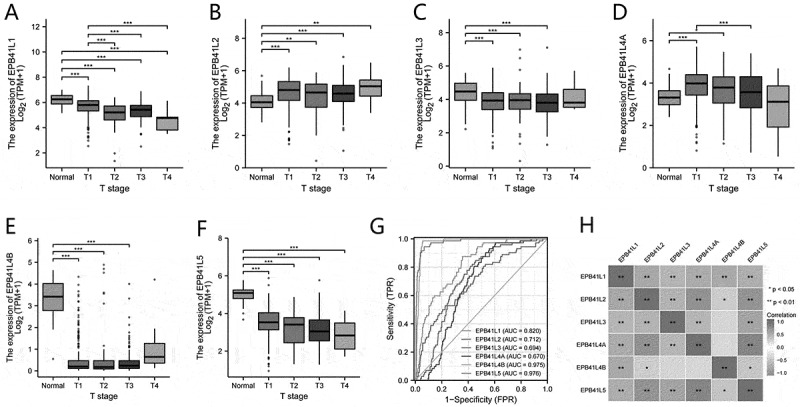 Figure 2
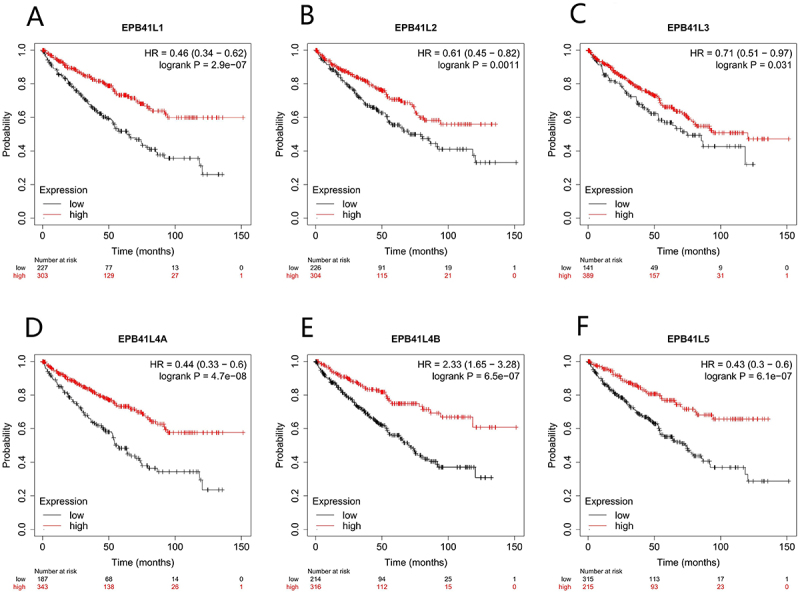 Figure 3
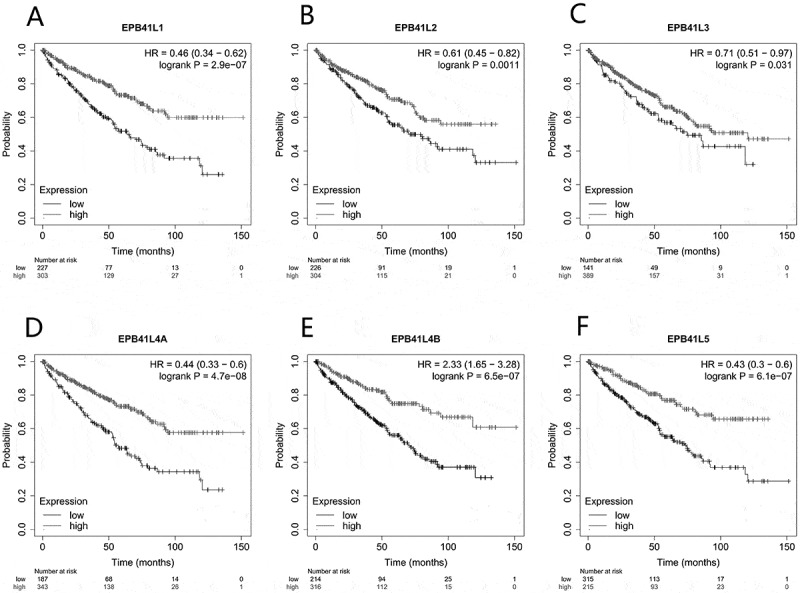 Figure 4
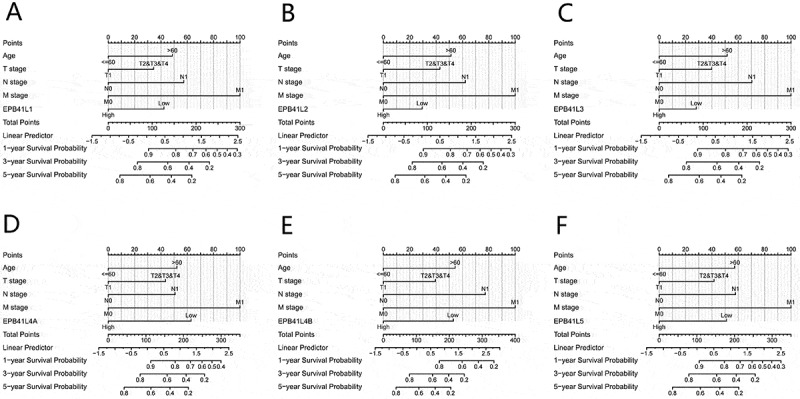 Figure 5
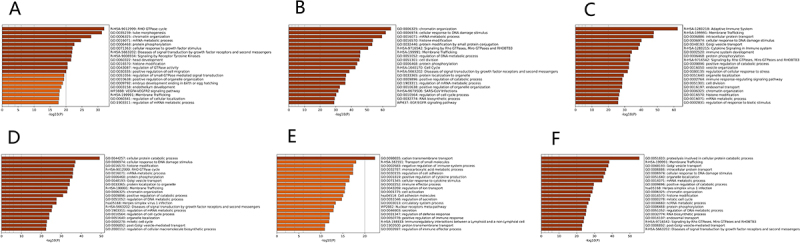 Figure 6
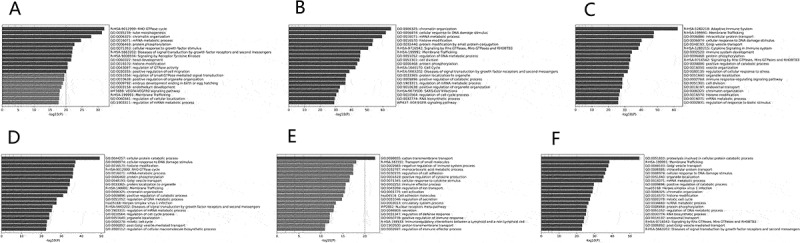 Figure 7
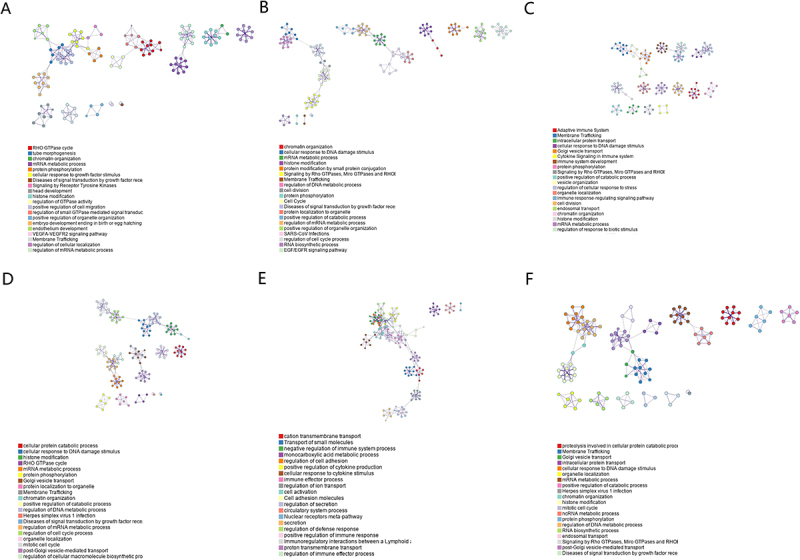 Figure 8
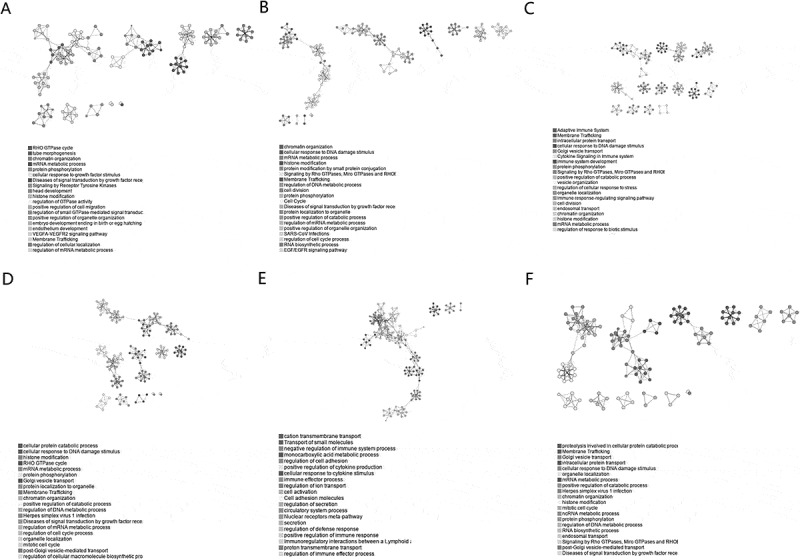 Figure 9
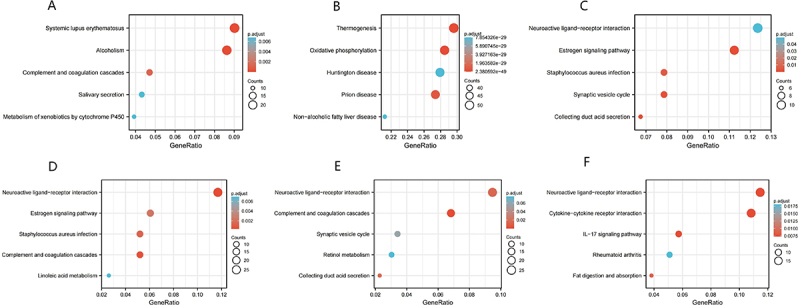 Figure 10
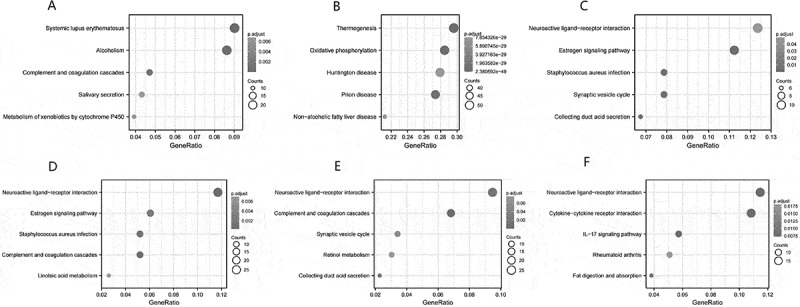 Figure 11
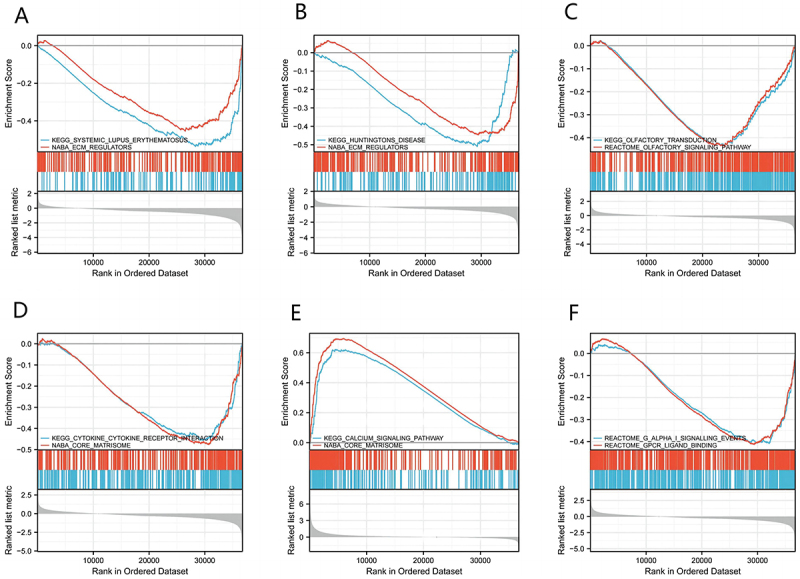 Figure 12
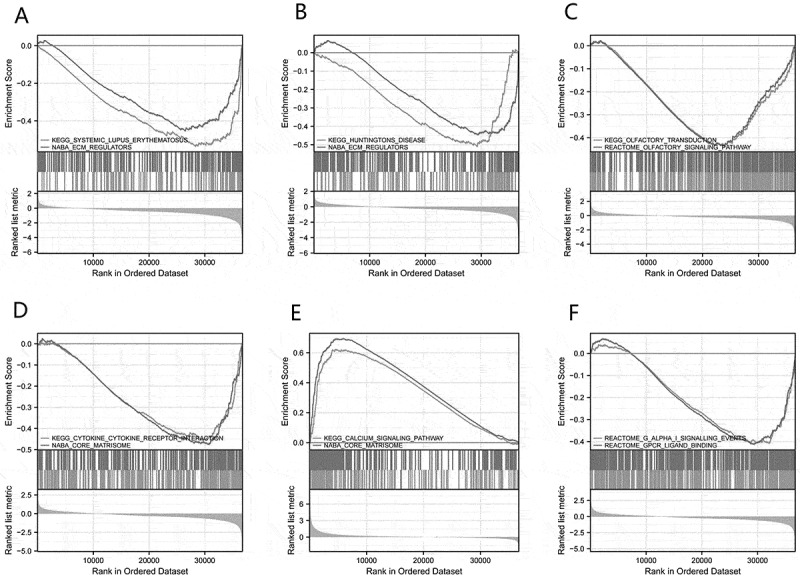 Figure 13
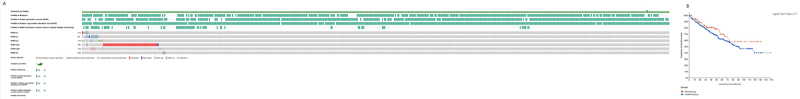 Figure 14
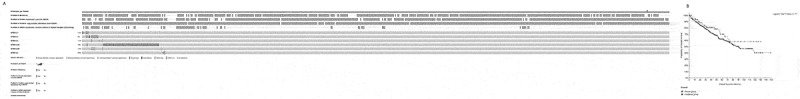 Figure 15
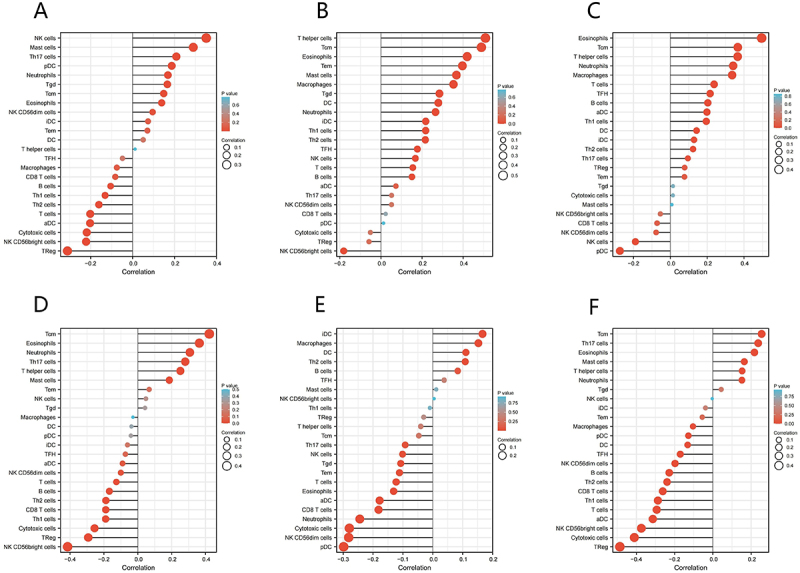 Figure 16
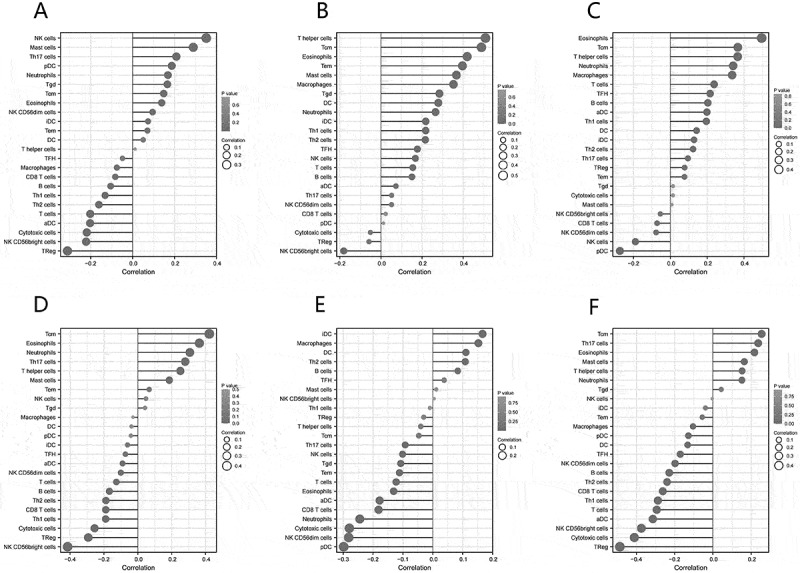 Figure 17
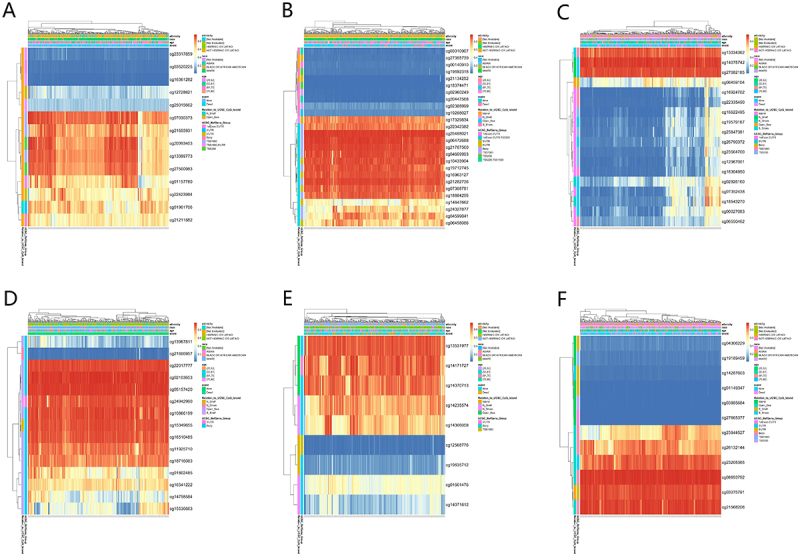 Figure 18
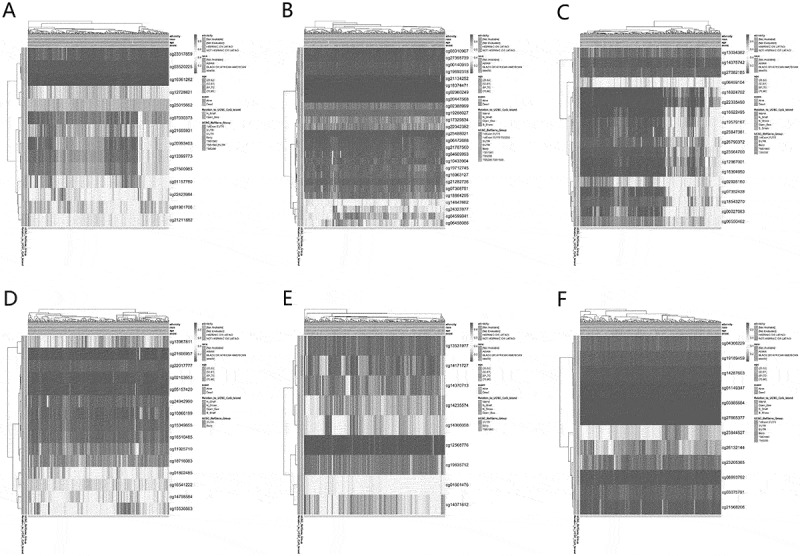 Figure 19
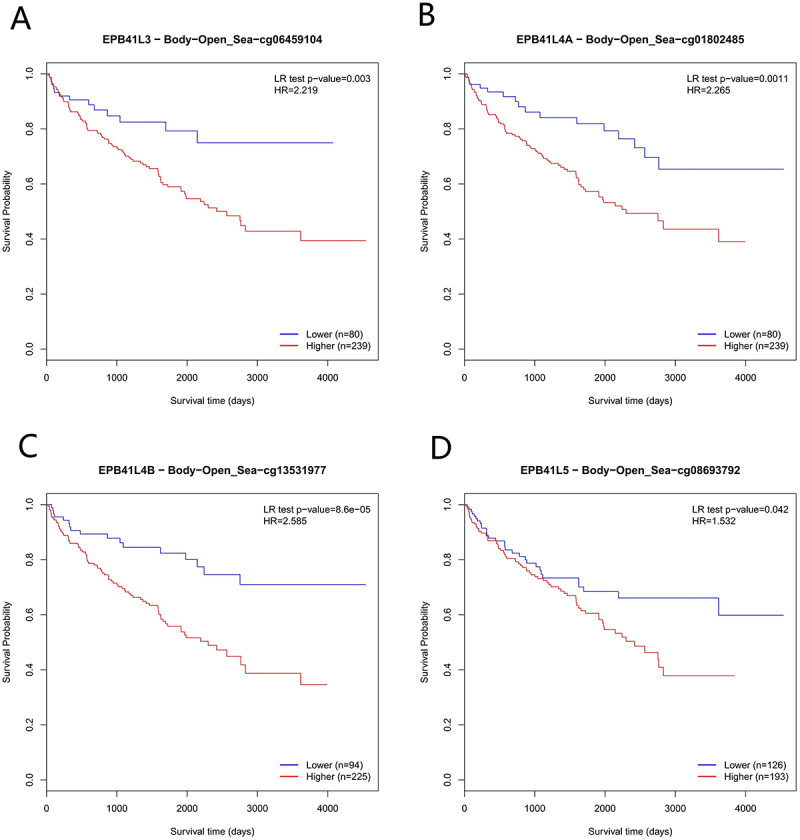 Figure 20
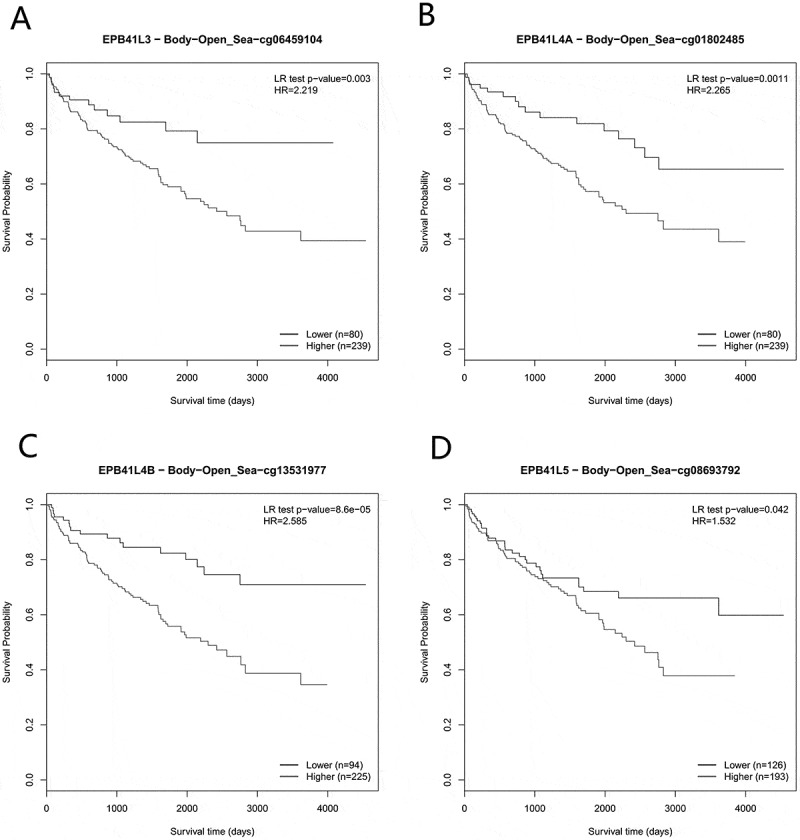 Figure 21
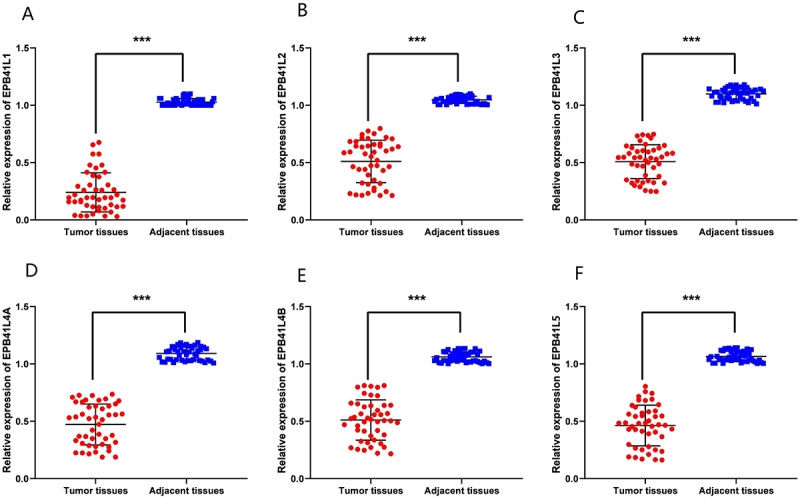 Figure 22
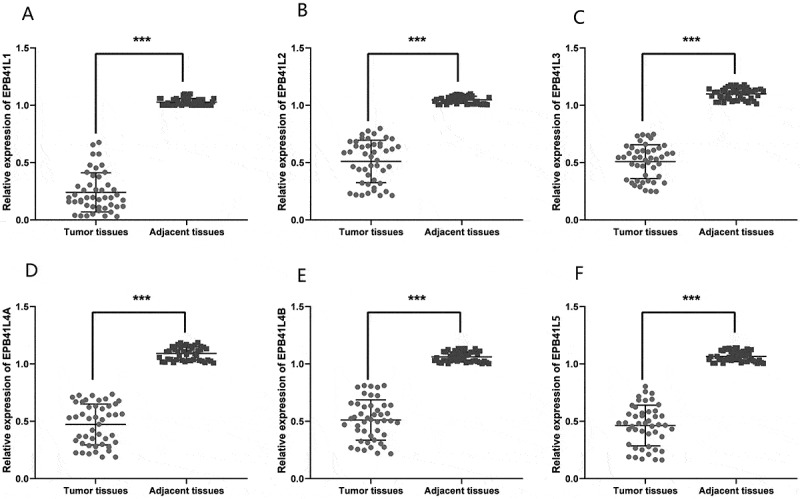 Figure 23
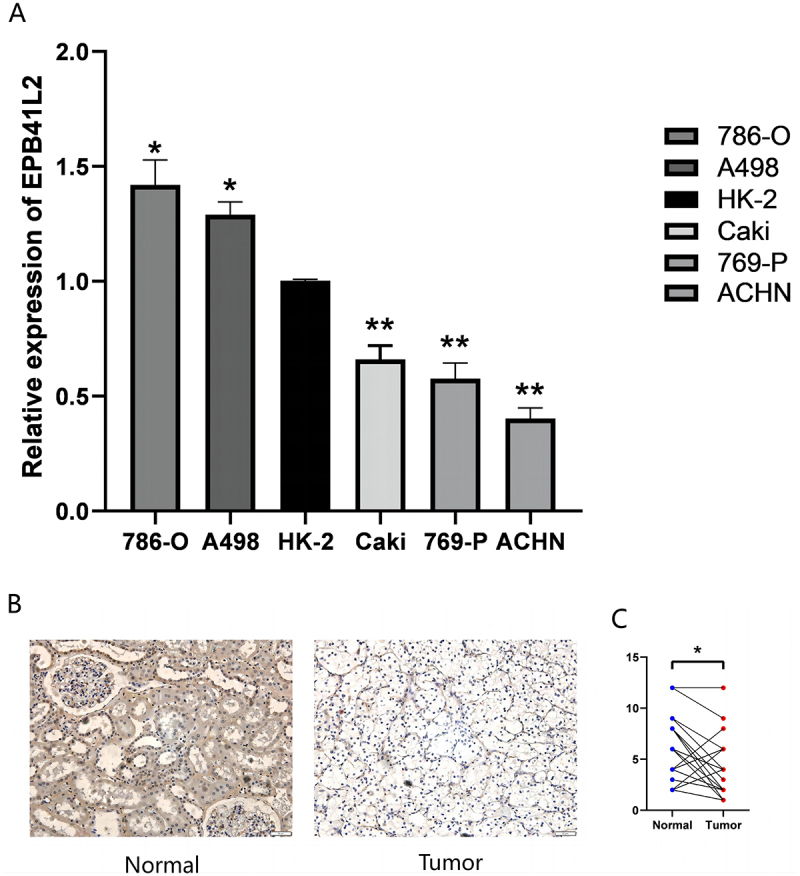 Figure 24
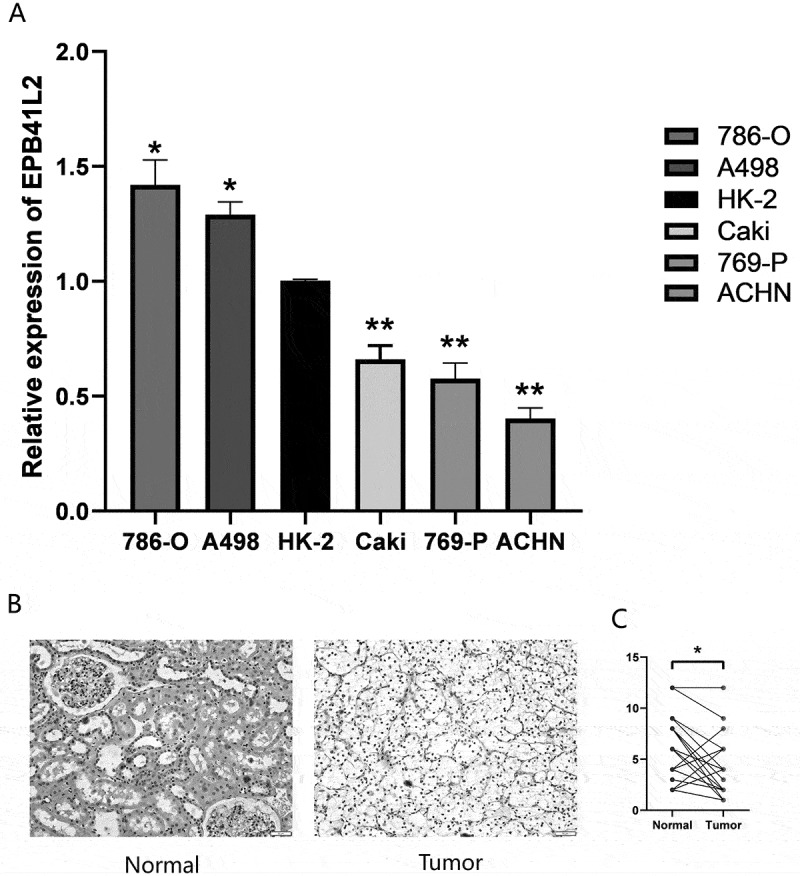 Figure 25
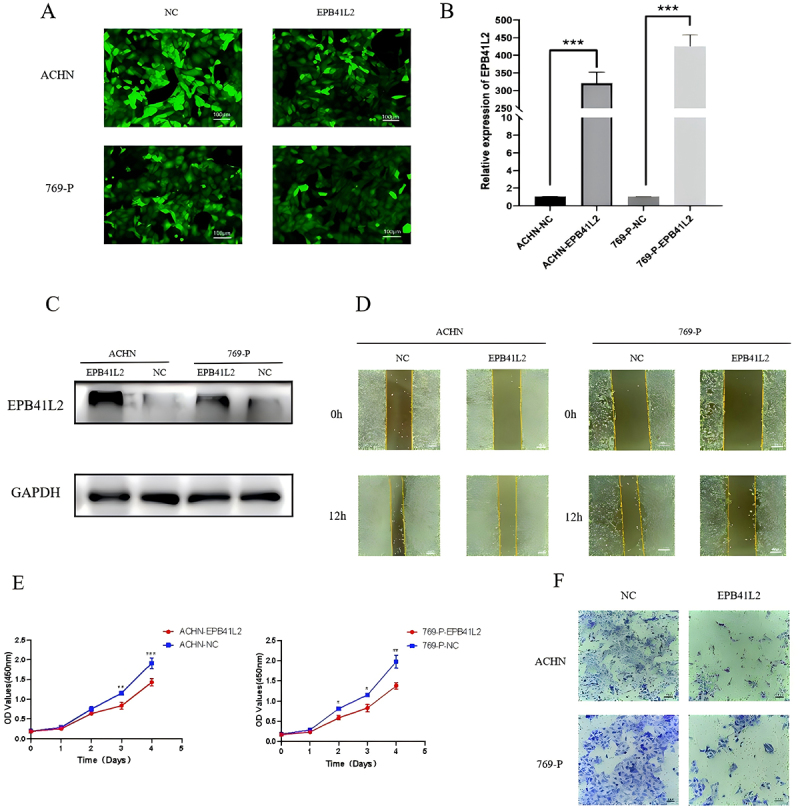 Figure 26
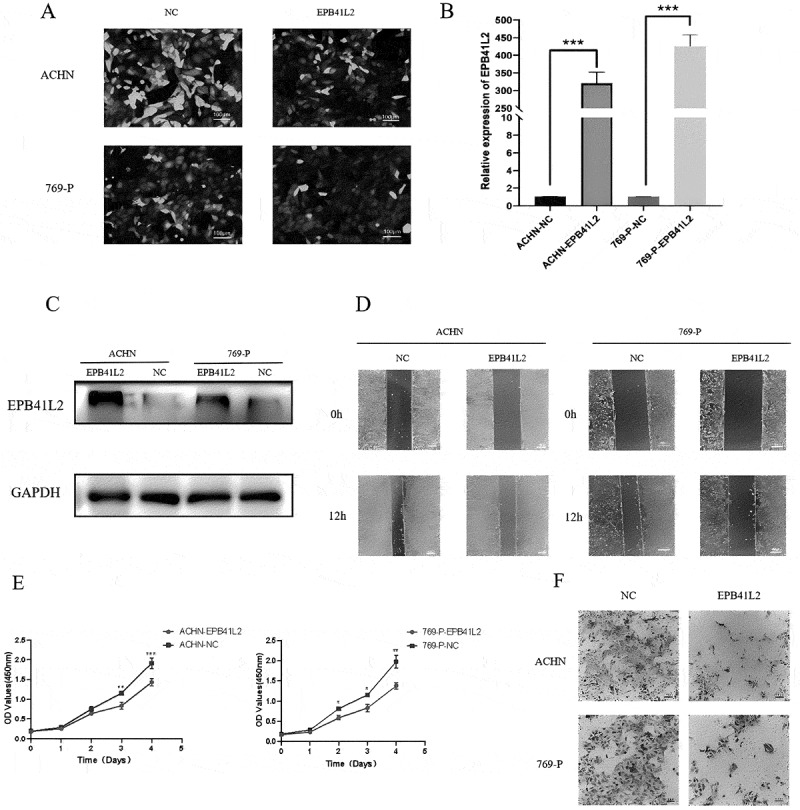 Figure 27
- —National Natural Science Foundation of China10.13039/501100001809
- —Taishan Scholar Foundation of Shandong Province10.13039/501100010029
- —Natural Science Foundation of Shandong Province10.13039/501100007129
Peer Reviews
No public reviews on file for this paper yet. If you reviewed it on a platform where reviews are public (OpenReview, ICLR, NeurIPS, ICML), you can paste yours below so the community can read it here.
Videos
No videos yet. Explain this paper in a talk, walkthrough, or lecture? Add one.
Taxonomy
TopicsFerroptosis and cancer prognosis · Renal cell carcinoma treatment · Autophagy in Disease and Therapy
Introduction
Kidney Renal Clear Cell Carcinoma (KIRC) is a type of kidney cancer that originates in the cells lining the small tubes within the kidney. KIRC is the most common type of kidney cancer, accounting for approximately 70–80% of all cases. It is a highly aggressive cancer that can spread to other parts of the body [1,2]. The precise etiology of KIRC remains incompletely understood, yet several risk factors have been identified, including smoking, obesity, high blood pressure, and a familial history of kidney cancer [2]. Treatment options for KIRC include surgery to remove the affected kidney or a portion of it, radiation therapy, chemotherapy, or targeted therapy [3]. KIRC, particularly in advanced stages, remains a formidable therapeutic challenge. Current research efforts focus on developing novel treatment strategies and improving early diagnostic approaches to enhance patient outcomes.
The EPB41L gene family, also known as the erythrocyte membrane protein band 4.1-like (EPB41L) family, comprises a group of genes that encode proteins involved in cellular cytoskeletal organization, signal transduction, and membrane transport [4,5]. These proteins play a crucial role in maintaining cellular morphology, signal transduction, cell adhesion, and cell motility, among other biological processes. The family consists of 6 members: EPB41L1, EPB41L2, EPB41L3, EPB41L4A, EPB41L4B and EPB41L5. This protein is also associated with the occurrence and development of tumors and is considered a tumor suppressor. Mutations in the EPB41L gene are related to the occurrence and development of various diseases, such as cataracts, KIRC, breast cancer, and colon cancer [6–8]. In the era of precision oncology for KIRC, therapeutic decisions increasingly rely on tumor-intrinsic and microenvironmental features rather than histology alone [9].
Bioinformatics tools are employed to interrogate the whole-genome sequencing data of urological neoplasms, aiming to identify tumor-specific genetic aberrations, copy number variations, and structural variants [10]. Transcriptomic analyses have elucidated alterations in gene expression within tumors, aiding researchers in deciphering the molecular underpinnings of neoplastic processes [11,12]. Furthermore, artificial intelligence and machine learning technologies are harnessed for pattern recognition, predictive model development, and the analysis of voluminous datasets, advancing the discovery of novel biomarkers and therapeutic approaches. The role of bioinformatics in diverse domains of medical research is poised for continued expansion [13,14].
In this study, we investigated the functional roles of the EPB41L family in KIRC. Leveraging data from The Cancer Genome Atlas (TCGA) database, we examined the expression profiles of EPB41L1-5 and evaluated their prognostic significance in KIRC. We first compared EPB41L expression levels between tumor and adjacent normal kidney tissues from KIRC patients. Subsequently, we analyzed the associations between EPB41L expression and clinicopathological characteristics using univariate and multivariate Cox proportional hazards regression analyses. Based on these findings, we constructed a prognostic nomogram and validated its predictive performance. To elucidate the underlying biological mechanisms of EPB41L function, we performed Gene Ontology (GO) enrichment analysis and gene set enrichment analysis (GSEA). Considering the known association between EPB41L and methylation, we also investigated its relationship with mutations, immune infiltration, and methylation [15–17]. Lastly, we validated the expression of EPB41L in clinical specimens from KIRC patients and renal cancer cell lines, providing a comprehensive analysis of the connection between EPB41L and tumor development.
Materials and methods
Clinical data from TCGA databases
We obtained gene expression data, including HTSeq-Counts and HTSeq-FPKM, phenotype data, and extensive clinicopathological information for TCGA-KIRC through the UCSC Xena platform. The sequence data was sourced from the Illumina HiSeq_RNA_Seq platform. Following this, the HTSeq-FPKM gene expression data was converted to TPM (transcripts per million reads) format for further analyses.
Low-expression of EPB41L in samples with KIRC
The expression levels of EPB41L were compared between tumor tissues and their corresponding normal tissues in patients diagnosed with KIRC. To investigate the correlations among EPB41L1-5 levels in KIRC, the corrplot R package (version 0.85) and pROC R package (version 1.18) were employed.
Correlation between EPB41L and survival
Kaplan-Meier survival curves were generated using the survival R package (version 0.13) to evaluate the prognostic value of EPB41L1-5 expression. With patients stratified into high- and low-expression groups based on the median expression value of each EPB41L gene through the TCGA database; statistical significance was assessed using the log-rank test, with a threshold of p < .05, and follow-up time was measured in months from diagnosis to death or last clinical follow-up.
Development and assessment of a nomogram and prognostic model
Cox regression analysis was employed for prognostic model development, with univariate analysis including variables significant at p < .05 for multivariate analysis, which computed hazard ratios (HR) with 95% confidence intervals, and the proportional hazards assumption was verified using Schoenfeld residuals test. The nomogram was constructed using the rms R package (version 6.0) and Hmisc R package (version 4.4) to predict 1-, 3-, and 5-year overall survival probabilities, followed by model validation through C-index calculation with 1000 bootstrap replicates, calibration plot generation via 1000 bootstrap resampling iterations.
Functional enrichment analysis
For the identification of co-expressed genes with EPB41L1-5, we utilized GEPIA2.0 (http://gepia2.cancer-pku.cn/). Significant co-expression pairs were defined based on the following criteria: a Pearson correlation coefficient ∣R∣ > 0.4 and a statistical significance of p < .001. To focus on strong positive associations, the top 100 positively correlated genes for each EPB41L member were selected for further analysis. Subsequently, Gene Ontology (GO) enrichment analysis of these co-expressed gene sets was performed using Metascape (version 3.5, https://metascape.org/) with the whole human genome serving as the background. Statistically significant GO terms were filtered based on a p-value < .01, a minimum enrichment score > 1.5, and a minimum gene count > 3, with multiple testing correction applied using the Benjamini-Hochberg false discovery rate (FDR) method.
Gene set enrichment analysis
To identify differentially expressed genes, we performed RNA-seq data analysis using the DESeq2 R package (version 1.28) with median of ratios normalization. Genes with an absolute log2 fold change greater than 1 and an adjusted p-value below 0.05 were considered statistically significant [18,19]. For gene set enrichment analysis, we employed both the clusterProfiler (version 4.0.5) [20]. The objective of this analysis was to identify statistically significant disparities in pathways between populations with high and low expression levels of EPB41L1-5 in KIRC. The expression level of EPB41L1-5 was used as the phenotype label. Pathway terms were considered significantly enriched if they exhibited an adjusted P-value of less than 0.05 and an FDR q-value of less than 0.25.
EPB41L1-5 mutations and prognosis cBioPortal serves as an invaluable resource for exploring, visualizing, and analyzing multidimensional cancer genome data [21]. In our research, we conducted a thorough examination of the genomic profiles for EPB41L1-5, setting a z-score threshold of ±1.8. We meticulously assessed the genetic mutations in EPB41L1-5 and their correlation with overall survival (OS).
Evaluation of immune infiltration in relation to EPB41L1-5 expression through ssGSEA analysis
In order to assess the associations between EPB41L1-5 and the levels of immune cell infiltration, the ssGSEA (single-sample Gene Set Enrichment Analysis) technique was employed utilizing the GSVA R package (version 1.40). The comparative levels of 24 types of immune cells infiltrating tumors were assessed based on immunocyte signatures, which incorporated 714 genes for individual tissue sample prediction. By referencing immunocyte signature genes from the literature, a relative enrichment score was calculated for each immunocyte based on the gene expression profile of individual tumor samples [22]. The association between immune infiltration scores and gene expression was evaluated using Spearman correlation analysis, with statistical significance defined as p < .05.
The correlation between the expression of EPB41L1-5 and methylation
Research suggests that EPB41L is linked to methylation. Consequently, we carried out an additional analysis on the association between EPB41L1-5 and methylation. The Spearman correlation coefficient was calculated to assess the correlation between EPB41L1-5 and methylation levels in TCGA-KIRC. MethSurv was employed for this analysis.
Tissue sample acquisition
Between 2021 and 2022, a total of 47 patients who underwent radical or partial nephrectomy at the urology department of Qingdao University Affiliated Yantai Yuhuangding Hospital generously donated KIRC tissues along with corresponding normal renal tissues. Immediately after surgery, the specimens were submerged in liquid nitrogen and subsequently stored in a − 80°C freezer for later analysis. Prior informed consent was obtained from all participants, and the study was ethically approved by the esteemed ethics committee of Qingdao University Affiliated Yantai Yuhuangding Hospital.
Cell purchase and culture
The KIRC cell lines, including 786-O, 769-P, ACHN, Caki-2, and A498, along with the human normal renal proximal convoluted tubular cell line HK-2, are available for purchase from the Cell Bank of the Chinese Academy of Sciences. These KIRC cell lines were grown in RPMI 1640 medium, whereas HK-2 was cultured in DMEM (BI, Israel). Both media contained 10% Fetal Bovine Serum (FBS). All cells were maintained in a humidified incubator set at 37 degrees Celsius and 5% carbon dioxide.
RNA extraction, reverse transcription, and qRT-PCR quantification
RNA was extracted from freshly frozen tissues or KIRC cell lines utilizing the RNA Extraction Kit (Qiagen, China). This was succeeded by reverse transcription with the Evo M-MLV RT Mix Kit (Accurate Biology, China). qPCR was then conducted using the SYBR® Green Premix Pro Taq HS qPCR Kit and Rox Reference Dye (Accurate Biology, China), with GAPDH serving as the internal reference gene, and the relative expression level of the target gene was determined using the 2^−ΔΔCT^ calculation method. Each experiment was conducted in triplicate [23].
Immunohistochemical
Immunohistochemical staining was conducted utilizing a Roche Bench Mark GX semi-automatic machine for the detection of cancerous and adjacent non-cancerous tissues. Paraffin-embedded samples were sliced at 0.4 mm intervals, and two consecutive sections were cut and heated at 65°C for half an hour. Subsequently, the thin sections underwent HE staining to enhance tissue visualization. Under high magnification, ten random fields of view were selected, and a scoring system was applied based on staining intensity: light yellow cells received a score of 1, yellow-stained cells a 2, and brown-stained cells a 3. The proportion of positively stained cells was assessed as follows: less than 10% (score 0), 11–25% (score 1), 26–50% (score 2), 51–75% (score 3), and over 75% (score 4). The final immunohistochemical score was determined by multiplying these two scores.
Western blot
The cells were lysed in RIPA buffer (Servicebio, China) containing 1% protease inhibitor for 30 minutes, followed by further sonication on ice using a sonicator at approximately 15% power for 10–15 seconds. The resulting protein supernatant was obtained after centrifugation. The supernatant was then mixed with 5× protein loading buffer (Coolaber, China) and heated at 100°C for 10 minutes for sample preparation. SDS-PAGE was performed for electrophoresis, and the proteins were transferred onto a PVDF membrane (Millipore, USA). The membrane was blocked with TBST buffer containing 5% skim milk for 2 hours at room temperature, and then incubated with various primary antibodies overnight at 4°C on a shaker. The membrane was subsequently incubated with secondary antibodies at room temperature for 1 hour. The ECL substrate solution A and B were mixed in equal proportions to prepare the developing solution, which was evenly dropped onto the PVDF membrane and visualized using a protein imaging system. The antibodies used were as follows: rabbit polyclonal EPB41L2 antibody (Abmart, China, Cat No. TP72110S, 1:1000), mouse monoclonal GAPDH antibody (Proteintech, Cat No. 60,004–1-Ig, China, 1:1000), HRP-conjugated goat anti-rabbit secondary antibody (Proteintech, Cat No. SA00001-2, China, 1:5000), and HRP-conjugated goat anti-mouse secondary antibody (Proteintech, Cat No. SA00001-1, China, 1:5000).
Transfection
EPB41L2 overexpression and negative control (NC) lentiviral vectors were synthesized by OBiO Technology Company (China), and subsequently transfected into KIRC cell lines using polybrene.
CCK‑8 assay
ACHN and 769-P cells, which had been transfected with either NC or EPB41L2, were plated in 96-well plates at a density of 2 × 10^3^ cells per well. At 0, 24, 48, 72, and 96 hours, CCK-8 reagent was added. Following a 2-hour incubation at 37°C, cell absorbance was measured at 450 nm using a spectrophotometer.
Wound healing assay
The cells were seeded at a density of 2 × 10^6^ per well in 6-well plates and allowed to adhere for 12 hours. A sterile 1000 μl pipette tip was used to create horizontal and vertical scratches. After cleaning the orifice plate with phosphate buffer, images were taken immediately (at the 0-hour time point) using a microscope. Subsequently, 2 ml of RPMI 1640 complete medium was added to each well for incubation, and images were captured again at the same location after 12 hours. The extent of wound closure was employed as a measure of cell migration [24].
Transwell invasion assay
We used a transwell plate with an 8 μm polycarbonate membrane to evaluate cell invasion. A 65 μl Matrigel matrix was applied to the upper layer of the membrane and incubated for 2 hours. Cells, resuspended in serum-free medium at a density of 5 × 10^4^ cells per well, were then seeded onto the Matrigel matrix, while complete medium was added to the lower compartment. After incubation for 24 to 48 hours, the cells were fixed with methanol, stained with 0.5% Giemsa stain (Perfemiker, China), and visualized and quantified under a microscope.
Statistical analysis
Statistical analyses were conducted using IBM SPSS Statistics (version 25.0) and R (version 4.2.1). The Wilcoxon rank-sum test was employed to compare EPB41L1-5 expression between KIRC and normal groups. The Wilcoxon signed-rank test was used to assess the relationship between clinical pathological parameters and EPB41L1-5 expression levels. Cox regression analysis was performed to evaluate the association of clinical pathological parameters with OS. Both univariate and multivariate Cox regression models were used to explore correlations between expression levels and clinicopathological parameters. Hazard ratios (HR) with 95% confidence intervals (CI) were calculated to assess the risk associated with individual factors. All tests were two-sided, with p values less than 0.05 considered statistically significant.
Results
Clinical characteristics
Data were collected from TCGA (Table 1, Supplementary Table S1), including gene expression and clinical information. This dataset encompasses patient characteristics such as age, TNM stage, and EPB41L1-5 gene expression.Table 1.TCGA KIRC patient characteristics.CharacteristicLow expression of EPB41L1High expression of EPB41L1pLow expression of EPB41L2High expression of EPB41L2pLow expression of EPB41L3High expression of EPB41L3pn269270 269270 269270 T stage, n (%) <0.001 0.313 0.741T1103 (19.1%)175 (32.5%) 129 (23.9%)149 (27.6%) 134 (24.9%)144 (26.7%) T248 (8.9%)23 (4.3%) 36 (6.7%)35 (6.5%) 34 (6.3%)37 (6.9%) T3108 (20%)71 (13.2%) 99 (18.4%)80 (14.8%) 95 (17.6%)84 (15.6%) T410 (1.9%)1 (0.2%) 5 (0.9%)6 (1.1%) 6 (1.1%)5 (0.9%) N stage, n (%) 0.181 1.000 0.488N0116 (45.1%)125 (48.6%) 119 (46.3%)122 (47.5%) 120 (46.7%)121 (47.1%) N111 (4.3%)5 (1.9%) 8 (3.1%)8 (3.1%) 6 (2.3%)10 (3.9%) M stage, n (%) <0.001 0.215 0.538M0199 (39.3%)229 (45.3%) 211 (41.7%)217 (42.9%) 211 (41.7%)217 (42.9%) M154 (10.7%)24 (4.7%) 45 (8.9%)33 (6.5%) 42 (8.3%)36 (7.1%) Age, median (IQR)62 (52, 71)60 (52, 69)0.15262.39 ± 12.0858.87 ± 11.87 <0.00161.81 ± 11.7359.44 ± 12.350.023
Expression status of EPB41L in KIRC
The Wilcoxon rank-sum test revealed that EPB41L1-5 expression in KIRC tissue was markedly lower compared to normal tissue (p < .001) (Figure 1(A–F)). This substantial downregulation of EPB41L1-5 in KIRC indicates its potential role in KIRC development (p < .001). A significant correlation was observed between the gene levels of EPB41L1-5 (Figure 1(G)). The AUC values for EPB41L1-5 were 0.820, 0.712, 0.694, 0.670, 0.975, and 0.976, respectively (Figure 1(H)). Figure 1.EPB41L1-5 expression levels in KIRC from TCGA data. (A-F) the expression levels of EPB41L1-5 in KIRC and normal tissue, their expression is generally high in normal tissues (G) Receiver operating characteristic analysis (ROC) of EPB41L1-5 in KIRC. (H) the correlation between EPB41L1-5 members. *p < .05, **p < .01, ***p < .001.:This figure illustrates the expression levels of various genes across different time points. It comprehensively displays the trends and specific numerical values of gene expression for multiple genes, including EPB41L1, EPB41L2, and others, across four time periods denoted as T1, T2, T3, and T4. The data is presented in a combination of box plots and scatter plots, providing a visual representation of the changes in gene expression. The box plots indicate the distribution of expression levels, highlighting the median, quartiles, and potential outliers for each gene at each time point. The scatter plots, on the other hand, show individual data points, allowing for a more granular view of the expression levels. Additionally, the figure includes AUC values for some of the genes, which are indicators of the diagnostic accuracy of the gene expression levels in distinguishing between different conditions or stages. The AUC values range from 0.670 to 0.976, suggesting varying degrees of diagnostic performance among the genes. Furthermore, the figure incorporates correlation coefficients between gene expression levels and other variables, indicated by ‘Correlation’ labels alongside specific p-values (e.g., p<0.05, p<0.01), which provide statistical significance for the observed correlations. The bottom part of the figure presents a ROC curve-like illustration, suggesting the performance of the genes in terms of sensitivity and specificity.
Association between EPB41L and survival
We have observed that patients with low expression levels of EPB41L1-5 exhibit significantly lower OS compared to those with high expression levels (Figure 2(A–F), Figure S1, S2). We then used a univariate Cox regression model to evaluate prognostic factors in KIRC (Table 2, Supplementary Table S2). This analysis showed that lower EPB41L expression levels were linked to reduced OS. Following this, a multivariate Cox regression analysis was performed, which revealed that clinical T stage was independently associated with OS. Figure 2.The prognostic value of EPB41L1-5 expression in KIRC. (A–F) survival curves of OS from TCGA data.:This survival analysis graph illustrates the trends in expression levels over time for six genes, namely EPB41L1, EPB41L2, EPB41L3, EPB41L4A, EPB41L4B, and EPB41L5. The graph is divided into sections, each dedicated to a specific gene, displaying its expression levels categorized as high (depicted by red lines) and low (depicted by black lines). For each gene, the graph plots the expression levels against time, measured in months, spanning up to 150 months. Alongside the expression lines, key statistical metrics are provided: the Hazard Ratio (HR) with its corresponding 95% confidence interval in parentheses, and the logrank P-value.Table 2.Univariate and multivariate Cox regression model of prognosis for EPB41L1-3 in patients with KIRC.CharacteristicsTotal(N)Univariate analysisMultivariate analysisHazard ratio (95% CI)P valueHazard ratio (95% CI)P valueGender541 Female187Reference Male3540.924 (0.679 - 1.257)0.613 Race534 Asian&Black or African American65Reference White4691.233 (0.685 - 2.221)0.485 Age541 ≤60269Reference Reference > 602721.791 (1.319 - 2.432)** <0.0011.583 (1.032 - 2.428)0.036Pathologic T stage541 T1&T2350Reference Reference T3&T41913.210 (2.373 - 4.342) <0.0011.582 (0.694 - 3.606)0.275Pathologic N stage258 N0242Reference Reference N1163.422 (1.817 - 6.446) <0.0011.495 (0.740 - 3.017)0.262Pathologic M stage508 M0429Reference Reference M1794.401 (3.226 - 6.002) <0.0012.711 (1.600 - 4.594) <0.001Pathologic stage538 Stage I&Stage II332Reference Reference Stage III&Stage IV2063.910 (2.852 - 5.360) <0.0011.161 (0.460 - 2.934)0.752Histologic grade533 G1&G2250Reference Reference G3&G42832.665 (1.898 - 3.743) <0.0011.620 (0.990 - 2.652)0.055EPB41L1541 Low270Reference Reference High2710.420 (0.304 - 0.578) <0.0010.551 (0.352 - 0.861)0.009Gender541 Female187Reference Male3540.924 (0.679 - 1.257)0.613 Race534 Asian&Black or African American65Reference White4691.233 (0.685 - 2.221)0.485 Age541 ≤60269Reference Reference > 602721.791 (1.319 - 2.432) <0.0011.580 (1.027 - 2.429)0.037Pathologic T stage541 T1&T2350Reference Reference T3&T41913.210 (2.373 - 4.342) <0.0011.619 (0.710 - 3.693)0.252Pathologic N stage258 N0242Reference Reference N1163.422 (1.817 - 6.446) <0.0011.503 (0.741 - 3.049)0.259Pathologic M stage508 M0429Reference Reference M1794.401 (3.226 - 6.002) <0.0012.867 (1.682 - 4.887) <0.001Pathologic stage538 Stage I&Stage II332Reference Reference Stage III&Stage IV2063.910 (2.852 - 5.360) <0.0011.226 (0.480 - 3.129)0.670Histologic grade533 G1&G2250Reference Reference G3&G42832.665 (1.898 - 3.743) <0.0011.731 (1.059 - 2.829)0.029EPB41L2541 Low270Reference Reference High2710.592 (0.434 - 0.807) <0.0010.564 (0.367 - 0.868)0.009Gender541 Female187Reference Male3540.924 (0.679 - 1.257)0.613 Race534 Asian&Black or African American65Reference White4691.233 (0.685 - 2.221)0.485 Age541 ≤60269Reference Reference > 602721.791 (1.319 - 2.432) <0.0011.592 (1.034 - 2.452)0.035Pathologic T stage541 T1&T2350Reference Reference T3&T41913.210 (2.373 - 4.342) <0.0011.823 (0.785 - 4.234)0.162Pathologic N stage258 N0242Reference Reference N1163.422 (1.817 - 6.446) <0.0011.683 (0.833 - 3.397)0.147Pathologic M stage508 M0429Reference Reference M1794.401 (3.226 - 6.002) <0.0012.886 (1.679 - 4.960) <0.001Pathologic stage538 Stage I&Stage II332Reference Reference Stage III&Stage IV2063.910 (2.852 - 5.360) <0.0011.017 (0.389 - 2.662)0.972Histologic grade533 G1&G2250Reference Reference G3&G42832.665 (1.898 - 3.743) <0.001**1.589 (0.970 - 2.603)0.066EPB41L3541 Low270Reference Reference High2710.679 (0.503 - 0.916)0.0110.645 (0.419 - 0.993)0.046The p-value of the bold indicator is less than 0.05, indicating statistical significance.
Constructing a prognostic model integrating EPB41L and clinical pathological factors
A nomogram was developed that incorporates EPB41L1-5 expression along with independent clinical risk factors, including age and TNM stage (Figure 3(A–F)). Higher total points on the nomogram were associated with a worse prognosis. Figure 3.Nomogram for predicting 1-, 3-, and 5-year overall survival probabilities in KIRC patients. (A–F) This nomogram integrates EPB41L1-5 expression with additional prognostic factors derived from TCGA data.:This image presents a comprehensive set of six nomograms, each tailored to estimate the survival probabilities for cancer patients, incorporating various clinical and biological factors. Nomograms consider Age, T stage, N stage, M stage, and the biomarker EPB41L1-5. It provides linear predictors for 1-year, 3-year, and 5-year survival probabilities, with EPB41L1- categorized into ‘Low’ and ‘High’ ranges. Each nomogram operates on a point system, assigning points to specific values of the clinical and biological factors. These points are then used to locate a position on the nomogram, from which the corresponding survival probabilities can be read off the scales provided below the points axis.
EPB41L-related functional enrichment analysis
Gene enrichment analysis using GO identified a range of overrepresented terms across three primary functional categories: cellular component, biological process, and molecular function (Figure 4(A–F)). In the cellular component category, EPB41L and genes with similar expression patterns were primarily associated with the RHO GTPase cycle, mRNA metabolic processes, and membrane trafficking. Figure 5(A–F) presents an interactive network of the most significantly enriched terms. Additionally, KEGG functional enrichment analysis was performed using the clusterProfiler program, as shown in Figure 6(A–F). Figure 4.Functional Enrichment Analysis of EPB41L1-5 in KIRC. (A–F) Gene Ontology (GO) enrichment analysis and associated coexpression genes in Metascape. The GO terms are color-coded by p-value, with terms featuring a higher number of genes typically showing more significant p-values.:This figure presents a comprehensive visualization of six bar charts, each representing distinct biological processes. These processes encompass various cellular and molecular mechanisms, such as membrane trafficking, chromatin organization, adaptive immune system responses, and more. Each bar within these charts is annotated with specific gene or protein identifiers. These identifiers reflect the involvement and significance of the respective genes or proteins within the designated biological processes. The height of each bar serves as a highly intuitive metric, illustrating the relative importance or abundance of these genetic or proteomic contributions across the various processes. Figure 5.Interactive Network of Top Enrichment Terms. (A–F) the network is color-coded by cluster ID, with different colors representing various enrichment pathways associated with EPB41L1-5 correlated genes.:This diagram illustrates the complex interplay of various cellular biological processes of EPBL-5, encompassing the immune system, cell cycle, signal transduction, and numerous other pivotal pathways. The nodes depicted in the diagram represent distinct biological processes, such as “Cell Cycle,” “Adaptive Immune System,” and many more, interconnected through an elaborate network of lines. Each of these nodes is meticulously labeled with descriptive text, highlighting the specific names of the processes involved. Figure 6.KEGG Enrichment Analysis for EPB41L1-5. (A–F) the plots illustrate the results of gene set enrichment analysis.:This figure illustrates the gene expression ratios across various biological processes of EPB41L1-5, such as Systemic Lupus Erythematosus (SLE), alcohol metabolism, oxidative phosphorylation, estrogen signaling pathway, and more. Each process is represented by distinct colored dots, providing a visual representation of their relative gene expression levels. The gene expression ratios are clearly annotated alongside the respective processes with a significant p-adjusted value, indicating its statistical relevance.
EPB41L -related signaling pathways obtained by GSEA
To better understand the biological pathways associated with KIRC and their relationship with EPB41L expression levels, we compared RNA sequencing data from TCGA between high and low EPB41L1-5 expression groups. Through GSEA analysis of all differentially expressed genes, we identified several important signaling pathways related to EPB41L1-5, including extracellular matrix regulators, olfactory transduction, cytokine cytokine receptor interaction, core matrisome, and G-protein-coupled receptor ligand binding (Figure 7(A–F)). Figure 7.Functional Pathways of EPB41L1-5 in KIRC. (A–F) These panels depict pathways enriched in KIRC associated with EPB41L1-5.:This figure integrates six subgraphs, each presenting the enrichment scores of various gene sets across a ranked list derived from an ordered dataset. The subgraphs, labeled A through F, correspond to distinct biological themes or disease processes, including KEGG Estrogen Signaling Pathway, KEGG Huntington’s Disease, REACTOME Olfactory Transduction, KEGG Cytokine-Cytokine Receptor Interaction, KEGG Calcium Signaling Pathway, and REACTOME P-Alpha Signaling. Each subgraph displays the enrichment score (Y-axis) against the rank of genes in the ordered dataset (X-axis). The blue line in each graph represents the mean enrichment score, while the gray bars beneath it indicate the specific genes ranked in order.
Genetic variations in EPB41L and their impact on OS
We conducted an analysis of genetic modifications in EPB41L1-5 and their correlation with OS in KIRC. Figure 8(A,B) demonstrate a high incidence of EPB41L1-5 mutations in KIRC patients. The specific mutation rates for the six loci were 1.1%, 2%, 1.1%, 1.5%, 0.6%, and 10%, respectively. Although there is a higher likelihood of genetic mutations in EPB41L1-5, the association with OS in KIRC patients is limited. Figure 8.Genetic Alterations of EPB41L1-5 in KIRC. (A-B) This figure illustrates the genetic variations in EPB41L1-5 and their correlation with overall survival in KIRC patients.:The top section displays genetic variations. Green bars highlight regions of significance, marking specific genetic features or alterations. Below these bars, textual information could represent the genetic code or sequences pertinent to the study. In the middle section, various genes are listed, including EPB41L1, EPB41L2, EPB41L3, EPB41L4, and EPB41L5. Each gene is represented by a bar chart, where different colors indicate various types of genetic alterations or expressions. These colors, such as red, grey, and blue, correspond to different genetic attributes like histone modification (H3K27ac), RNA expression, and DNA methylation, respectively. The bars vary in length, reflecting the proportion of samples profiled for mutations, protein expression z-scores (RPPA), putative copy-number alterations, and mRNA expression z-scores relative to diploid samples. The bottom section provides summary statistics and checkboxes indicating whether specific data points or features are included in the analysis. It highlights the percentage of samples profiled for each genetic aspect. To the right, a survival analysis graph is depicted. This graph shows the relationship between survival duration and patient status, with the x-axis representing “Overall Survival (Months)” and the y-axis representing “Percentage Survived.” The log-rank test p-value of 0.17 suggests a statistical analysis of the difference between these groups, though it doesn’t reach traditional significance levels.
The relationship between EPB41L expression and immune cell infiltration
As shown in Figure 9(A–F) and Supplementary Table S3, there is a significant negative correlation between T cell infiltration and EPB41L1-5 expression. Additionally, in other subgroups, a correlation was observed between EPB41L expression and the counts of B cells, eosinophils, neutrophils, NK cells, Th1 cells, and Th2 cells. Figure 9.Correlation Between EPB41L1-5 Expression and Immune Infiltration in the KIRC Microenvironment. (A–F) the forest plot depicts the relationship between EPB41L1-5 expression levels and the infiltration of various immune cell subpopulations within the KIRC tumor microenvironment.:The figure shows the immune cell infiltration map, labeled A to F, and each figure depicts various cell types, such as NK cd56dim and NK cd56bright. These graphs use red and blue dots to indicate the correlation degree of different cells, the horizontal axis indicates the correlation, and the vertical axis indicates the p value. In each figure, cell types and their corresponding correlation values are clearly annotated, providing a visual representation of the correlation and statistical significance between different cell types.
Relationship between EPB41L methylation level and prognosis
According to the MethSurv analysis, EPB41L methylation levels were generally elevated in KIRC (Figures 10(A-F)). We evaluated the impact of methylation levels and EPB41L expression on the prognosis of KIRC and found that increased methylation levels were associated with poor prognosis in KIRC patients. Notably, high methylation levels at four CpG island sites (cg06459104, cg01802485, cg13531977, and cg08693792) were significantly correlated with adverse prognosis (as shown in Figures 11(A–D)). Figure 10.Methylation Patterns of EPB41L1-5 in KIRC. (A–F) Visualization of the relationship between EPB41L1-5 methylation levels and its expression.:This image displays six heatmaps, each representing DNA methylation patterns across distinct samples or groups of samples. The colors range from blue, indicating low methylation, to red, signifying high methylation. Each heatmap features a color scale on the right, providing a visual reference for the methylation values. This scale is complemented by a legend that offers additional details such as sample names, gene symbols, and other pertinent annotations. On the right side of each heatmap, there is a list of genes, with their positions along the genome marked on the x-axis. This allows researchers to pinpoint specific genes and analyze their methylation patterns. The vertical axis of the heatmaps represents the genomic position, while the horizontal axis displays the genes and their corresponding methylation data. Figure 11.(A–D) Kaplan-Meier survival analysis based on the promoter methylation of EPB41L3-5.:This survival analysis plot shows four Kaplan Meier curves, each of which illustrates the survival probability of patients with different specific gene expression levels over time: epb41l3, epb41l4a, epb41l4b, and epb41l5. For each gene, the graph compares survival outcomes between two groups: the hypomethylated group (depicted by the blue curve) and the hypermethylated group (depicted by the red curve). The x-axis represents the survival time in days, ranging from 0 to 4000 days. Statistical significance was assessed using the log rank (LR) test p value and hazard ratio (HR), which are provided for each comparison. P values represent the probability of observing differences between curves due to chance alone. Lower P values (e.g., 0.003, 0.0011, 8.6e-05) indicate that there is stronger evidence against the null hypothesis that there is no difference in survival between the two groups. On the other hand, HR quantified the relative risk of the hypermethylated group compared with the hypomethylated group. HR greater than 1 indicates a higher risk in the high expression group.
Reduced EPB41L expression in KIRC tissues and cell lines
In the TCGA database, we have observed that the expression of EPB41L2 in KIRC tissue differs from that of other proteins in its family, as well as in normal tissue. However, the survival analysis trend remains consistent. To investigate this phenomenon, we conducted a series of experiments to validate the biological characteristics of EPB41L2 in KIRC. We obtained 47 pairs of tumor and adjacent tissues from KIRC patients for qRT-PCR validation. The research findings indicate a significant reduction in mRNA expression levels of all EPB41L genes, including EPB41L2, in tumor tissues (Figure 12). We further corroborated this discovery in renal cancer cell lines, where EPB41L2 mRNA was found to be low expressed in all renal cancer cell lines as compared to HK-2 (Figure 13(A)). The primer sequences employed have been presented in Table 3. Figure 12.The expression of EPB41L mRNA levels in KIRC tissue and adjacent non-cancerous tissue is being investigated. (A–F) the mRNA expression levels of EPB41L1-5 are being compared in 47 clinical KIRC and adjacent non-cancerous tissue samples. ***p < .001.:We obtained 47 pairs of tumor and adjacent tissues from KIRC patients for qRT-PCR validation. The expression results of epb41l1-5 in renal cell carcinoma tissues and adjacent tissues were expressed by statistical graphs. The research findings indicate a significant reduction in mRNA expression levels of all EPB41L1- 5 genes in tumor tissues. Figure 13.mRNA and protein expression levels of EPB41L2 in KIRC cell lines and tissues. (A) mRNA expression levels of EPB41L2 in KIRC cell lines. (B) EPB41L2 protein expression in KIRC tissues compared to normal renal tubular epithelial tissues. (C) Comparison of EPB41L2 expression between cancerous and adjacent non-cancerous tissues. *p < .05.:QPCR was performed in renal cancer cell lines 786-o, 769-p, ACHN, caki-2, and A498, and the results were shown by bar graphs. Compared with HK-2, EPB41L2 mRNA was lowly expressed in all renal cancer cell lines. Immunohistochemical staining was performed on kirc tissues and corresponding normal tissues. The staining was mainly located in the cytoplasm, and the expression of EPB41L2 was significantly reduced in kirc tissues compared with normal tissues.Table 3.Sequence of gene-specific primers for qPCR.GeneForward sequence (5’− 3’)Reverse sequence (5’− 3’)EPB41L1AGGAAACCACGCCGAGACACAAGGTGGATGAGTTTGCTGTTGGGEPB41L2GTAAACGGGTCTCCAGGAGTCTACCACGGCAATGCTGACAAGTCEPB41L3ACCATGTCTCGCAGCTTGGATGCTCCGTTTGTCCTCTTCCTCGTEPB41L4ACGAAGTTACCGCCAGTATCGCACAGAACCCTGAGCATCCGAAGAEPB41L4BGCAGTTGAGCACCACGCATTCTCCTCTCAAAGGTGCTGGTTCTTCEPB41L5TCCTGTGCCAGTGGAGATAGAGCGTTGCTTCCAATAAGTCTGGGCGAPDHGTCTCCTCTGACTTCAACAGCGACCACCCTGTTGCTGTAGCCAA
EPB41L2 protein levels in KIRC tissue samples
To confirm the differential expression of EPB41L2 at the protein level, immunohistochemical staining was conducted on KIRC tissues and corresponding normal tissues. Figure 13(B) illustrates that the staining was primarily located in the cellular cytoplasm, with EPB41L2 expression notably reduced in KIRC tissues compared to normal tissues (Figure 13(C)).
EPB41L2 expression levels in KIRC cells and construction of stable cell lines
Using lentiviral transfection, this study established stable overexpression of EPB41L2 in KIRC cell lines ACHN and 769-P, as well as their corresponding control cell lines, named ACHN-EPB41L2, ACHN-NC, 769-P-EPB41L2, and 769-P-NC. After 72 hours of lentiviral transfection, the GFP fluorescence was observed under a fluorescence microscope, and the results showed that the transfection efficiency of the cells was approximately 80%, with normal cell morphology (Figure 14(A)). To validate the overexpression and knockdown efficiency of EPB41L2 in KIRC cell lines, this study extracted mRNA and protein from four groups of cells. The experimental results of qRT-PCR and Western blotting showed significant upregulation of EPB41L2 mRNA and protein in KIRC cell lines ACHN and 769-P after lentiviral transfection, with statistically significant differences (Figure 14(B-C)). These findings can be utilized for subsequent cellular functional experiments. Figure 14.Lentiviral transfection of EPB41L2 in renal clear cell carcinoma cell lines and in vitro cell experiments. (A) the fluorescence transfection status of ACHN and 769-P KIRC cell lines after lentiviral transfection of EPB41L2 was observed for 72 hours. (B-C) After transduction with lentivirus overexpressing EPB41L2, the mRNA and protein expression levels of EPB41L2 in ACHN and 769-P were significantly elevated. (D) the proliferation of ACHN and 769-P cells was assessed by CCK-8 assay following overexpression of EPB41L2. (E) Scratch assay was performed to evaluate the migration of ACHN and 769-P cells overexpressing EPB41L2 for 12 hours. (F) Transwell invasion assay was conducted to investigate the alteration in invasive potential of ACHN and 769-P cells overexpressing EPB41L2. *p < .05, **p < .01, ***p < .001.:Stable overexpression of EPB41L2 was established in the KIRC cell lines ACHN and 769-P, as well as their corresponding control cell lines ACHN-EPB41L2, ACHN-NC, 769-P-EPB41L2, and 769-P-NC, using lentiviral transfection. At 72 hours post-lentiviral transfection, GFP fluorescence was observed under a fluorescence microscope, indicating a transfection efficiency of approximately 80% with normal cell morphology. Experimental results from qRT-PCR and Western blotting demonstrated that EPB41L2 mRNA and protein were significantly upregulated in the KIRC cell lines ACHN and 769-P after lentiviral transfection, with statistically significant differences. Functional experiments were conducted on the stable overexpression of EPB41L2 in KIRC cells ACHN and 769-P. Cell proliferation was assessed at 0h, 24h, 48h, and 72h using the CCK-8 method. The results showed that the absorbance of ACHN-EPB41L2 and 769-P-EPB41L2 cells was weaker than that of the negative control group at 48h and 72h, with statistically significant differences. Wound healing assays revealed that the migration rate of KIRC cell lines ACHN-EPB41L2 and 769-P-EPB41L2 overexpressing EPB41L2 was significantly reduced at 12h compared to the negative control group, with statistically significant differences. Results from the Transwell invasion assay demonstrated that the number of KIRC cells ACHN-EPB41L2 and 769-P-EPB41L2 overexpressing EPB41L2 that penetrated the basement membrane of the chamber was lower compared to the negative control group.
EPB41L2 overexpression inhibits KIRC cell proliferation, migration, and invasion
This study conducted functional experiments on stable overexpression of EPB41L2 in KIRC cells ACHN and 769-P. The CCK-8 assay was used to detect cell proliferation at 0 h, 24 h, 48 h, and 72 h. The results showed that the absorbance of ACHN-EPB41L2 and 769-P-EPB41L2 cells at 48 h and 72 h was weaker than that of the negative control group, with statistically significant differences. This indicates that overexpression of EPB41L2 can significantly inhibit the proliferation ability of KIRC cells (Figure 14(E)). The scratch assay and Transwell invasion assay are effective methods for detecting cell migration and invasion ability. The scratch assay showed that compared with the negative control group, the migration rate of KIRC cell lines ACHN-EPB41L2 and 769-P-EPB41L2 overexpressing EPB41L2 was significantly reduced at 12 h, with statistically significant differences, suggesting that overexpression of EPB41L2 can inhibit the migration ability of KIRC cells (Figure 14(D)). Meanwhile, the results of the Transwell invasion assay showed that compared with the negative control group, the number of KIRC cells ACHN-EPB41L2 and 769-P-EPB41L2 overexpressing EPB41L2 that penetrated the basement membrane of the small chamber was lower, indicating that overexpression of EPB41L2 can inhibit the invasion ability of KIRC cells (Figure 14(F)).
Discussion
The pathogenesis of KIRC remains incompletely understood. Currently, the main therapeutic targets for KIRC are inhibitors of vascular endothelial growth factor (VEGF) and its receptor (VEGFR), such as sunitinib and sorafenib [25,26]. However, these treatment modalities are limited by issues such as unstable efficacy and drug resistance [27]. Therefore, elucidating novel molecular mechanisms underlying KIRC is of critical importance for advancing therapeutic strategies. First, such insights will deepen our understanding of KIRC pathobiology and provide improved guidance for treatment decision-making. Second, the identification of innovative therapeutic targets may more effectively inhibit tumor growth and metastasis, thereby improving patient outcomes. Furthermore, the discovery of novel therapeutic targets has the potential to overcome the limitations of current treatment modalities.
EPB41L is a tumor suppressor gene that exhibits decreased expression or inactivation in various types of tumors [28–31]. Previous research indicates that EPB41L suppresses tumor cell proliferation and invasion through several mechanisms, including: Firstly, EPB41L can suppress the cell cycle progression, leading to cell cycle arrest at G1 phase and thus inhibiting cell proliferation [32]. Secondly, it can regulate multiple signaling pathways, such as Wnt, PI3K/Akt, and MAPK, affecting cell proliferation, apoptosis, migration, and invasion [33,34]. Thirdly, it can promote cell apoptosis, thereby inhibiting tumor cell proliferation [35]. Fourthly, EPB41L can modulate the cell cytoskeleton, affecting cell morphology and movement, and consequently influencing cell migration and invasion [29].
Our findings demonstrate that EPB41L expression is downregulated in KIRC tissues, supporting its potential involvement in KIRC pathogenesis. Key terms identified through GO enrichment analysis, including Rho GTPase activity, mRNA biosynthetic processes, cell cycle regulation, and mitotic events, suggest an association between EPB41L and aberrant cellular proliferation, cell division, and transcriptional regulation. Notably, Rho GTPases regulate multiple aspects of tumor cell behavior, including cytoskeletal dynamics, cell adhesion, and cell cycle progression, further implicating their role in tumor development [36]. Through cytoskeletal and RHO-GTPase – linked programs, EPB41L may influence chemokine secretion, receptor signaling, and extracellular-matrix architecture, thereby tuning CXCL9/10/11–CXCR3–mediated CD8 T-cell recruitment versus CXCL8–CXCR1/2–driven neutrophil and angiogenic programs, and CCL2/CCL5–CCR2/CCR5–mediated monocyte/Treg trafficking [37]. These shifts can alter Th1/Th2 balance and shape responsiveness to immune checkpoint inhibitors. GSEA revealed that EPB41L is involved in extracellular matrix regulation, cytokine-receptor interactions, and G-protein-coupled receptor ligand binding. EPB41L may exert its effects on tumorigenesis and disease progression through these pathways, ultimately influencing patient prognosis. Using nomogram analysis, we identified significant associations between age, TNM stage, and EPB41L expression with 1-, 3-, and 5-year overall survival probabilities in patients with KIRC. This model enables the generation of individualized prognostic scores for each patient, thereby enhancing the accuracy of survival prediction.
Immunotherapy represents a promising strategy for cancer treatment. The extent of T cell immune infiltration is closely linked to the effectiveness of immunotherapy, making it a focal point in current cancer immunotherapy research [38]. Th1 and Th2 are two distinct subtypes of T cells, each with a different role in tumors [39]. Th1 cells primarily secrete interferon-gamma (IFN-γ) and interleukin-2 (IL-2), which promote the activation and proliferation of immune effector cells, enhance T cell-mediated cytotoxicity, and inhibit tumor growth and metastasis. Conversely, Th2 cells predominantly produce IL-4, IL-5, and IL-13, which facilitate tumor cell survival and metastatic dissemination while attenuating T cell cytotoxic function, thereby promoting tumor progression. The Th1/Th2 balance plays a pivotal role in immune surveillance and tumor clearance [40–42]. In patients with KIRC, the ratio of Th1/Th2 cells in peripheral blood is significantly decreased, while the number of Th2 cells is significantly increased [43,44]. Studies have shown that the more severe the imbalance in Th1/Th2 cell ratio, the worse the prognosis of KIRC [45]. We observed that EPB41L15 expression associates with diverse immune infiltrates (T cells, B cells, NK cells, monocytes/macrophages, eosinophils, neutrophils), and Tcell infiltration is a determinant of immunotherapy benefit in KIRC. Together with the Th1/Th2 imbalance reported in KIRC, these data suggest that EPB41L may modulate immune contexture relevant to immune checkpoint inhibitors response.
Multiple studies have demonstrated a clear interaction between methylation and gene expression in renal cell carcinoma [46,47]. McRonald et al. have highlighted the abundance of DNA methylation in clear cell renal cell carcinoma, with these methylation sites primarily located in gene promoter regions and CpG islands [48]. The presence of these methylation sites can result in gene silencing or downregulation, thereby impacting tumor initiation and progression. For instance, the promoter region of the VHL gene contains a large number of methylation sites, resulting in downregulation of VHL gene expression and promoting tumor development [48,49]. We also examined the methylation status of EPB41L1-5 and found that hypermethylation was associated with poor clinical outcomes in KIRC. These findings suggest that EPB41L expression may be regulated through epigenetic mechanisms involving DNA methylation, providing an additional prognostic biomarker for KIRC.
Besides VHL, as an established biomarker, KIM-1 shows promise for noninvasive monitoring in renal disease and is being evaluated in KIRC as a urine/serum indicator of tumor burden and treatment response, enabling longitudinal surveillance that may detect subclinical progression and complement imaging [50]. In parallel, our manuscript indicates that the EPB41L family is broadly downregulated in KIRC and carries prognostic value linked to overall survival, immune infiltration, and methylation status. Conceptually, integrating a circulating marker like KIM-1 with tissue-based EPB41L readouts could enhance patient stratification: KIM-1 for real-time disease tracking, and EPB41L signatures for baseline risk and pathway insights. Such a composite panel may refine decisions on adjuvant therapy, follow-up intensity, and eligibility for immunotherapy or epigenetic strategies, contingent on prospective validation and standardized assay thresholds.
To validate the TCGA database findings, we performed qRT-PCR and immunohistochemistry on 45 paired KIRC tumor and adjacent normal tissue samples. The results demonstrated that EPB41L2 expression was significantly downregulated at both the mRNA and protein levels in KIRC tissues compared with adjacent normal tissues. The discrepancy between our experimental results and the database analysis may be attributable to the substantial imbalance in sample sizes between normal and tumor tissues in the TCGA repository, or to differences in analytical methodologies. To further elucidate the functional role of EPB41L2 in KIRC pathogenesis, we conducted a series of in vitro cellular assays. ACHN and 769-P cell lines, which exhibit relatively low endogenous EPB41L2 expression, were selected for functional experiments. Our results demonstrated that EPB41L2 functions as a tumor suppressor in KIRC cells.
Although our study enhances the understanding of the relationship between the EPB41L family and KIRC, several limitations should be acknowledged. First, the majority of data were derived from public databases, which precluded direct assessment of data quality. Further experimental validation is warranted to confirm our findings. Second, our functional studies were limited to in vitro cellular assays examining the tumor-suppressive properties of EPB41L2; the effects of EPB41L2 on tumor growth in vivo remain to be determined using animal models. Third, the precise mechanisms by which EPB41L suppresses KIRC progression remain to be elucidated. Future studies should delineate its contextspecific effects through targeted mechanistic experiments and extend these analyses to other renal cancer subtypes.
Conclusion
In summary, EPB41L1–5 show consistent dysregulation and prognostic associations in KIRC. In vitro cytological experiments confirmed that EPB41L2 expression inhibits the malignant behavior of KIRC cells. This research offers a theoretical foundation for diagnosing, prognosticating, and selecting therapeutic targets for KIRC.
Supplementary Material
supplementary figures and tables.docx
The reference list from the paper itself. Each links out to its DOI / PubMed record.
- 1Siegel RL, Miller KD, Wagle NS, et al. Cancer statistics, 2023. CA Cancer J Clin. 2023;73(1):17–27. doi: 10.3322/caac.21763. Epub 2023/01/13. Pub Med PMID: 36633525.36633525 · doi ↗ · pubmed ↗
- 2Znaor A, Lortet-Tieulent J, Laversanne M, et al. International variations and trends in renal cell carcinoma incidence and mortality. Eur Urol. 2015;67(3):519–530. doi: 10.1016/j.eururo.2014.10.002. Epub 2014/12/03. Pub Med PMID: 25449206.25449206 · doi ↗ · pubmed ↗
- 3Barata PC, Rini BI. Treatment of renal cell carcinoma: current status and future directions. CA Cancer J Clin. 2017;67(6):507–524. doi: 10.3322/caac.21411. Epub 2017/09/30. Pub Med PMID: 28961310.28961310 · doi ↗ · pubmed ↗
- 4Conboy J, Kan YW, Shohet SB, et al. Molecular cloning of protein 4.1, a major structural element of the human erythrocyte membrane skeleton. Proc Natl Acad Sci U S A. 1986;83(24):9512–9516. doi: 10.1073/pnas.83.24.9512. Epub 1986/12/01. Pub Med PMID: 3467321; Pub Med Central PMCID: PMC 387170.3467321 PMC 387170 · doi ↗ · pubmed ↗
- 5Walensky LD, Blackshaw S, Liao D, et al. A novel neuron-enriched homolog of the erythrocyte membrane cytoskeletal protein 4.1. J Neurosci. 1999;19(15):6457–6467. doi: 10.1523/jneurosci.19-15-06457.1999. Epub 1999/07/22. Pub Med PMID: 10414974; Pub Med Central PMCID: PMC 6782826.10414974 PMC 6782826 · doi ↗ · pubmed ↗
- 6Liang T, Sang S, Shao Q, et al. Abnormal expression and prognostic significance of EPB 41L 1 in kidney renal clear cell carcinoma based on data mining. Cancer Cell Int. 2020;20(1):356. doi: 10.1186/s 12935-020-01449-8. Epub 2020/08/08. Pub Med PMID: 32760223; Pub Med Central PMCID: PMC 7393885.32760223 PMC 7393885 · doi ↗ · pubmed ↗
- 7Zeng R, Liu Y, Jiang ZJ, et al. EPB 41L 3 is a potential tumor suppressor gene and prognostic indicator in esophageal squamous cell carcinoma. Int J Oncol. 2018;52(5):1443–1454. doi: 10.3892/ijo.2018.4316. Epub 2018/03/24. Pub Med PMID: 29568917; Pub Med Central PMCID: PMC 5873871.29568917 PMC 5873871 · doi ↗ · pubmed ↗
- 8Xi C, Ren C, Hu A, et al. Defective expression of protein 4.1N is correlated to tumor progression, aggressive behaviors and chemotherapy resistance in epithelial ovarian cancer. Gynecol Oncol. 2013;131(3):764–771. doi: 10.1016/j.ygyno.2013.08.015. Epub 2013/09/03. Pub Med PMID: 23994105.23994105 · doi ↗ · pubmed ↗