The secreted redox sensor roGFP2‐Orp1 reveals oxidative dynamics in the plant apoplast
J. Ingelfinger, L. Zander, P. L. Seitz, O. Trentmann, S. Tiedemann, S. Sprunck, T. Dresselhaus, A. J. Meyer, S. J. Müller‐Schüssele

TL;DR
Researchers used a redox sensor to study how reactive oxygen species behave in the extracellular space of plants, finding differences across species and cell types.
Contribution
The study introduces roGFP2-Orp1 as a tool for monitoring extracellular redox dynamics in plants, revealing species- and cell-specific oxidative processes.
Findings
Secreted roGFP2-Orp1 can detect diffusion barriers and cysteinyl oxidation rates in the apoplast.
Re-oxidation rates in Arabidopsis thaliana were faster than in Physcomitrium patens and increased during immune responses.
Pollen tubes showed a partially reduced extracellular sensor with no intracellular redox gradient.
Abstract
Specific generation of reactive oxygen species (ROS) is important for signalling and defence in many organisms. In plants, different types of ROS serve useful biological functions in the extracellular space (apoplast), influencing polymer structures as well as signalling during immune responses. The current knowledge of apoplastic ROS dynamics is limited, as dynamic monitoring of extracellular redox processes in vivo remains difficult.We employed evolutionary distant land plant model species from bryophytes and flowering plants to test whether the genetically encoded redox biosensor roGFP2‐Orp1 can be used to assess extracellular redox dynamics.Secreted roGFP2‐Orp1 can provide information about local diffusion barriers and protein cysteinyl oxidation rate in the apoplast, after pre‐reduction. Observed re‐oxidation rates were slow – within the range of hours. Compared to Physcomitrium…
Genes, proteins, chemicals, diseases, species, mutations and cell lines named across the full text — each resolved to its canonical identifier and authoritative record.
Click any figure to enlarge with its caption.
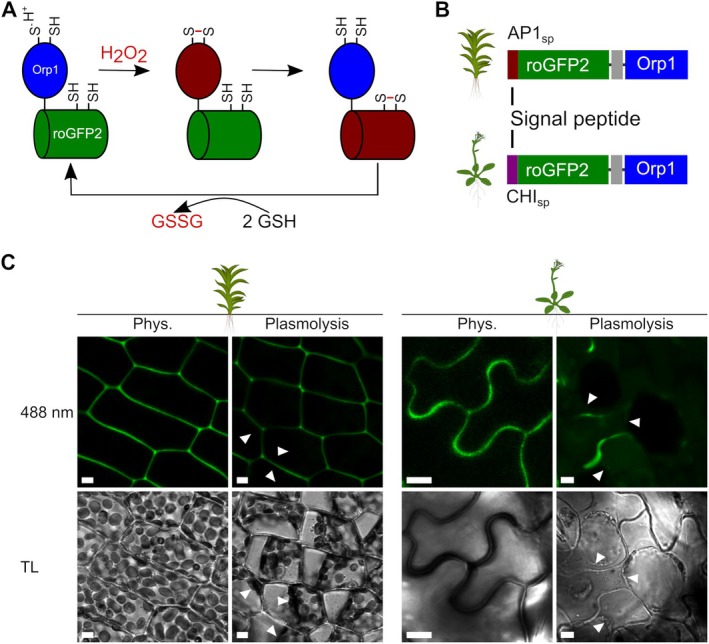 Fig. 1
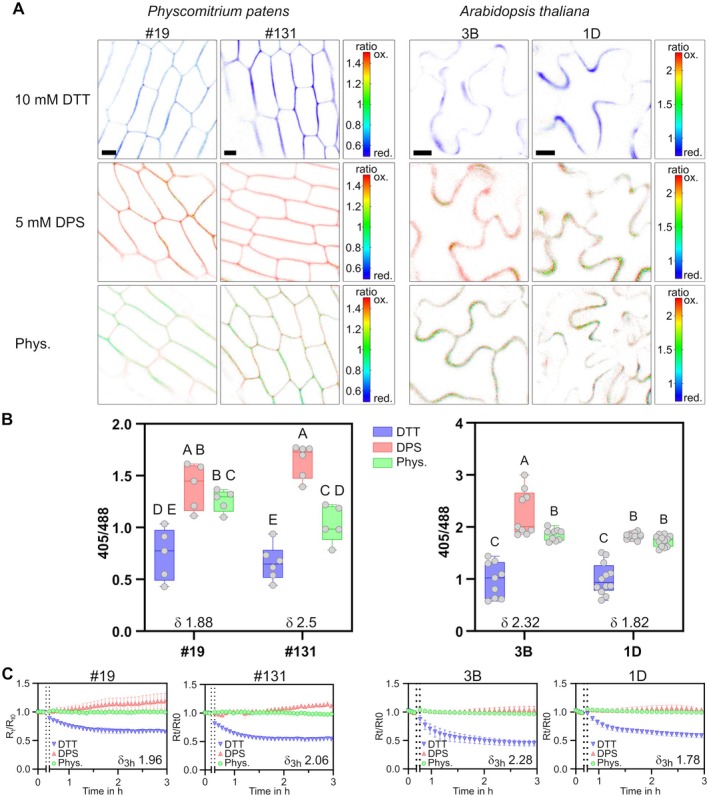 Fig. 2
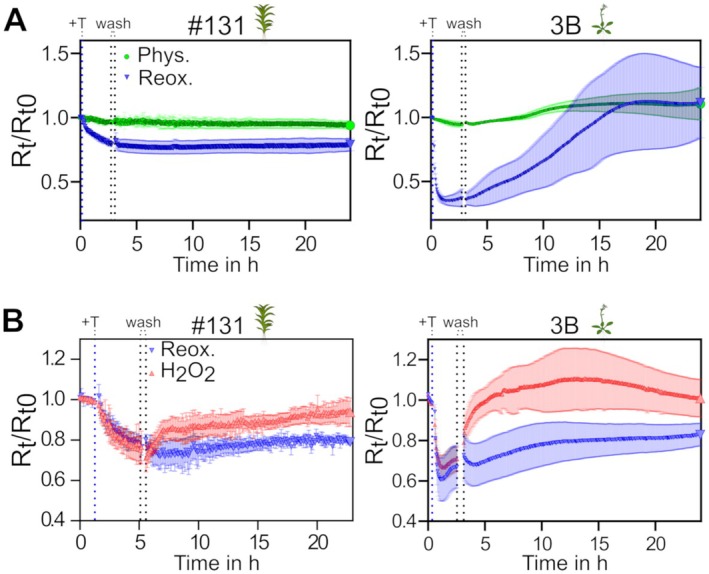 Fig. 3
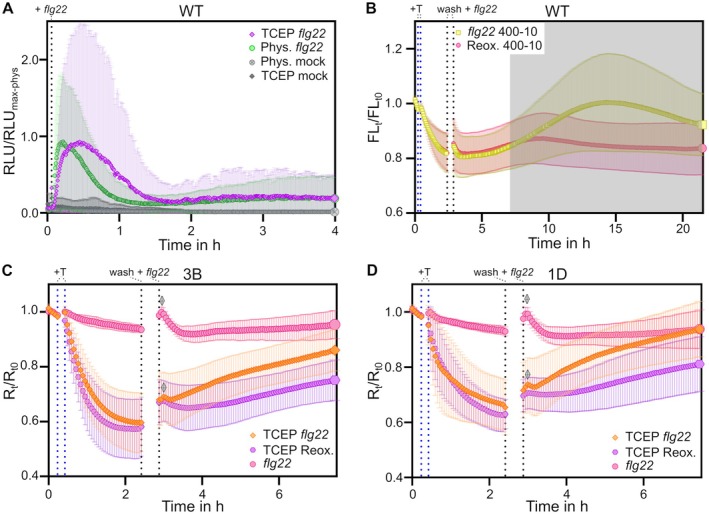 Fig. 4
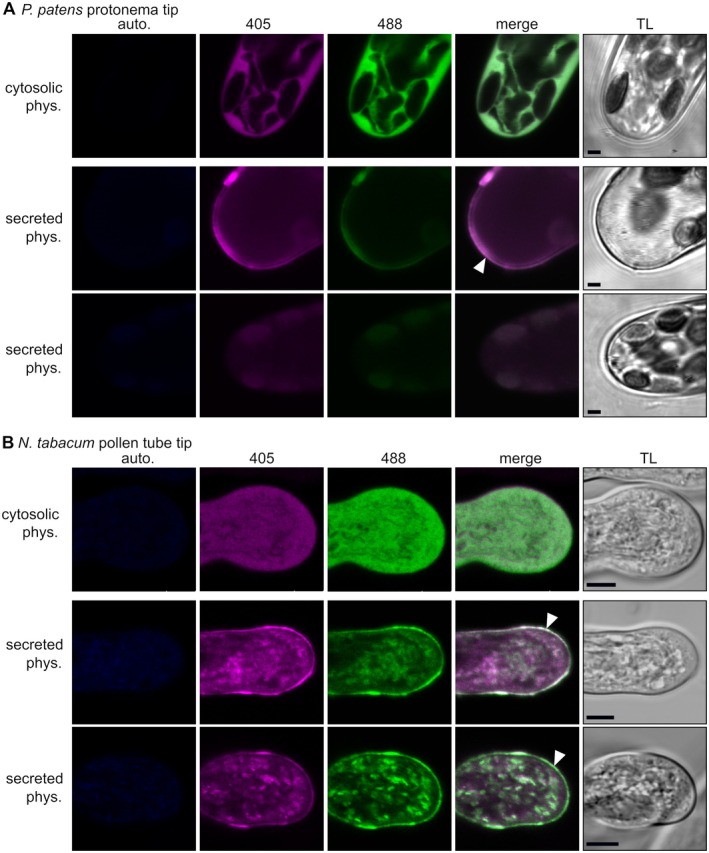 Fig. 5
- —Deutsche Forschungsgemeinschaft10.13039/501100001659
- —Biocomp 3.0
Peer Reviews
No public reviews on file for this paper yet. If you reviewed it on a platform where reviews are public (OpenReview, ICLR, NeurIPS, ICML), you can paste yours below so the community can read it here.
Videos
No videos yet. Explain this paper in a talk, walkthrough, or lecture? Add one.
Taxonomy
TopicsPlant Stress Responses and Tolerance · Photosynthetic Processes and Mechanisms · Plant Reproductive Biology
INTRODUCTION
Most intracellular compartments, such as the cytosol, plastids and mitochondria, constitute a reducing environment for exposed protein cysteinyl groups, as they contain glutathione (GSH) in the mM range as well as a glutathione disulfide reductase that keeps this pool reduced, transferring electrons from NADPH (Marty et al. 2009, 2019). In contrast, the extracellular space of plants is characterised by low concentrations of glutathione (<1% of total GSH), resulting from GSH or glutathione disulfide (GSSG) export (Ohkama‐Ohtsu et al. 2007; Zechmann 2014). GSSG is enzymatically degraded in the apoplast (Ohkama‐Ohtsu et al. 2007; Noctor et al. 2012). In addition, specific cysteinyl thiol oxidation and reduction can be mediated via the thioredoxin system (Balsera & Buchanan 2019; Yoshida & Hisabori 2023). Importantly, no thiol‐reducing systems are known for the apoplast (Meyer et al. 2021). Oxidative protein folding in the secretory pathway prepares proteins for this oxidising environment, ensuring correct formation of disulfides. Measurements of glutathione redox potential (E GSH) in the ER‐lumen using redox‐sensitive GFPs (roGFPs) revealed an E GSH of less negative than −241 mV (Birk et al. 2013; Ugalde, Aller, et al. 2022).
Although the apoplast seems to be a ‘one‐way‐street’ in terms of thiol redox biology, redox processes in the apoplast have been implicated in growth, development and reproduction, as well as signalling, stress responses and immunity: To foster cell growth, metabolites constituting building blocks for extracellular polymers, such as the cuticle and cell wall components, are exported (Renault et al. 2017). Polymer formation or loosening is induced in situ, involving oxidative processes mediated by different ROS, such as superoxide (O_2_ ^·−^), hydrogen peroxide (H_2_O_2_) and hydroxyl radical formation (Liszkay et al. 2004; Tenhaken 2015; Cosgrove 2022). Here, class III peroxidases responding with different catalytic cycles to the local H_2_O_2_/O_2_ ^·−^ balance can mediate formation of hydroxyl radicals that cause cell wall loosening (Chen & Schopfer 1999; Tenhaken 2015). Development‐ and immunity‐related cell wall signalling partially overlaps, often involving membrane‐spanning receptor‐like kinases (Wolf 2022). Extracellular O_2_ ^·−^ and H_2_O_2_ are further involved in evolutionary conserved stress‐induced long‐distance signalling (Miller et al. 2009; Fichman et al. 2023; Koselski et al. 2023) as well as immune responses. Signal amplification involves the specific formation of O_2_ ^·−^ via the transmembrane Respiratory Burst Oxidase Homologues (RBOHs), which transfer electrons from the cytosolic NADPH to extracellular oxygen. This triggers a cascade of extracellular ROS formation (Mhamdi & Van Breusegem 2018; Waszczak et al. 2018; Sies et al. 2022). After generation, O_2_ ^·−^ dismutates via enzymatic catalysis or spontaneously at low pH to form the more stable ROS, H_2_O_2_ (and O_2_). Oxidative burst signalling and RBOH function in immunity are evolutionary conserved in land plants (Lehtonen et al. 2012; Bressendorff et al. 2016; Chu et al. 2023).
Moreover, extracellular and intracellular redox dynamics can be linked (Mittler et al. 2022). Thus, extracellular ROS balance influences the plasma membrane proteome and nanodomain formation (Martinière et al. 2019). A first transmembrane redox‐responsive receptor kinase (HPCA1) involved in long distance signalling has been described (Castro et al. 2021; Fichman et al. 2022). Genetically encoded biosensors showed that an extracellular oxidative burst triggered by the application of elicitors is followed by changes of intracellular H_2_O_2_ levels. This apparent correlation suggested that H_2_O_2_ might be transported from the apoplast into the cytosol, mediated via peroxiporins and/or diffusion (Nietzel et al. 2019; Ugalde, Fecker, et al. 2022; Arnaud et al. 2023). The contribution of the cytosolic thiol‐based redox regulatory network in H_2_O_2_ detoxification and putative decoding has been further investigated using in vitro reconstitution of cytosolic redox‐active proteins (Vogelsang et al. 2024). Biosensors with high sensitivity to H_2_O_2_‐dependent oxidation, such as HyPer7 (Pak et al. 2020) and roGFP2‐Orp1 (Gutscher et al. 2009; Nietzel et al. 2019), were also employed successfully to monitor compartment‐specific changes in redox states over extended time periods in vivo (Nietzel et al. 2019; Niemeyer et al. 2021; Ugalde et al. 2021; Arnaud et al. 2023; Dopp et al. 2023). Fluorescence read‐out of roGFP2 offers high robustness to pH changes, as the protonated chromophore still emits fluorescence, in contrast to many other fluorescent proteins (Schwarzländer et al. 2008; Müller‐Schüssele et al. 2021). Redox‐responsiveness of roGFP2 is mediated by a GSH/GRX‐dependent thiol switch on the outer surface of the GFP β‐barrel structure (Hanson et al. 2004; Meyer & Dick 2010) (Fig. 1A). Oxidation rates of roGFP2 can be coupled to H_2_O_2_ levels via proteins containing peroxidatic cysteines, such as yeast Orp1 (Oxidant receptor peroxidase 1; Ma et al. 2007). This type of protein‐based redox sensor is oxidised by H_2_O_2_ and reduced via GSH (Gutscher et al. 2009; Nietzel et al. 2019) (Fig. 1A) and can be expressed in a model organism and compartment of choice. In summary, specific local changes in extracellular ROS levels are involved in immunity, signalling and extracellular polymer formation or loosening. However, it is unclear how dynamic extracellular protein cysteinyl redox states can be, and what oxidation rates are reached in vivo in different tissues and in different species. Mechanisms affecting the steady state oxidation levels of cysteine thiols in the apoplast await identification. Staining procedures for different forms of ROS support changes in ROS levels but often cannot resolve temporal or compartmentalised dynamics. Here, we investigate whether secreted roGFP2‐Orp1 can be used to sense apoplastic redox dynamics, using evolutionary distant land plant model species with different body plans and alternation of generations: the moss Physcomitrium patens and the flowering plants Arabidopsis thaliana and Nicotiana tabacum.
*Creation of stable transgenic lines expressing secreted roGFP2‐Orp1 in P. patens and A. thaliana. (A) Simplified scheme showing oxidation and reduction pathways for the redox biosensor roGFP2‐Orp1. The reduced form of Orp1 is in blue and roGFP2 in green, oxidised forms of both domains are in red. (B) Construct design, adding a suitable signal peptide for secretion to the roGFP2‐linker‐Orp1 coding sequence: CHIsp (chitinase signal peptide) for A. thaliana and AP1sp (aspartic protease 1 signal peptide) for P. patens. (C) Example confocal images of P. patens leaflets (line #131) and A. thaliana pavement cells (line 3B) stably expressing AP1
sp
‐roGFP2‐Orp1 or CHI
sp
‐roGFP2‐Orp1, respectively. Plasmolysis was induced using 0.6 M mannitol (A. thaliana) or 0.6 M NaCl (P. patens); arrowheads indicate plasma membrane. TL, transmitted light; scale bars = 5 μm.*
MATERIAL AND METHODS
Plant material and growth conditions
Physcomitrium patens (Hedw.) Bruch & Schimp ecotype ‘Gransden 2004’ (International Moss Stock Centre (IMSC, http://www.moss‐stock‐center.org), accession number 40001) was grown axenically and regularly sub‐cultured in liquid medium (Knop medium: 250 mg L^−1^ KH_2_PO_4_, 250 mg L^−1^ KCl, 250 mg L^−1^ MgSO_4_ × 7 H_2_O, 1 g L^−1^ Ca (NO_3_)2 × 4 H_2_O and 12.5 mg L^−1^ FeSO_4_ × 7 H_2_O, pH 5.8) (Reski & Abel 1985) supplemented with micro‐elements (ME) (H_3_BO_3_, MnSO_4_, ZnSO_4_, KI, Na_2_MoO_4_ × 2H_2_O, CuSO_4_, Co(NO_3_)2) (Egener et al. 2002). For experimental analyses, P. patens gametophores were grown on Knop ME agar plates (12 g L^−1^ purified agar; Oxoid, Thermo Fisher Scientific, Waltham, MA, USA). Light intensity in growth cabinets was set to 70–100 μmol photons m^−2^ s^−1^ and 16 h:8 h light/dark cycle at 23°C. To induce gametangia development, plates with 4‐week‐old colonies were transferred into a growth cabinet which was set to 30 μmol photons m^−2^ s^−1^ and 8 h:16 h light/dark cycle at 15°C for at least 2 weeks.
Arabidopsis thaliana ecotype Columbia 0 (Col‐0) was used as wild‐type (WT) background. Seeds were sown directly on potting soil (ED73 (Patzer Erden) with 17.6% (v/v) sand) and stratified in the dark for 48 h at 4°C. Afterwards they were transferred to a plant growth chamber (Fitotron SGC2, Weiss Technik) with light intensity set to 130 μmol photons m^−2^ s^−1^ and 8 h:16 h light/dark cycle at 23°C. After 2 weeks, seedlings were separated with fine forceps, so that only one seedling per pot remained. Four to 6 weeks after separation, the plants were used for experiments.
Nicotiana tabacum cv. Petite Havana SR1 plants and N. benthamiana were grown in a greenhouse under controlled conditions, with a light period of 15 h at 28°C and a dark period for 9 h at 22°C. Humidity in the chamber was held between 65% and 70%. Anthers from N. tabacum were harvested from freshly opened flowers and kept at −80°C until biolistic transformation. Two‐week‐old N. benthamiana seedlings were transplanted into individual pots and used to infiltrate agrobacteria into nearly mature leaves at 4–6 weeks of age.
Cloning and transient transformation
Both constructs for secreted roGFP2‐Orp1 were generated using the GATEWAY™ cloning technology (Invitrogen; Thermo Fisher Scientific). For P. patens, the endogenous aspartic protease 1 signal peptide (AP1 _ sp _, M1‐R28 of Pp3c5_19520V3.1; Schaaf et al. 2004) and for A. thaliana the endogenous chitinase signal peptide (CHI _ sp _, M1‐A23 of AT3G12500.1; Haseloff et al. 1997; Meyer et al. 2007; Ugalde, Aller, et al. 2022) were amplified using PCR (Phusion™ High Fidelity DNA Polymerase, Thermo Fisher Scientific): The AP1 _ sp _ was amplified, adding an attB1 site and an overlap to roGFP2 using the primer B1_AP1sp_F GGGGACAAGTTTGTACAAAAAAGCAGGCTTAatgggggcatcgaggagt and AP1sp_ro2Orp_P2 GCCCTTGCTCACCATgcgagggcttgcctcagc. RoGFP2‐Orp1 was amplified, adding an attB2 site and overlap to the AP1 _ sp _ with the primer AP1sp_ro2Orp_P3 gaggcaagccctcgcATGGTGAGCAAGGGCGAG and B2_ro2_R: GGGGACCACTTTGTACAAGAAAGCTGGGTCTATTCCACCTCTTTCAAAAGTTCT. The fragments were fused in an overlap PCR using the primers B1_AP1sp_F and B2_ro2_R. The resulting AP1 _ sp _ ‐roGFP2‐Orp1 fragment was cloned into pDONR207 via BP reaction (BP Clonase™II Enzyme Mix, Thermo Fisher Scientific). After sequencing, a positive clone was used for LR reaction (LR Clonase™II Enzyme Mix; Thermo Fisher Scientific) into PTA2Act5GW (Bohle, Rossi, et al. 2024), creating a plant expression construct under control of the P. patens Actin 5 promoter (Weise et al. 2006). To generate the P. patens expression vector for cytosolic roGFP2‐Orp1, pENTR207L1L2‐roGFP2‐Orp1 (Nietzel et al. 2019) was used in an LR reaction (LR Clonase™II Enzyme Mix; Thermo Fisher Scientific) into PTA2Act5GW (Bohle, Rossi, et al. 2024).
In accordance, the CHI _ sp _ was amplified, adding an attB1 site and an overlap to roGFP2 using the following primers B1_CHIsp_F: GGGGACAAGTTTGTACAAAAAAGCAGGCTTAatgaagactaatctttttctctttc and CHIsp_ro2_P2 CTCGCCCTTGCTCACggcgaattcggccgagga. The RoGFP2‐Orp1 was amplified, adding an attB2 site and overlap to the CHI _ sp _, using the primers P3_CHIsp_ro2_F: tcggccgaattcgccGTGAGCAAGGGCGAGGAG and B2_ro2(Orp1)R: GGGGACCACTTTGTACAAGAAAGCTGGGTCTATTCCACCTCTTTCAAAAGTTCT. The two fragments were combined in an overlap PCR using the B1_CHIsp_F and B2 ro2(Orp1)_R primer. The fragment was cloned into pDONR207 via BP reaction, generating pENTR207L1L2‐CHI _ sp _ ‐roGFP2‐Orp1. After sequencing, a positive clone was used for LR reaction into pSS02 (derivative of pMDC32; Curtis & Grossniklaus 2003) via LR reaction, creating a plant expression construct under control of the A. thaliana Ubiquitin10 promoter.
For transient expression in N. benthamiana epidermal leaf cells, the binary expression vector 35S _ pro _ :CHI _ sp _ ‐roGFP2‐Orp1 was cloned by Gibson assembly. The CHI _ sp _ ‐roGFP2‐Orp1 fragment was amplified from pENTR207L1L2‐CHI _ sp _ ‐roGFP2‐Orp1 using the primer pair CHIsp_roGFP2_linker_Orp1(F: caatttactattctagtcgaATGAAGACTAATCTTTTTCTCTTTC and R: tgcggactctagcatggccgCTATTCCACCTCTTTCAAAAG). The vector fragment was amplified from the destination vector pH2GW7 (Karimi et al. 2002) with the primer pair pH2GW7 F: CGGCCATGCTAGAGTCCG and R: TCGACTAGAATAGTAAATTGTAATGTTGTTTGTTG. Both fragments were amplified using KOD Xtreme™ Hot Start DNA Polymerase and ligated via Gibson assembly using NEBuilder® HiFi DNA Assembly Master Mix according to manufacturer's instructions. Gateway™ LR Clonase™ II was employed to create the binary expression vector 35S _ pro _ :TagRFP‐T‐RemA (plasma membrane marker) by recombining the entry vector pENTRTagRFP‐T‐RemA (Cyprys et al. 2019), which contains TagRFP‐T N‐terminally fused to the membrane anchor of M. truncatula SYMREM1 (Konrad et al. 2014), with the destination vector pB2GW7 (Karimi et al. 2002). Both expression vectors were transformed into chemically competent Agrobacterium strain GV3101 (pMP90RK). Single colonies were picked and grown for 48 h in liquid YEP medium (10 g L^−1^ yeast extract, 10 g L^−1^ peptone, and 5 g L^−1^ NaCl) containing the corresponding antibiotics and cultured to OD_600_ = 0.8 before resuspension in infiltration buffer (5% (w/v) sucrose, 0.01% Silwet L‐77, 450 μM acetosyringone) supplemented with a small spatula tip of MgSO_4_ and glucose. The two cultures were mixed at 1:1 ratio and co‐infiltrated into N. benthamiana leaves as described previously for N. tabacum (Sparkes et al. 2006). After 48 h, plasmolysis was induced by injecting 1 M sorbitol into the infiltrated leaf areas and incubation for 15–30 min before microscopy analysis.
For sensor experiments in N. tabacum pollen tubes, the CHI _ sp _ ‐roGFP2‐Orp1 and roGFP2‐Orp1 coding sequences were amplified from the pSS02‐CHI _ sp _ ‐roGFP2‐Orp1 plasmid by Touch Down PCR using KOD Hot Start Polymerase (NOVAGEN) with primers PP373: AACAGGTCTCAGGCTCAATGAAGACTAATCTTTTTCTCTTTCTCAT, PP374: AACAGGTCTCTCTGACTATTCCACCTCTTTCAAAAGTTCT and PP375: AACAGGTCTCAGGCTCAATGGTGAGCAAGGGCG. Amplified DNA fragments and entry vector pGGC000 (Lampropoulos et al. 2013) were digested with BsaI‐HF restriction enzyme (New England Biolabs, Ipswich, MA, USA) to generate compatible overhangs. Ligation into the entry vector was performed with T4 ligase (New England Biolabs). The final expression vectors, driving the constructs under the LAT52 promoter (Twell et al. 1989), were generated by Golden Gate assembly using the Green Gate cloning system and pGGZ001 as final destination plasmid (Lampropoulos et al. 2013). Transient transformation of N. tabacum pollen was carried out via particle bombardment, following a protocol adapted from Ge et al. (2019). For each transformation, 2 μg of plasmid was mixed with 25 μL of the gold particle (Ø 1.6 μm) suspension. 25 μL of 2.5 M CaCl_2_ and 10 μL of 1 mg mL^−1^ protamine were added to the mixture, vortexed for 3 min and centrifuged at 10,000 g for 30 s. The resulting pellet was washed with 200 μL 100% ethanol, vortexed for 3 min, and again centrifuged at 10,000 g for 30 s before it was resuspended in 16 μL of 100% ethanol. Aliquots of 8 μL each were loaded onto two macro‐carriers and air‐dried. Pollen was prepared as described by Ge et al. (2019) with the following adaptions: Frozen anthers from 8 to 10 flowers were suspended in pollen germination medium (PGM) without PEG (0.58 mM sucrose, 0.02 M MES KOH, 1.62 μM H_3_BO_3_, 1.66 μM MgSO_4_, 0.98 μM KNO_3_, 3 mM Ca(NO_3_)2). After bombardment, pollen grains were transferred into a fresh 6 cm Petri dish containing 1.8 mL PGM with PEG (71.6 μM PEG3350, 73.1 μM sucrose, 0.02 M MES KOH, 1.62 μM H_3_BO_3_, 1.66 μM MgSO_4_, 0.98 μM KNO_3_, 3 mM Ca(NO_3_)2) and cultured at 21°C on a horizontal shaker set to 120 rpm. Germinated pollen grains were either directly transferred onto a microscope slide or treated with 5 mM 2,2′‐dipyridyl disulfide (DPS) or 10 mM dithiothreitol (DTT) in PGM for at least 30 min before transfer.
Generation of transgenic lines
Stable transgenic P. patens lines were generated using polyethylene glycol‐mediated protoplast transformation, as described in Hohe et al. (2004). For transformation, purified plasmids were cut near PTA2 homologous regions (Kubo et al. 2013) (PTA2Act5GW‐AP1sp‐roGFP2‐Orp1 using BglII and NotI; PTA2Act5GW‐roGFP2‐Orp1 using BglII) and mixed in a molar ratio of approximately 2:1 with the uncut resistance plasmid pBsNNNEV, containing the nptII neomycin resistance gene under control of a NOS promoter and terminator. Plants surviving 4 weeks on selection media (Knop ME with 12.5 μg mL^−1^ G418) were transferred to Knop ME and screened for sensor fluorescence after growth for ca. 2 weeks.
Transformation of A. thaliana was performed by the floral dip method (Clough & Bent 1998). Briefly, competent AGL‐1 Agrobacterium tumefaciens cells were transformed with an error‐free expression clone of pSS02‐CHI _ sp _ ‐roGFP2‐Orp1 using electroporation and selected on agar containing Rifampicin, Ampicillin and Kanamycin (all 50 μg mL^−1^). For floral dip, an overnight culture of a positive A. tumefaciens colony was inoculated and, after reaching an OD_600_ of approximately 0.8, the cells were harvested by centrifugation for 10 min at 5000 g. The supernatant was discarded, and the pellet resuspended in 400 mL dipping solution (5% sucrose, 0.02% Silwet Gold). A. thaliana plants containing flower buds were dipped twice at a time interval of 6–7 days. T1‐transformants were selected on ½ MS (Murashige & Skoog + Vitamins 0.22%, Duchefa), 0.1% sucrose, 0.8% agar plates, pH 5.7, containing 20 μg mL^−1^ Hygromycin B (Duchefa, Haarlem, The Netherlands). After germination, seedlings with long hypocotyls, longer roots as well as green cotyledons were transferred to soil. T1 plants were screened for fluorescence, and presence of a single T‐DNA was confirmed using segregation analysis of T2 seedlings. Experiments shown here were conducted with material from homozygous T4 and T5 plants.
Microscopy imaging of roGFP2‐Orp1
For ratiometric analysis, confocal laser scanning microscopy of roGFP2‐Orp1 in the apoplast of P. patens leaflets and A. thaliana leaf discs was realised on a LSM880 (Axio Observer.Z1, Carl Zeiss, Oberkochen, Germany) using a ×40 (C‐Apochromat ×40/1.2 W) objective by exciting roGFP2 sequentially at 405 nm (diode laser, 1/0.5% (A. thaliana/P. patens)) and 488 nm (argon laser, 1/3.5% (A. thaliana/P. patens)) and detecting roGFP2 emission between 509 nm and 535 nm. Autofluorescence was detected at 425–470 nm after excitation at 405 nm. Chlorophyll autofluorescence was detected at 680–735 nm after excitation at 488 nm. For roGFP2‐Orp1 calibration, P. patens gametophores and A. thaliana leaf discs were submerged in imaging buffer (10 mM MES, 5 mM KCl, 10 mM CaCl_2_, 10 mM MgCl_2_ pH 5.8 (Wagner et al. 2019)) or imaging buffer supplemented with either 5 mM 2,2′‐dipyridyl disulfide (DPS) or 10 mM dithiothreitol (DTT) and incubated until complete oxidation or reduction. Fluorescence ratio calculations and further image analysis were performed in a MATLAB‐based ratio software (RRA; Fricker 2016). For plasmolysis, 600 mM mannitol was used for A. thaliana and 600 mM NaCl was used for P. patens. The degree of oxidation (OxD) of roGFP2 was calculated according to Schwarzländer et al. (2008).
Overview images of fluorescence intensity were taken with a fluorescence stereomicroscope (Leica M205 FCA with Leica K3C camera, Plan Apo 0.63× and 2× corr. objective, Leica, Wetzlar, Germany), using 405–40 ex./525–50 em. and 470–40 ex./525–50 em. filter combinations.
Transiently transformed N. benthamiana leaves were imaged using a Visitron VisiScope spinning disc microscope with a Leica DMi8 body, a Yokogawa CSU‐W1 spinning disc unit, a Visitron sCMOS pco.edge camera, and a 40×/1.2 water immersion objective. The 488 nm laser was used for excitation of GFP, tagRFP was excited with the 561 nm laser. Emission filters were 525–50 nm for GFP and 609–52 nm for RFP. Images were processed using Fiji (Schindelin et al. 2012).
Fluorescence microscopy of N. tabacum pollen tubes was performed using a ZEISS LSM 980 Airyscan2 Confocal Laser Scanning Microscope (CLSM) with a Plan‐Apochromat 63×/1.40 Oil DIC M27 objective. CHI_sp_‐roGFP2‐Orp1/roGFP2‐Orp1 were excited sequentially with a 405 nm (8%) and 488 nm (4%) laser and detected at 499–535 nm. Autofluorescence was detected for both sensor constructs at 400–477 nm after excitation at 405 nm.
Plate reader‐based read‐out of fluorescence and luminescence
Ratiometric time‐series measurements for roGFP2‐Orp1 fluorescence were carried out using a CLARIOstar® Plus plate reader (BMG Labtech, Ortenberg, Germany). The roGFP2 signal was detected using a sequential filter‐based excitation of 400–10 nm and 482–16 nm, with the emission detected using a 530–40 nm filter, using top optics. For P. patens expressing AP1_sp_‐roGFP2‐Orp1, whole gametophores were transferred to a 96‐well plate (3–5 per well) and incubated in 200 μL imaging buffer (10 mM MES, 5 mM KCl, 10 mM CaCl_2_, 10 mM MgCl_2_, pH 5.8) overnight in the dark at room temperature. The next day, the imaging buffer was replaced and, after another hour in the dark, the measurement was started (Ugalde, Fecker, et al. 2022). After measuring the initial fluorescence of the untreated samples, the measurement was paused and the treatment was added. For calibration, the treatment of 10 mM DTT for full reduction and 5 mM DPS for full oxidation was used, while for re‐oxidation measurements the reductive treatment consisted of 5 mM tris(2‐carboxyethyl)phosphine (TCEP) (Bond‐Breaker™ TCEP‐solution, REF 77720, Thermo Scientific). In this case, the measurement was paused again to remove and wash out the TCEP 3 × 5 min with 200 μL imaging buffer, after observing complete sensor reduction.
For assays with A. thaliana expressing CHI _ sp _ ‐roGFP2‐Orp1, 7 mm leaf discs were punched out and floated on imaging buffer overnight in the dark with the adaxial side facing up. On the next day, the leaf discs were transferred to a 96‐well plate and pushed to the bottom of the well with the adaxial side facing down. After 1 h incubation in imaging buffer in the dark, the buffer was replaced and leaf discs used for fluorescence read‐out of roGFP2‐Orp1, as described above, but via bottom optics (Ugalde, Fecker, et al. 2022). To trigger oxidative bursts, a flagellin fragment (flg22, AS‐62633; Eurogentec, Seraing, Belgium) was used as elicitor and added manually to a final concentration of 1 μM in the respective wells.
For a luminescence‐based read‐out of elicitor‐triggered oxidative bursts (Luminol assay), 4 mm leaf disks of A. thaliana Col‐0 were prepared and incubated overnight as described above. They were then transferred to imaging buffer or 5 mM TCEP in imaging buffer for 2 h and subsequently washed 3 × 5 min with imaging buffer. After this they were transferred to a 96‐well plate and left floating on imaging buffer, containing the assay mixture of 20 μM L‐012 (L‐012, 120–04891; FUJIFILM Wako Chemicals Europe, Neuss, Germany) and 8 μg mL^−1^ horseradish peroxidase (HRP1) (P8125; Sigma‐Aldrich, St. Louis, MO, USA). The relative light units (RLU) were measured for at least 5 cycles before an oxidative burst was triggered as described above. As a control, imaging buffer was added instead of flg22. To allow for comparison between replicates on different plates, RLU data of each plate were normalised over the mean peak RLU value of control leaf discs treated with flg22.
Statistical analysis
Two‐way ANOVA, followed by Tukey's multiple comparisons test was performed using GraphPad Prism v. 10.4.0 (or later versions) for Windows (GraphPad Software, Boston, MA, USA, www.graphpad.com).
RESULTS
Generation of stable plant lines secreting roGFP2‐Orp1 to the apoplast
To obtain stable plant lines expressing and secreting roGFP2‐Orp1 (Fig. 1A) to the apoplast, we used endogenous constitutive promoters and added suitable signal peptides for targeting the secretory pathway to the N‐terminus of existing roGFP2‐Orp1 constructs (Nietzel et al. 2019). To this end, we employed the endogenous signal peptide of aspartic protease 1 (AP1_sp_) from P. patens (Schaaf et al. 2004; Hoernstein et al. 2018), as well as an endogenous chitinase signal peptide from A. thaliana (Haseloff et al. 1997; Meyer et al. 2007; Ugalde, Aller, et al. 2022) (Fig. 1B). Correct protein targeting to the apoplast was confirmed by transient expression of CHI _ sp _ ‐roGFP2‐Orp1 together with a plasma membrane marker in N. benthamiana epidermal cells (Fig. S1).
Subsequently, we stably transformed P. patens and A. thaliana and selected several independent fluorescent plant lines expressing secreted roGFP2‐Orp1. No growth differences were observed for transgenic lines, and two independent lines per species were chosen for further analyses. By inducing plasmolysis, we confirmed the localisation of fluorescent signal in the apoplast for both species (Fig. 1C, Fig. S2). While roGFP2 fluorescence was evenly distributed in leaflets of moss gametophores (Fig. 1C, Figs. S2 and S3A,B), it was mainly visible in perpendicular walls in filamentous moss protonema (Fig. S3C). In A. thaliana, roGFP2 fluorescence signal intensities differed between tissues: the strongest signals were observed in lobes of pavement cells in the epidermis as well as in hypocotyls of seedlings (Fig. 1C, Fig. S3D–F), whereas mesophyll cells showed a heterogenous signal distribution, with punctuate signals at contact points between cells (Fig. S3G). Sensor fluorescence intensity in roots was lower, except for the root tip (Fig. S3H,I).
Calibration of secreted roGFP2‐Orp1
We then assessed the redox state of secreted roGFP2‐Orp1 by ratiometric imaging and ratiometric plate reader‐based fluorescence read‐out for both species. To test functionality and dynamic range of secreted roGFP2‐Orp1, we fully reduced and oxidised the sensor protein in vivo using the reductant dithiothreitol (DTT) and the thiol‐specific oxidant 2,2′‐dipyridyl disulfide (DPS) (Lopez‐Mirabal et al. 2007). Using confocal microscopy and image analysis (Fricker 2016; Ugalde, Fecker, et al. 2022), we found that the dynamic range (fold change between minimum and maximum observed ratio values, δ) of secreted roGFP2‐Orp1 was between circa 1.8 and 2.5 in moss leaflets (Fig. 2A,B; individual channels shown in Fig. S4), while it was increased in the reproductive structures, gametangia, to about 3 to 4 (Figs. S5 and S6). We found a similar dynamic range of ca. 1.8 to 2.3 in A. thaliana leaf epidermis and mesophyll (Fig. 2A,B; individual channels shown in Figs. S7 and S8). Using plate reader‐based fluorescence read‐out from gametophores and leaf discs (Wagner et al. 2019; Ugalde, Fecker, et al. 2022), we measured a slightly smaller or similar dynamic range of between 1.8 and 2.3 during sensor calibration over time in both species (Fig. 2C). As calibration was possible in all tested tissues, it is possible to determine the in vivo redox state of roGFP2‐Orp1 by investigating non‐treated, physiological samples (phys.). Both ratiometric measurement methods confirmed that roGFP2‐Orp1 is mainly oxidised when secreted (data for physiological state without treatments in Fig. 2A–C), with many physiological values not significantly different from fully oxidised sensor controls. Based on the individual calibrations, we calculated mean degrees of sensor oxidation (OxD) in physiological state ranging from 65 ± 13% to 87% ± 5% for P. patens and 75 ± 3% to 90 ± 6% in A. thaliana, which is close to the 96.5% in Arnaud et al. (2023).
*Calibration of apoplastic roGFP2‐Orp1 in P. patens and A. thaliana. Calibration for two independent lines of P. patens expressing AP1
sp
‐roGFP2‐Orp1 (left panels) and two independent lines of A. thaliana expressing CHI
sp
‐roGFP2‐Orp1 (right panels). 10 mM dithiothreitol (DTT) was used for full reduction and 5 mM 2,2′‐dipyridyl disulfide (DPS) used for full oxidation of the biosensor in vivo. (A) Sensor 405/488 redox ratio depicted as false‐colour ratio scale in confocal microscopy images. Scale bars = 10 μm. (B) Box plots of redox ratio analysis using confocal microscopy images. The measured dynamic range is indicated by δ. Boxes show 25th to 75th percentiles, the line indicates the median, the whiskers show min and max, individual data points are shown as circles, n = 5–12. Different letters indicate significant differences according to two‐way ANOVA with Tukey's multiple comparison post‐hoc test, p < 0.05. (C) In vivo calibration of roGFP2‐Orp1 measured as a time series using leaf discs (A. thaliana) or gametophores (P. patens) in a multi‐well plate reader. Graphs depict 400‐10/482‐16 ratios, normalised to the ratio mean before treatment (R t/R t0). Opening of the plate reader for addition of DTT or DPS and start of treatment indicated by two dashed lines, n = 5.*
Plate reader‐based measurements, that integrate biosensor signal over a high number of cells, suggested that secreted roGFP2‐Orp1 was not completely oxidised in vivo in P. patens, as plateau mean values for physiological measurements were consistently below mean values for oxidised controls (Fig. 2C). Interestingly, using confocal microscopy, some heterogeneity of sensor oxidation was visible both in A. thaliana and P. patens, especially in areas of high sensor signal (Fig. 2A,B, Figs. S4, S7, and S8).
Monitoring protein cysteinyl oxidation kinetics in the apoplast
While the oxidation rate of roGFP2‐Orp1 is dependent on changes in H_2_O_2_ levels, reduction of the roGFP2 reporter domain is dependent on the GSH/GRX (glutathione/glutaredoxin) system intracellularly. Given that GRXs are absent from the apoplast and that GSH levels are very low, the sensor oxidation should be uncoupled from competing reductive processes. Therefore, the sensor oxidation state could potentially be used as a read‐out for changes in apoplastic H_2_O_2_ levels, if the sensor disulfides can be pre‐reduced. Thus, we tested different doses and types of thiol‐reducing agents, using the stable lines expressing secreted roGFP2‐Orp1. To this end, we first used DTT, that already proved successful in apoplastic sensor calibration (Fig. 2). After reaching plateau reduction levels, we subsequently removed DTT, washed the samples stringently and investigated sensor re‐oxidation rates (Fig. S9). A direct comparison of P. patens and A. thaliana, including sensor calibration, revealed that secreted roGFP2‐Orp1 oxidation rates after pre‐reduction showed species‐specific differences, with barely any re‐oxidation observable for P. patens gametophores, and re‐oxidation in A. thaliana leaf discs within hours (Fig. S9). To titrate exposure to the reducing agent DTT, we reduced DTT doses from 10 mM to 1 mM and found that 2.5 mM DTT was sufficient to fully reduce secreted roGFP2‐Orp1 in about 2–4 h in both species (Fig. S10). Re‐oxidation occurred only slowly in A. thaliana leaf discs over ca. 10 h, and using 5 mM or more DTT led to incomplete sensor re‐oxidation in the monitored time of 20 h. Notably, re‐oxidation in P. patens remained consistently low, independently of the used amount of DTT (Fig. S9). As DTT penetrates cells, and as complete reduction of cells might cause reductive stress and disturb ER function (Ugalde, Aller, et al. 2022), we next tested a reducing agent that is non‐cell permeable. To this end, we used 5 mM TCEP (Cline et al. 2004). As a control, we tested TCEP effects using A. thaliana leaf discs expressing cytosolic roGFP2‐Orp1 and found no effect during a 4‐h incubation (Fig. S11). Interestingly, cytosolic roGFP2‐Orp1 showed potential oxidation after removal of TCEP (Fig. S11). Incubating A. thaliana leaf discs with 5 mM TCEP led to complete reduction of secreted roGFP2‐Orp1, while full dynamic range was not reached in P. patens gametophores (Fig. 3A). After washing out TCEP, secreted roGFP2‐Orp1 re‐oxidised between 12 h and 30 h in independent experiments in A. thaliana, while its redox state remained largely unchanged in P. patens gametophores. To test if the secreted roGFP2‐Orp1 was still responsive to H_2_O_2_‐mediated oxidation after pre‐reduction, we added exogenous H_2_O_2_ after removal of the reducing agent and observed rapid oxidation responses of secreted roGFP2‐Orp1 in vivo in both species (Fig. 3B).
Re‐oxidation rate of reduced apoplastic roGFP2‐Orp1. Graphs depict 400‐10/482‐16 ratios, normalised to the ratio mean before treatment (R t/R t0), of apoplastic roGFP2‐Orp1 measured as a time series using leaf discs (A. thaliana) or gametophores (P. patens) in a multi‐well plate reader. Start of treatment with 5 mM TCEP is indicated by a blue dashed line (+T). After reaching plateau values, the measurement was paused to remove and wash out the reducing agent, indicated by the two dashed lines (wash). (A) Comparison of apoplastic roGFP2‐Orp1 re‐oxidation rates in P. patens and A. thaliana after pre‐reduction with 5 mM TCEP (blue inverted triangles), with untreated samples serving as physiological controls (phys., green circles), n = 5. (B) Comparison between inherent re‐oxidation rate (blue inverted triangles) and re‐oxidation by adding 10 mM H2O2 after washing (red triangle), n = 4 for P. patens, n = 5 for A. thaliana.
As re‐oxidation rates of roGFP2‐Orp1 were lower than expected in vivo, we investigated if activation of apoplastic O_2_ ^·−^ production via RBOHs would increase sensor oxidation rates. To this end, we used A. thaliana leaf discs and the peptide elicitor flg22 (Fig. 4) (Felix et al. 1999). First, we confirmed that the flg22‐triggerred immune response is still functional after pre‐reducing Col‐0 leaf discs using TCEP and luminol assays (Fig. 4A). Assessing roGFP2‐Orp1 fluorescence under the same conditions, we found that addition of flg22 leads to an increase in autofluorescence after excitation of fluorescence at 400 nm that was detectable in control leaf discs from the WT without sensor expression (Fig. 4B grey overlay). This massive increase in autofluorescence interfered with fluorescence‐based ratiometric roGFP2 read‐out approximately 5 h after addition of flg22. We thus restricted the further analysis of secreted roGFP2‐Orp1 400/480 fluorescence ratio to the first 4 h after addition of flg22, which did not show an increase of autofluorescence in WT (Fig. 4C,D).
ROS burst after reduction of apoplastic roGFP2‐Orp1. The luminescence (A) and fluorescence (B–D) of A. thaliana leaf discs expressing CHIsp‐roGFP2‐Orp1 (C, D) and Col‐0 (A, B) leaf discs were measured in a plate reader. (B–D) Blue dashed lines indicate addition of 5 mM TCEP; black dashed lines indicate wash out of TCEP and addition of 1 μM flg22. (A) Normalised RLU of a luminescence assay plotted against time. Samples were treated with 5 mM TCEP for 2 h before measurement (purple and grey diamonds), whereas control samples were kept in imaging buffer (green and grey circles). For measurement, imaging buffer containing 20 μM L‐012 and 8 μg mL−1 HRP1 was used. Dashed line indicates addition of 1 μM flg22 or buffer, n = 29. (B) Autofluorescence profile in Col‐0 normalised over the initial intensity before treatment, plotted against time. Each sample was treated with 5 mM TCEP, whereas only part of the samples was treated with 1 μM flg22 (yellow squares), n = 12. (C, D) The 400‐10/482‐16 ratio of apoplastic roGFP2‐Orp1 in line 3B and 1D, plotted against time. The ratio was normalised over the initial ratio before addition of treatment (R t/R t0). Depicted are samples first treated with TCEP and with flg22 (orange diamonds), samples not treated with TCEP, but with flg22 (pink circles), and samples only treated with TCEP (purple hexagons). A transitory peak after addition of flg22 is indicated by the two grey diamonds. n = 20.
In contrast to a control without addition of flg22, pre‐reduced roGFP2‐Orp1 re‐oxidised during the first 3 h after flg22 addition, suggesting increased H_2_O_2_‐based oxidation rate in the apoplast. A second control sample, containing leaf discs expressing secreted roGFP2‐Orp1 that were not pre‐reduced, showed a slight oxidative peak after addition of flg22, as well as in the pre‐reduced sample (grey diamonds, Fig. 4C,D). This transitory peak might be caused by the manual addition of flg22, and opening/closing of the plate reader, or represent a rapid transitory oxidation event that is also affecting roGFP2‐Orp1 without pre‐reduction. In summary, the elicitor‐triggered immune response led to more rapid sensor re‐oxidation in the apoplast of A. thaliana leaf discs, which was measurable via fluorescence read‐out of roGFP2 in the first hours after initiation of an oxidative burst.
As extracellular ROS are also important in a developmental context, we next investigated roGFP2‐Orp1 signal, both from an intracellular as well as an extracellular perspective, in tip‐growing gametophytic tissues. To this end, we compared both cytosolic and secreted roGFP2‐Orp1 in P. patens protonema and in N. tabacum pollen tubes (Fig. 5, Figs. S12 and S13).
Comparison of cytosolic versus secreted roGFP2‐Orp1 during tip growth in P. patens protonema and N. tabacum pollen tubes. (A, B) Confocal images showing P. patens protonema tip cells (A) and N. tabacum pollen tubes (B) expressing cytosolic (upper panels) or secreted (middle and lower panels) roGFP2‐Orp1 under physiological (phys.) conditions. Most protonema tip cells show no tip roGFP2‐Orp1 signal (A, lower panel) with few exceptions (A, middle panel). Autofluorescence (auto.) elicited after excitation at 405 nm is in blue (λem: 425–475 nm), roGFP2 signal after excitation at 405 nm in magenta (λem: 509–535 nm) and roGFP2 signal after excitation at 488 nm in green (λem: 509–535 nm). The 405/488 fluorescence ratio is shown by merging the two roGFP signals (merge); TL, transmitted light; arrowhead points to extracellular signals; scale bars = 2 μm (A), 5 μm (B).
We found that signal intensity and distribution of the secreted roGFP2‐Orp1 differs between species. In the apoplast of P. patens protonema tissue, most, but not all, tip‐growing meristematic cells showed no roGFP2‐Orp1 accumulation in the apoplast. Approximately 8% (5 out of 60 randomly selected protonema tip cells) showed roGFP2‐Orp1 fluorescence (Fig. 5A, Fig. S12A). In contrast, in the transition from tip growth to emerging gametophore buds, the apoplastic sensor signal was more intense and homogenous (Fig. S12B). Assessing transiently transformed N. tabacum pollen tubes, the roGFP2‐Orp1 signal was visible in secretory vesicles as well as in the apoplastic region (Fig. 5B, Fig. S13). Sensor calibration of N. tabacum pollen tubes revealed that secreted roGFP2‐Orp1 tended towards a lower, but not significantly different, 405/488 ratio compared to a completely oxidised control (Fig. S13C). Investigating cytosolic roGFP2‐Orp1, we found an evenly reduced cytosolic signal in both protonema and pollen tubes (Fig. 5). When comparing cytosolic and secreted roGFP2‐Orp1 signals using the same microscope settings for each cell type, secreted roGFP2‐Orp1 in protonema showed a clear oxidative shift compared to the cytosolic signal (Fig. 5A, Fig. S12). However, pollen tube tips lacked this contrast and instead showed potentially partially reduced roGFP2‐Orp1 (Fig. 5B).
DISCUSSION
Observed heterogeneity of roGFP2‐Orp1 levels and redox states
We generated and characterised stable transgenic plant lines secreting the redox sensor roGFP2‐Orp1 in the model bryophyte P. patens and the model angiosperm A. thaliana. Bryophytes are the sister clade to vascular plants, undergoing separate evolution since circa 480 million years (Lang et al. 2010; Donoghue et al. 2021). Mosses have a dominant gametophytic generation, with juvenile tip‐growing filamentous protonema and leafy gametophores that bear gametangia and, after fertilisation via flagellated sperm cells, sporophytes (Kofuji & Hasebe 2014; Müller et al. 2016; Falz & Müller‐Schüssele 2019; Becker et al. 2025). In contrast, angiosperms display a dominant sporophytic generation, with female gametophytes enclosed in ovules, and sperm cells transported via pollen tubes (Becker et al. 2025).
Using species‐specific signal peptides, we mediated complete secretion of roGFP2‐Orp1 in both model species, enabling specific studies of sensor levels and redox steady state in the apoplast. Sensor levels differed between tissues for both species. In P. patens, protonema had lower roGFP2‐Orp1 levels, with highest fluorescence in perpendicular walls, with a few tip cells showing apoplastic roGFP2‐Orp1 signal in cell tips. The used endogenous PpActin5 promoter drives constitutive expression, as evidenced by the stable transgenic lines expressing cytosolic roGFP2‐Orp1. Thus, the overall low level of sensor signal in protonema cells is likely related to diffusion of secreted roGFP2‐Orp1 into the surrounding media through protonema cell walls. This property of protonema is already known and used in biotechnological applications to secrete protein biopharmaceuticals into the surrounding media for downstream processing (Reski et al. 2015). In contrast, roGFP2‐Orp1 homogenously labelled the apoplastic space in gametophore buds and leaflets, both of which possess a cuticle (Renault et al. 2017). Here, either cell wall density or the cuticle might limit diffusion of secreted soluble particles out of the tissue. The PpActin5 promoter was also active in moss gametangia, showing a partially heterogenous signal in zones of high secretion and/or low diffusion. In comparison to P. patens, there was higher heterogeneity of roGFP2‐Orp1 fluorescence levels in A. thaliana within the same tissue. We currently interpret the higher fluorescence signals in lobes of pavement cells, as well as in the meristematic/transition zone in root tips, as indications of high secretion rates and/or low apoplastic diffusion rates. Punctate signals in mesophyll correlated with contact points between cells in the spongy mesophyll, also suggesting high secretion or low apoplastic protein diffusion for these zones.
Ratiometric analysis of secreted roGFP2‐Orp1 fluorescence in its physiological state revealed mostly oxidised sensor protein, as expected and previously tested for the extracellular environment (Arnaud et al. 2023). The thiol‐switch on roGFP2 has a consensus midpoint potential of −280 mV (pH7) that allows sensitive measurement of redox changes of ±35 mV (Müller‐Schüssele et al. 2021). Thus, roGFP2 should be fully oxidised in the extracellular space, with an estimated E GSH less negative than −240 mV. Yeast Orp1 contains a peroxidatic cysteine (pK_a_ of 5.1; Ma et al. 2007) which, via its thiolate state, attacks H_2_O_2_, leading to sulfenylation and subsequent disulfide formation. This disulfide is then transferred by a dithiol/disulfide exchange mechanism to the fused roGFP2 moiety (Gutscher et al. 2009). Apoplastic pH in plants can rapidly change and has been measured as 6.3 in A. thaliana using the secreted pHluorin fluorescent sensor protein, with literature values ranging from 5 to 7, and potential spatio‐temporal changes of up to two pH units (Gao et al. 2004; Martinière et al. 2013). Using fluorescent protein‐based ‘Acidin’ biosensors, freely diffusing apoplastic sensor indicated a pH of circa 4.5, with a very similar localisation pattern in lobes of pavement cells, compared to secreted roGFP2‐Orp1 in this study (Moreau et al. 2022). At low pH (<5), fluorescence after excitation at 488 nm (B‐band) will be quenched in GFP variants (containing S65T) (Elsliger et al. 1999; Hanson et al. 2004). In contrast, absorption after excitation at 405 nm (A‐band) is increased at lower pH (Elsliger et al. 1999), which results in fluorescence in the case of roGFP2 (Hanson et al. 2004). Consequently, the roGFP2 oxidation state can be measured in the pH range expected, in comparison to the respective in vivo calibration. We calibrated apoplastic roGFP2‐Orp1 using thiol‐specific reductants. The dynamic measurement range (δ) was less than the δ6.1 reached with a purified sensor, or δ6.5 of the cytosol and δ4.1 of the mitochondria‐targeted sensor in vivo (Nietzel et al. 2019). It is known that roGFP2‐Orp1 δ decreases at lower pH (Nietzel et al. 2019). Lower δ can also be caused by a low signal‐to‐noise ratio, non‐optimal settings, difficulties in administering reduction and oxidation agents for in vivo calibration, and/or interfering autofluorescence in different tissues, as well as full or partial cleavage by local proteases.
Assessing physiological redox states of secreted roGFP2‐Orp1 using both confocal microscopy and plate reader‐based fluorescence read‐out suggested that a minor fraction of the sensor molecules might exist in a reduced state, especially in zones of high sensor signals. This must be interpreted cautiously, as there are several possible explanations for our observations. Expressing a thiol‐containing sensor, such as roGFP2‐Orp1, under a high‐level constitutive promoter might disturb ER redox homeostasis, causing reductive stress (Ugalde, Aller, et al. 2022), resulting in secretion of proteins with reduced thiols. Additionally, irreversible post‐translational modification of the redox‐sensitive sensor cysteines might create non‐responsive pseudo‐reduced sensor proteins. However, as we conducted sensor calibration within the described dynamic range, our results point to spatio‐temporal zonation in the apoplast, creating areas where the redox steady state of the protein cysteinyl groups (with similar characteristics to the protein sensor) is not completely oxidised. Mechanistically, possible reduction mechanisms affecting thiols in the apoplast are unclear, while both H_2_O_2_ and/or GSSG mediate disulfide formation at slow rates and non‐enzymatically (Deponte 2017).
Interestingly, there were differences between intracellular and secreted roGFP2‐Orp1 signals in P. patens protonema and pollen tubes of N. tabacum that might relate to a different secretion/diffusion balance. Both cell types have tip growth (Kost et al. 1999; Menand et al. 2007; Bibeau et al. 2021), although the in vivo growth speed differs by several orders of magnitude, 4–10 μm h^−1^ in chloronema (Menand et al. 2007) versus 300 μm h^−1^ in pollen tubes of N. tabacum (Geitmann et al. 1996). Although the N. tabacum growth rate is considered slow compared to the 10–20,000 μm h^−1^ of other angiosperms (Williams 2012). The main role of short‐lived pollen tubes is to extend through synthesis and assembly of cell wall components (Chebli et al. 2012), bringing sperm cells to the ovules, powered by massive secretion at the apex. Notably, neither investigated cell type possesses a cuticle, but show different retention of secreted roGFP2‐Orp1 around them. It is unclear whether different cell wall properties might mediate this effect. At the apex, pollen tubes form a soft single layer cell wall with esterified pectin, cellulose and callose 5–30‐μm thick behind the apex (Ferguson et al. 1998; Chebli et al. 2012; Wang et al. 2013). The pollen tube cell wall has evolved to be highly flexible yet resistant to environmental stress, balancing turgor pressure and rapid directional growth (Chebli et al. 2012; Vogler et al. 2013; Wang et al. 2013). To some extent, the ability to store secreted proteins might contribute to sporophyte/gametophyte and gametophyte/gametophyte interactions, such as dissolving the cuticle on female organs, growing through the extracellular matrix of transmitting tracts, and signalling pollen tube reception in ovules (Ingram & Nawrath 2017; Becker et al. 2025). The redox state analysis of apoplastic roGFP2‐Orp1 should be interpreted with caution, as ratiometric analysis of N. tabacum pollen tubes is challenging because of the rapid growth and has only been performed in transiently transfected cells growing in vitro. In assessing a direct difference between cytosolic and secreted roGFP2‐Orp1 in both protonema and pollen tube tips (Fig. 5), we consistently observed no redox gradients sensed by either the cytosolic or the secreted version of roGFP2‐Orp1. This is in contrast to previous data using the pH‐sensitive variant of the H_2_O_2_ sensor HyPer, that detected a potential increase in sensor oxidation in the shank compared to the tip region (Boisson‐Dernier et al. 2013), which might instead be explained as the result of a pH‐gradient. Incomplete sensor oxidation in the apoplast of N. tabacum pollen tube apices may be caused by the massive secretory load and raises interesting questions regarding the local redox environment around pollen tubes.
What can we learn from secreted roGFP2‐Orp1 regarding apoplastic redox dynamics?
To investigate oxidation rates for protein cysteinyl residues in vivo, we pre‐reduced samples and monitored sensor re‐oxidation rates. Notably, after reduction with either a cell‐permeable or a non‐cell‐permeable reducing agent for thiols, roGFP2‐Orp1 redox state was stable for around 20 h of monitoring in P. patens gametophores, and only slowly re‐oxidised in the time frame of hours in leaf discs of A. thaliana (Fig. 3, Fig. S9). In contrast, re‐oxidation after exogenous addition of H_2_O_2_ was fast, demonstrating responsiveness of roGFP2‐Orp1. Without the presence of enzymatic catalysis via glutaredoxins (GRX), equilibration of protein cysteinyl residue redox steady state and local E GSH is slow (Gutscher et al. 2008; Deponte 2017; Bohle, Rossi, et al. 2024). Thus, E GSH‐dependent roGFP2 oxidation rates potentially fit the observed sensor behaviour in the apoplast. In contrast, H_2_O_2_‐mediated oxidation of Orp1 is kinetically fast, because of higher rate constants, even in the pH range expected for the apoplast. Thus, slow sensor re‐oxidation indicates low H_2_O_2_‐mediated oxidation rates in the apoplast under physiological conditions. Exact local H_2_O_2_ levels cannot be directly derived from sensor read‐out, but roGFP2‐Orp1 can sense as low as 0.1 μM H_2_O_2_ in vitro (Gutscher et al. 2009; Nietzel et al. 2019). According to current knowledge, RBOH activity causes a rapid extracellular increase of H_2_O_2_ levels. RBOHs are transmembrane proteins that can transfer electrons from cytosolic NADPH to extracellular oxygen, generating O_2_ ^·−^ anions and, consequently, H_2_O_2_ and O_2_ by dismutation, which can either be a spontaneous reaction related to the low pH of the environment, or enzymatically catalysed by superoxide dismutases (Riley et al. 1991; Lee et al. 2022). Extracellular H_2_O_2_ is implicated in multiple processes, including signalling and pathogen defence. As treatment of A. thaliana with the bacterial elicitor flg22 leads to RBOHD‐dependent apoplastic oxidative bursts within seconds to minutes (Miller et al. 2009; Nietzel et al. 2019), we investigated the effect of flg22 treatment on secreted roGFP2‐Orp1 re‐oxidation rates. As autofluorescence can rapidly increase in consequence of plant immune responses (Bohle, Klaus, et al. 2024), roGFP2 fluorescence‐based read‐out, especially after excitation in the UV range (e.g. 405 nm), should be carefully interpreted. Thus, the increase in autofluorescence bleed‐through into the 400ex./520em. roGFP2 channel that we observed prohibits conclusions regarding the redox state more than 4 h after flg22 treatment. However, we found increasing oxidation rates for pre‐reduced roGFP2‐Orp1 in the first hours after triggering RBOH activity via flg22. Compared to exogenous addition of 10 mM H_2_O_2_, re‐oxidation rates after triggering an oxidative burst were slower. Using secreted roGFP2‐Orp1, there was a minor transitory oxidation peak after flg22 addition, which may be an artefact related to the manual addition of flg22. There was a time lag of around 1 h until apoplastic roGFP2‐Orp1 started oxidising at a stable rate. Based on the known phases of ROS generation during an immune response (Ngou et al. 2021; Arnaud et al. 2023), an immediate increase in apoplastic H_2_O_2_ levels was expected. This raises the question why protein‐based H_2_O_2_ sensing in the apoplast differs from luminol‐based assays. Importantly, also intracellular redox biosensing revealed a time lag between luminol‐based oxidative burst detection and intracellular oxidative changes (Nietzel et al. 2019; Ugalde, Fecker, et al. 2022; Arnaud et al. 2023). Intracellular oxidation of cytosolic roGFP2‐Orp1 starts in the range of minutes to an hour after triggering an oxidative burst with flg22 in A. thaliana, while H_2_O_2_‐detection with luminol‐based assays indicates a rapid peak in the first 20 min (Nietzel et al. 2019; Arnaud et al. 2023). Arnaud et al. (2023) found that the bi‐phasic cytosolic roGFP2‐Orp1 oxidation observed in response to flg22‐triggered immune signalling was largely unchanged in rbohd plants. Thus, while luminescence assays clearly evidence RBOHD activity, RBOHD activity is not necessary for intracellular oxidation dynamics in response to flg22. In this context, our results indicate that extracellular oxidative changes occurring downstream of RBOH activity are not as massive as suggested by luminol‐based assays, or more specific.
In conclusion, there were lower than expected oxidation rates for extracellular protein cysteinyl residues in A. thaliana which are even lower to absent in the model bryophyte P. patens. Our work provides first indications for the timeline of increasing apoplastic H_2_O_2_ levels in consequence of activating an immune response, as directly measured with a protein‐based redox sensor. However, it is currently unclear if cysteinyl oxidation rates in the extracellular space are biologically relevant. In animal cells, dynamic redox steady states in the extracellular space are linked to processes such as proliferation, differentiation and cell death (Banerjee 2012). In land plants, the RBOH gene family has expanded and diversified, playing important roles in immunity, but also during reproduction, e.g. in pollen tip growth (Kaya et al. 2014; Mhamdi & Van Breusegem 2018). How RBOHs fulfil their specific and diverse roles in creating local and dynamic apoplastic redox environments requires further investigation. In the absence of interfering autofluorescence, roGFP2‐based sensors could be used to investigate oxidation dynamics. This approach would be particularly interesting in resolving spatial differences in a tissue context. Detection of apoplastic redox dynamics using cysteine‐based sensors remains challenging, because of the need of pre‐reduction. In addition, secreted roGFP2‐Orp1 (or other pH‐stable fluorescent proteins) can provide valuable information regarding zones of secreted protein retention and diffusion barriers in different plant species and tissues.
AUTHOR CONTRIBUTIONS
JI, OT and SJMS designed the research. JI, LZ, PLZ and ST performed experiments and analysed data. SJMS, OT, AJM, TD and SS supervised the research and provided resources. JI and SJMS wrote the manuscript with contributions from all authors. All authors approved the manuscript before submission.
CONFLICT OF INTEREST
The authors declare that they have no conflicts of interest.
Supporting information
Fig. S1. Transient expression of CHI _ sp _ ‐roGFP2‐Orp1 in pavement cells of Nicotiana benthamiana leaves. Fig. S2. Creation of stable transgenic lines expressing secreted roGFP2‐Orp1 in P. patens and A. thaliana (additional independent lines). Fig. S3. Fluorescence signal distribution of apoplastic roGFP2‐Orp1 in P. patens and A. thaliana. Fig. S4. Confocal images of AP1_sp_‐roGFP2‐Orp1 calibration in P. patens. Fig. S5. Confocal images of Ap1_sp_‐roGFP2‐Orp1 calibration in P. patens gametangia (line #131). Fig. S6. Confocal images of Ap1_sp_‐roGFP2‐Orp1 calibration in P. patens gametangia (line #19). Fig. S7. Confocal images of CHI_sp_‐roGFP2‐Orp1 calibration in A. thaliana leaf discs (line 3B). Fig. S8. Confocal images of CHI_sp_‐roGFP2‐Orp1 calibration in A. thaliana leaf discs (line 1D). Fig. S9. Re‐oxidation rate of apoplastic roGFP2‐Orp1 pre‐reduced using DTT. Fig. S10. Re‐oxidation rate of apoplastic roGFP2‐Orp1 in P. patens and A. thaliana using varying doses of DTT. Fig. S11. Treatment with TCEP does not influence cytosolic roGFP2‐Orp1 redox state in A. thaliana. Fig. S12. Apoplastic roGFP2‐Orp1 in P. patens protonema tip cells and young buds. Fig. S13. Comparison of roGFP2‐Orp1 in the cytosol and in the apoplast of N. tabacum pollen tubes.
The reference list from the paper itself. Each links out to its DOI / PubMed record.
- 1Arnaud D. , Deeks M.J. , Smirnoff N. (2023) Organelle‐targeted biosensors reveal distinct oxidative events during pattern‐triggered immune responses. Plant Physiology, 191, 2551–2569.36582183 10.1093/plphys/kiac 603PMC 10069903 · doi ↗ · pubmed ↗
- 2Balsera M. , Buchanan B.B. (2019) Evolution of the thioredoxin system as a step enabling adaptation to oxidative stress. Free Radical Biology and Medicine, 140, 28–35.30862542 10.1016/j.freeradbiomed.2019.03.003 · doi ↗ · pubmed ↗
- 3Banerjee R. (2012) Redox outside the box: linking extracellular redox remodeling with intracellular redox metabolism. Journal of Biological Chemistry, 287, 4397–4402.22147695 10.1074/jbc.R 111.287995 PMC 3281658 · doi ↗ · pubmed ↗
- 4Becker A. , Chen X. , Dresselhaus T. , Gutsche N. , Müller‐Schüssele S.J. , Sprunck S. , Theißen G. , De Vries S. , Zachgo S. (2025) Sexual reproduction in land plants: an evolutionary perspective. Plant Reproduction, 38, 12.40355640 10.1007/s 00497-025-00522-4PMC 12069490 · doi ↗ · pubmed ↗
- 5Bibeau J.P. , Galotto G. , Wu M. , Tüzel E. , Vidali L. (2021) Quantitative cell biology of tip growth in moss. Plant Molecular Biology, 107, 227–244.33825083 10.1007/s 11103-021-01147-7PMC 8492783 · doi ↗ · pubmed ↗
- 6Birk J. , Meyer M. , Aller I. , Hansen H.G. , Odermatt A. , Dick T.P. , Meyer A.J. , Appenzeller‐Herzog C. (2013) Endoplasmic reticulum: reduced and oxidized glutathione revisited. Journal of Cell Science, 126, 1604–1617.23424194 10.1242/jcs.117218 · doi ↗ · pubmed ↗
- 7Bohle F. , Klaus A. , Ingelfinger J. , Tegethof H. , Safari N. , Schwarzländer M. , Hochholdinger F. , Hahn M. , Meyer A.J. , Acosta I.F. , Müller‐Schüssele S.J. (2024 a) Contrasting cytosolic glutathione redox dynamics under abiotic and biotic stress in barley as revealed by the biosensor Grx 1‐ro GFP 2. Journal of Experimental Botany, 75, 2299–2312.38301663 10.1093/jxb/erae 035 · doi ↗ · pubmed ↗
- 8Bohle F. , Rossi J. , Tamanna S.S. , Jansohn H. , Schlosser M. , Reinhardt F. , Brox A. , Bethmann S. , Kopriva S. , Trentmann O. , Jahns P. , Deponte M. , Schwarzländer M. , Trost P. , Zaffagnini M. , Meyer A.J. , Müller‐Schüssele S.J. (2024) Chloroplasts lacking class I glutaredoxins are functional but show a delayed recovery of protein cysteinyl redox state after oxidative challenge. Redox Biology, 69, 103015.38183796 10.1016/j.redox.2023.103015 PMC 10808970 · doi ↗ · pubmed ↗