Associations of Free Triiodothyronine With Sarcopenia Among Patients With Type 2 Diabetes: Cross‐Sectional and Sex‐Stratified Analyses
Jing Zhao, Mei-Tong Zhang, Dan Yu, Zi-Yue Shao, Da-Shuang Chen, Jian Zhu

TL;DR
This study found that lower levels of free triiodothyronine (FT3) are linked to sarcopenia in type 2 diabetes patients, with a stronger effect in women.
Contribution
The study identifies FT3 as a potential biomarker for sarcopenia risk in T2DM, revealing sex-specific patterns.
Findings
Low FT3 independently predicts sarcopenia (OR, 2.26) in T2DM patients.
FT3 shows stronger discrimination for sarcopenia than thyroxine or TSH (AUROC = 0.633).
The association between FT3 and sarcopenia is stronger in females (OR, 3.29) than in males (OR, 1.83).
Abstract
Sarcopenia is prevalent in Type 2 diabetes mellitus (T2DM). Whether thyroid‐related hormones within the euthyroid range can help identify sarcopenia risk remains unclear. This study was aimed at evaluating the association of euthyroid‐range thyroid markers with sarcopenia and their utility in risk stratification among adults with T2DM. We analyzed 1823 adults with T2DM (2019–2023). Sarcopenia was defined per Asian Working Group for Sarcopenia 2019 criteria. Muscle mass was assessed via multifrequency bioelectrical impedance analysis, handgrip strength via dynamometer, and gait speed via 6‐m walk test. Multivariate linear and logistic models were adjusted for demographics, diabetes duration, body mass index, nephropathy, glycated hemoglobin, and antidiabetic medications. Discriminatory ability was evaluated using receiver operating characteristic curves, change in the area under the…
Genes, proteins, chemicals, diseases, species, mutations and cell lines named across the full text — each resolved to its canonical identifier and authoritative record.
Click any figure to enlarge with its caption.
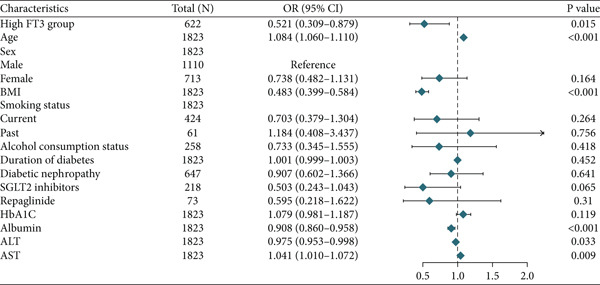 Figure 1
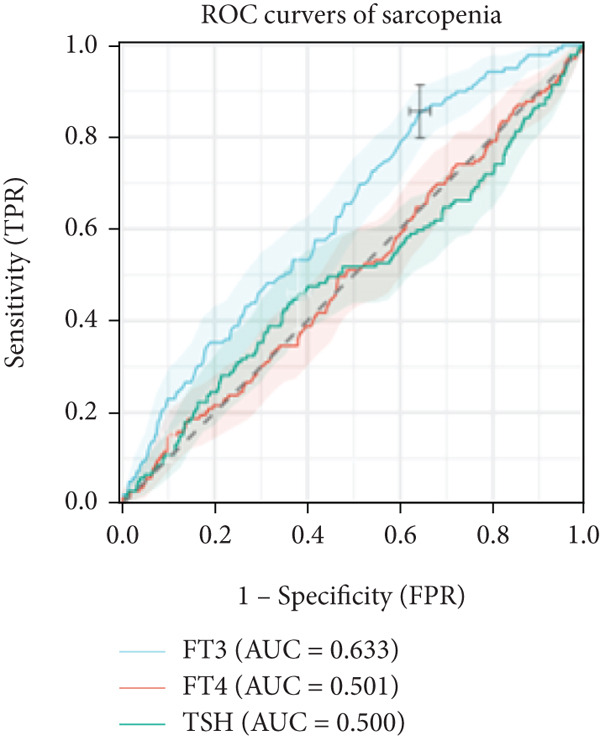 Figure 2
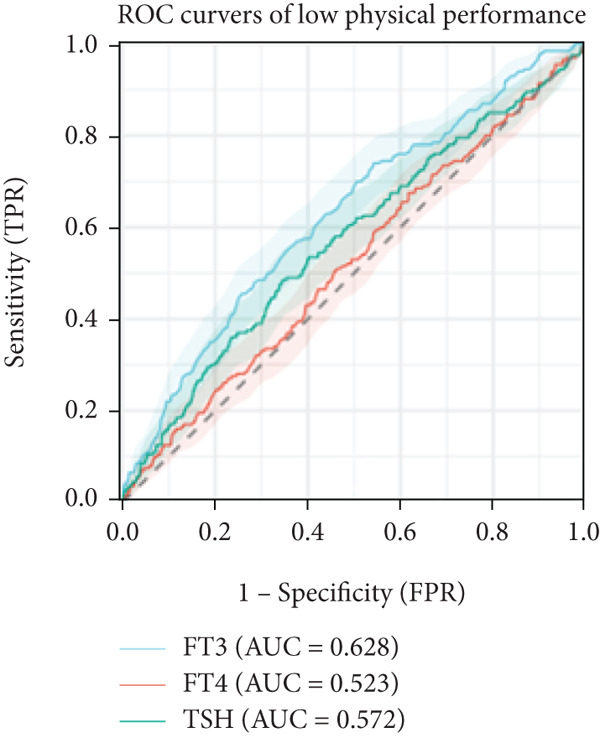 Figure 3
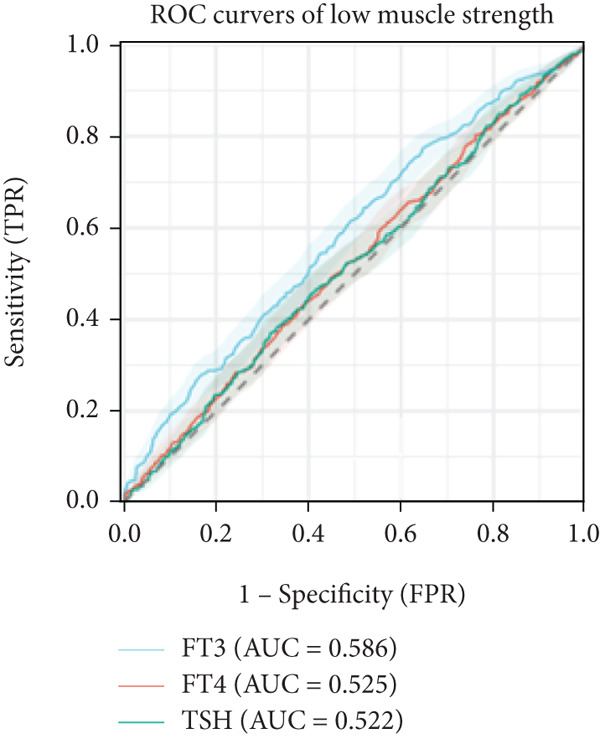 Figure 4
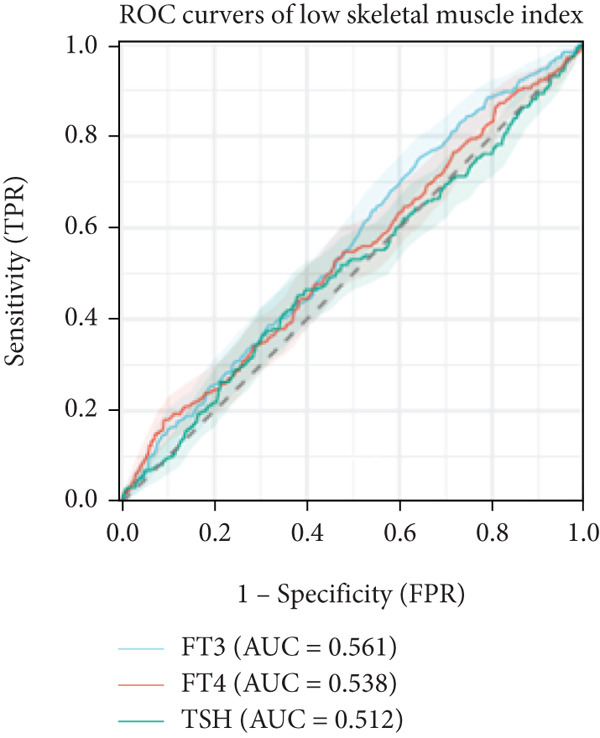 Figure 5
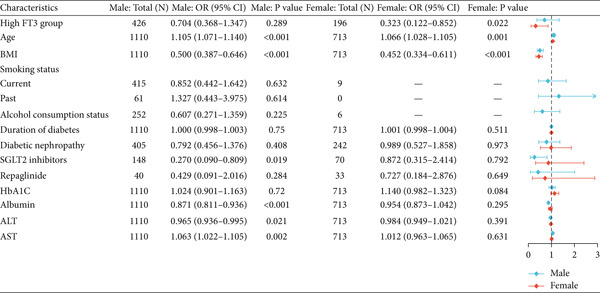 Figure 6
|
|
|
|
|
|---|---|---|---|
| Demographic variables | |||
| Age (years) | 61.77 ± 9.47 | 64.38 ± 9.29 | < 0.001 |
| BMI (kg/m2) | 24.79 ± 2.93 | 24.88 ± 3.41 | 0.534 |
| Smoking status, | < 0.001 | ||
| Current | 415 (37.4%) | 9 (1.3%) | |
| Past | 61 (5.5%) | 0 | |
| Alcohol consumption status, | 252 | 6 | < 0.001 |
| Duration of diabetes, months | 120 (48–180) | 120 (48–180) | 0.020 |
| Diabetic nephropathy, | 405 (36.5%) | 242 (33.9%) | 0.268 |
| Hypertension, | 660 (59.5%) | 443 (62.1%) | 0.255 |
| Sarcopenia, | 81 (7.3%) | 58 (8.1%) | 0.511 |
| Antidiabetic medication utilization, | |||
| Metformin | 417 (37.6%) | 302 (42.4%) | 0.041 |
| Pioglitazone | 24 (2.2%) | 19 (2.7%) | 0.490 |
| SGLT2i | 148 (13.3%) | 70 (9.8%) | 0.024 |
|
| 268 (24.2%) | 205 (28.8%) | 0.029 |
| Sulfonylureas | 238 (21.4%) | 202 (28.3%) | 0.001 |
| Meglitinides (repaglinide) | 40 (3.6%) | 33 (4.6%) | 0.276 |
| GLP‐1 RAs | 36 (3.2%) | 44 (6.2%) | 0.003 |
| DPP‐4i | 150 (13.5%) | 84 (11.8%) | 0.281 |
| Insulin | 392 (35.3%) | 289 (40.5%) | 0.025 |
| Biochemical and sarcopenia diagnostic indicators | |||
| Albumin (g/L) | 39.88 ± 3.43 | 39.56 ± 3.16 | 0.045 |
| ALT (U/L) | 20 (14–30) | 18 (13–28.2) | 0.039 |
| AST (U/L) | 15 (12–20) | 15 (12–21) | 0.147 |
| Total cholesterol (mmol/L) | 4.26 ± 1.09 | 4.56 ± 1.10 | < 0.001 |
| Serum creatinine ( | 74.1 (63.5–90.4) | 55.3 (46.7–68.1) | < 0.001 |
| eGFR (mL/min/1.73 m2) | 94.25 (76.1–103.33) | 94.7 (79.77–103.8) | 0.368 |
| Fasting glucose (mmol/L) | 7.13 (5.89–9.27) | 7.23 (5.82–9.13) | 0.922 |
| HbA1c (%) | 8.58 ± 1.94 | 8.58 ± 1.84 | 0.998 |
| FT3 (pmol/L) | 3.96 ± 0.63 | 3.81 ± 0.56 | < 0.001 |
| FT4 (pmol/L) | 12.67 ± 1.41 | 12.48 ± 1.47 | 0.006 |
| TSH (mIU/L) | 1.52 (1.04–2.35) | 1.97 (1.26–2.76) | < 0.001 |
| ASMI (kg/m2) | 7.68 ± 0.68 | 6.36 ± 0.64 | < 0.001 |
| Handgrip strength (kg) | 33.22 ± 7.95 | 19.94 ± 5.19 | < 0.001 |
| 6‐m walk test (m/s) | 1.23 ± 0.19 | 1.16 ± 0.20 | < 0.001 |
|
|
|
| ||||
|---|---|---|---|---|---|---|
|
|
|
|
|
|
| |
| Total | ||||||
| FT3 | 0.23 | < 0.001 | 0.07 | 0.011 | 0.05 | 0.072 |
| FT4 | −0.01 | 0.718 | −0.04 | < 0.001 | −0.03 | 0.002 |
| TSH | −0.02 | 0.139 | 0.04 | <0.001 | 0.04 | <0.001 |
| Male | ||||||
| FT3 | 0.12 | <0.001 | 0.08 | 0.018 | 0.04 | 0.183 |
| FT4 | −0.04 | 0.012 | −0.04 | 0.002 | −0.04 | 0.012 |
| TSH | 0.03 | 0.016 | 0.04 | 0.003 | 0.04 | 0.014 |
| Female | ||||||
| FT3 | 0.06 | 0.180 | 0.04 | 0.372 | 0.04 | 0.339 |
| FT4 | −0.03 | 0.054 | −0.03 | 0.050 | −0.03 | 0.046 |
| TSH | 0.04 | 0.015 | 0.05 | 0.003 | 0.05 | 0.003 |
|
|
|
| ||||
|---|---|---|---|---|---|---|
|
|
|
|
|
|
| |
| Total | ||||||
| FT3 ∗ | 3.05 | < 0.001 | 0.60 | 0.019 | 0.55 | 0.036 |
| FT4 | 0.37 | 0.018 | −0.05 | 0.653 | −0.03 | 0.784 |
| TSH | −0.66 | < 0.001 | 0.15 | 0.145 | 0.14 | 0.182 |
| Male | ||||||
| FT3 | 2.26 | < 0.001 | 0.75 | 0.035 | 0.70 | 0.055 |
| FT4 | 0.04 | 0.797 | −0.13 | 0.388 | −0.11 | 0.469 |
| TSH | −0.16 | 0.328 | 0.11 | 0.457 | 0.09 | 0.539 |
| Female | ||||||
| FT3 | 0.74 | 0.033 | 0.05 | 0.886 | 0.01 | 0.987 |
| FT4 | 0.13 | 0.334 | 0.07 | 0.575 | 0.08 | 0.522 |
| TSH | 0.03 | 0.845 | 0.21 | 0.073 | 0.21 | 0.079 |
|
|
|
| ||||
|---|---|---|---|---|---|---|
|
|
|
|
|
|
| |
| Total | ||||||
| FT3 | 0.06 | < 0.001 | 0.02 | 0.033 | 0.01 | 0.080 |
| FT4 | 0.01 | 0.095 | 0.00 | 0.952 | 0.00 | 0.843 |
| TSH | −0.01 | < 0.001 | −0.00 | 0.208 | −0.00 | 0.142 |
| Male | ||||||
| FT3 | 0.05 | < 0.001 | 0.02 | 0.060 | 0.01 | 0.118 |
| FT4 | −0.00 | 0.740 | −0.01 | 0.094 | −0.01 | 0.141 |
| TSH | −0.01 | 0.041 | −0.00 | 0.533 | −0.00 | 0.399 |
| Female | ||||||
| FT3 | 0.05 | 0.001 | 0.01 | 0.268 | 0.01 | 0.374 |
| FT4 | 0.01 | 0.025 | 0.01 | 0.055 | 0.01 | 0.038 |
| TSH | −0.01 | 0.008 | −0.01 | 0.299 | −0.01 | 0.266 |
|
|
|
|
| |
|---|---|---|---|---|
| Total | 243 | 513 | 200 | 139 |
| FT3Q1 | 16.16 (12.93–19.83) | 35.34 (30.99–39.88) | 17.67 (14.31–21.45) | 11.64 (8.86–4.91) |
| FT3Q2 | 13.36 (10.35–16.86) | 30.51 (26.28–35.00) | 11.36 (8.58–14.66) | 8.24 (5.87–11.18) |
| FT3Q3 | 14.75 (11.64–18.32) | 25.6 (21.67–29.83) | 8.03 (5.71–10.89) | 7.38 (5.16–10.15) |
| FT3Q4 | 8.91 (6.44–11.93) | 20.94 (17.26–25.00) | 6.68 (4.55–9.40) | 3.12 (1.71–5.18) |
|
| −2.85 | −5.11 | −5.57 | −4.75 |
|
| 0.004 | < 0.001 | < 0.001 | < 0.001 |
| Male | 147 | 269 | 91 | 81 |
| FT3Q1 | 17.53 (13.04–22.81) | 35.06 (29.17–41.31) | 13.55 (9.57–18.41) | 13.15 (9.23–7.96) |
| FT3Q2 | 11.16 (7.54–15.71) | 25.1 (19.86–30.94) | 9.16 (5.90–13.43) | 6.37 (3.69–10.15) |
| FT3Q3 | 15.75 (11.77–20.45) | 19.52 (15.13–24.54) | 6.51 (3.96–9.97) | 7.19 (4.51–10.78) |
| FT3Q4 | 9.18 (6.23–12.91) | 19.3 (15.10–24.09) | 4.75 (2.68–7.71) | 3.48 (1.75–6.14) |
|
| −2.30 | −4.50 | −3.92 | −4.02 |
|
| 0.022 | < 0.001 | < 0.001 | < 0.001 |
| Female | 96 | 244 | 109 | 58 |
| FT3Q1 | 14.55 (10.11–20.01) | 35.68 (29.25–42.51) | 22.54 (17.11–28.74) | 9.86 (6.21–14.68) |
| FT3Q2 | 16.16 (11.32–22.04) | 37.37 (30.61–44.51) | 14.14 (9.61–19.79) | 10.61 (6.69–5.75) |
| FT3Q3 | 13.02 (8.34–19.04) | 36.09 (28.86–43.82) | 10.65 (6.44–16.31) | 7.69 (4.16–12.79) |
| FT3Q4 | 8.27 (4.2–14.32) | 24.81 (17.74–33.04) | 11.28 (6.45–17.92) | 2.26 (4.68–6.45) |
|
| −1.70 | −1.81 | −3.25 | −2.52 |
|
| 0.089 | 0.070 | 0.001 | 0.012 |
|
|
|
| ||||
|---|---|---|---|---|---|---|
|
| OR (95% CI) |
| OR (95% CI) |
| OR (95% CI) |
|
| Model (crude) | 0.43 | < 0.001 | 0.38 | < 0.001 | 0.55 | 0.020 |
| (0.32–0.59) | (0.26–0.56) | (0.33–0.91) | ||||
| Model 1 | 0.63 | 0.008 | 0.63 | 0.032 | 0.67 | 0.153 |
| (0.45–0.89) | (0.41–0.96) | (0.38–1.16) | ||||
| Model 2 | 0.68 | 0.028 | 0.652 | 0.055 | 0.78 | 0.403 |
| (0.48–0.96) | (0.42–1.01) | (0.44–1.39) | ||||
|
| ||||||
| Model (crude) | 3.31 | < 0.001 | 2.93 | < 0.001 | 4.36 | 0.002 |
| (2.04–5.37) | (1.65–5.20) | (1.72–11.08) | ||||
| Model 1 | 2.32 | 0.001 | 1.88 | 0.043 | 3.48 | 0.011 |
| (1.40–3.86) | (1.02–3.48) | (1.33–9.09) | ||||
| Model 2 | 2.26 | 0.002 | 1.83 | 0.056 | 3.29 | 0.016 |
| (1.36–3.78) | (0.99–3.39) | (1.24–8.69) | ||||
|
|
|
|
|
|
|---|---|---|---|---|
| FT3 |
0.814 (0.780–0.847) |
0.821 (0.788–0.852) |
0.007 (0.000–0.014) | 0.04 |
| FT4 |
0.814 (0.780–0.847) |
0.814 (0.780–0.847) |
0.000 (−0.002–0.002) | 0.998 |
| TSH |
0.814 (0.780–0.847) |
0.815 (0.782–0.847) |
0.001 (−0.001–0.002) | 0.268 |
|
|
|
| |
|---|---|---|---|
| Demographic variables | |||
| Age (years) | 60.30 (8.46) | 64.38 (9.29) | < 0.001 |
| Sex | |||
| Male | 426 (68.5%) | 684 (57.0%) | < 0.001 |
| Female | 196 (31.5%) | 517 (43.0%) | |
| BMI (kg/m2) | 25.14 (3.04) | 24.65 (3.15) | 0.002 |
| Smoking status, | 0.005 | ||
| Current | 172 (27.7%) | 252 (21.0%) | |
| Past | 17 (2.7%) | 44 (3.7%) | |
| Alcohol consumption status | 102 (16.4%) | 156 (13.0%) | 0.048 |
| Duration of diabetes (months) | 108 (48–168) | 120 (48–192) | 0.012 |
| Diabetic nephropathy | 178 (28.6%) | 469 (39.1%) | < 0.001 |
| Hypertension | 359 (57.7%) | 744 (62.0%) | 0.08 |
| Sarcopenia | 20 (3.2%) | 119 (9.9%) | < 0.001 |
| Diabetic medication usage | |||
| Metformin | 253 (40.7%) | 466 (38.8%) | 0.438 |
| Pioglitazone | 13 (2.1%) | 30 (2.5%) | 0.586 |
| SGLT2 | 57 (9.2%) | 161 (13.4%) | 0.008 |
|
| 157 (25.2%) | 316 (26.3%) | 0.621 |
| Sulfonylureas | 147 (23.6%) | 293 (24.4%) | 0.718 |
| Repaglinide | 16 (2.6%) | 57 (4.8%) | 0.025 |
| GLP‐1 RAs | 25 (4.0%) | 55 (4.6%) | 0.58 |
| DPP‐4i | 79 (12.7%) | 155 (12.9%) | 0.901 |
| Insulin | 220 (35.4%) | 461 (38.4%) | 0.207 |
| Clinical indicators | |||
| Albumin | 40.73 (3.04) | 39.26 (3.36) | < 0.001 |
| ALT | 22 (15.8–33) | 18 (13–27) | < 0.001 |
| AST | 16 (12–22) | 14.9 (12–20) | < 0.001 |
| Total cholesterol | 4.38 (1.07) | 4.37 (1.12) | 0.847 |
| Serum creatinine | 65.4 (55–79.7) | 68.3 (55.3–85.8) | 0.019 |
| eGFR | 97.86 (86.37–105.22) | 91.98 (73.68–102.3) | < 0.001 |
| Fasting glucose | 7.05 (5.95–8.88) | 7.28 (5.81–9.44) | 0.289 |
| HbA1c % | 8.22 (1.66) | 8.77 (1.99) | < 0.001 |
| Skeletal muscle index | 7.33 (0.89) | 7.08 (0.93) | < 0.001 |
| Handgrip strength | 30.14 (9.36) | 26.93 (9.45) | < 0.001 |
| 6‐m walk test | 1.23 (0.19) | 1.18 (0.20) | < 0.001 |
|
|
|
| ||||
|---|---|---|---|---|---|---|
|
|
|
|
|
|
| |
| Total | ||||||
| Low FT3 | 1.00 | / | 1.00 | / | 1.00 | / |
| / | / | / | ||||
| High FT3 | 0.30 | < 0.001 | 0.46 | 0.003 | 0.52 | 0.015 |
| (0.19–0.49) | (0.27–0.76) | (0.31–0.89) | ||||
| Male | ||||||
| Low FT3 | 1.00 | / | 1.00 | / | 1.00 | / |
| / | / | / | ||||
| High FT3 | 0.34 | < 0.001 | 0.56 | 0.068 | 0.72 | 0.331 |
| (0.19–0.61) | (0.30–1.04) | (0.38–1.39) | ||||
| Female | ||||||
| Low FT3 | 1.00 | / | 1.00 | / | 1.00 | / |
| / | / | / | ||||
| High FT3 | 0.23 | 0.002 | 0.31 | 0.017 | 0.33 | 0.025 |
| (0.09–0.58) | (0.12–0.82) | (0.12–0.87) | ||||
- —Taihu Lake Talent Plan of Wuxi
- —National Key Research and Development Program of China10.13039/501100012166
Peer Reviews
No public reviews on file for this paper yet. If you reviewed it on a platform where reviews are public (OpenReview, ICLR, NeurIPS, ICML), you can paste yours below so the community can read it here.
Videos
No videos yet. Explain this paper in a talk, walkthrough, or lecture? Add one.
Taxonomy
TopicsThyroid Disorders and Treatments · Nutrition and Health in Aging · Bone health and osteoporosis research
1. Introduction
Type 2 diabetes mellitus (T2DM) affects over 500 million adults globally and is projected to reach approximately 800 million by 2045 [1]. Sarcopenia, the progressive loss of muscle mass and function, develops earlier and progresses faster in individuals with diabetes than in those without; meta‐analyses confirm higher prevalence and risk [2–6]. It contributes not only to frailty and disability but also to falls, fractures, cardiovascular complications, and increased mortality [6–10]. Coexisting sarcopenia and osteoporosis further elevate fracture risk [9, 10], reinforcing the need for early detection in patients with T2DM.
Thyroid hormones are central to energy metabolism and skeletal muscle regulation [11]. Altered thyroid function correlates with changes in body composition, muscle strength, and mobility [12, 13]. In euthyroid populations, findings are inconsistent: Some studies link lower free triiodothyronine (FT3) level or reduced FT3‐to‐free thyroxine (FT4) ratio to decreased muscle mass or higher sarcopenia risk [13–16]; others report no association [17]. Among key thyroid markers (FT3, FT4, and thyroid‐stimulating hormone [TSH]), emerging evidence suggests that FT3 may be most relevant to muscle health [13–15], though comparative analyses across markers remain limited.
Evidence is even scarcer in T2DM cohorts. A few small‐scale Asian studies have suggested associations between low FT3 or low FT3/FT4 ratio and sarcopenia [18–21], but sample sizes were limited and findings inconsistent. Biological sex differences (in thyroid physiology, body composition, and hormonal milieu) may drive sex‐specific sarcopenia risk patterns. However, few studies have formally tested sex‐stratified associations between thyroid hormone levels and sarcopenia in T2DM [20, 21]. This represents an important gap, as understanding sex‐specific effects could refine risk stratification and personalized interventions.
Beyond identifying the associations, it remains unclear whether thyroid markers significantly enhance sarcopenia risk prediction in T2DM. No large studies have evaluated FT3′s incremental predictive value using statistical metrics such as the area under the receiver operating characteristic curve (AUROC), net reclassification improvement (NRI), and integrated discrimination improvement (IDI) [15–17]. Addressing this gap is crucial because biomarkers with predictive utility can enhance clinical screening.
Therefore, in this cross‐sectional study, we aimed to systematically evaluate the association of FT3, FT4, and TSH levels with sarcopenia (per Asian Working Group for Sarcopenia 2019 criteria) [22]. Specifically, we examined the following: (1) whether FT3 is independently associated with sarcopenia and muscle function; (2) whether these associations differ by sex; and (3) whether FT3 adds predictive value for sarcopenia risk beyond established risk factors.
2. Materials and Methods
2.1. Study Participants
This retrospective study initially screened 2086 patients with T2DM admitted to the Department of Endocrinology at Nanjing First Hospital between May 2019 and October 2023. Eligible participants were aged ≥ 45 years and met the diagnostic criteria of the American Diabetes Association [23], defined as follows: (1) glycated hemoglobin (HbA1c) ≥ 6.5*%*; (2) fasting plasma glucose ≥ 7.0 mmol/L; (3) a prior clinical diagnosis of diabetes; or (4) current use of antidiabetic medications. The exclusion criteria were as follows: (1) severe cardiac, hepatic, or renal disease, or major complications (e.g., cancer and cerebrovascular events); (2) history of thyroid surgery, subacute thyroiditis, or confirmed thyroid disorders (hyperthyroidism, hypothyroidism, or Hashimoto′s thyroiditis; n = 42); (3) acute infection or inflammation; and (4) incomplete clinical or laboratory data (n = 221).
After exclusions, 1823 patients (1110 men and 713 women) were included in the final analysis. Ethical approval was waived as the study used deidentified, retrospectively collected data.
2.2. Definitions and Measurements
Sarcopenia was defined per AWGS 2019 criteria [22]: low muscle mass plus either low muscle strength or poor physical performance. Appendicular skeletal muscle mass (ASM) was obtained from the segmental analysis of the multifrequency bioelectrical impedance device (BIA; InBody 770, InBody Co., Seoul, Korea) and as the sum of the lean mass of both arms and both legs (kilogram). The appendicular skeletal muscle mass index (ASMI) was calculated as ASM/height^2^ (kilogram per square meter), with low muscle mass defined according to AWGS 2019 cutoffs (< 7.0 kg/m^2^ for men and < 5.7 kg/m^2^ for women). Handgrip strength was measured twice per hand using a handheld dynamometer (CAMRY EH101, Xiangshan, China); maximum value was recorded, with cutoffs < 28 kg for men and < 18 kg for women. Physical performance was assessed using gait speed over a 6‐m walk at usual pace, with the faster of the two trials recorded; the cutoff value was < 1.0 m/s.
Fasting venous blood (collected in the morning and drawn within 24 h of admission) was used to measure FT3, FT4, TSH, and other biomarkers. All analyses were performed at the hospital′s central laboratory. Thyroid function indicators were determined using chemiluminescence immunoassay (reference ranges: FT3, 3.1–6.8 pmol/L; FT4, 12.0–22.0 pmol/L; and TSH, 0.27–4.20 mIU/L).
Demographic and clinical data (age, sex, smoking/alcohol use, diabetes duration, height, weight, HbA1c, and renal/hepatic function) were extracted from medical records. Additional covariates included diabetic nephropathy (urinary albumin‐to‐creatinine ratio > 30 mg/g or 24‐h urinary albumin excretion > 30 mg) and medication use (insulin and α‐glucosidase inhibitors). All participants had an estimated glomerular filtration rate (eGFR) above 30 mL/min/1.73 m^2^, and those receiving dialysis were excluded.
2.3. Statistical Analysis
Continuous variables were expressed as mean ± standard deviation or median (interquartile range), and categorical variables were expressed as frequencies (percentages). Group comparisons were performed using independent t‐tests or Mann–Whitney U test for continuous variables and χ ^2^ test for categorical variables. To assess linear trends across ordered FT3 categories, the Cochran–Armitage test and STATA’s “nptrend” command were applied. Statistical significance was set at p < 0.05.
Multivariable linear regression models were used to examine the associations between thyroid function indicators (FT3, FT4, and TSH) and continuous muscle parameters, including ASMI, handgrip strength, and 6‐m gait speed. Logistic regression models were used to evaluate the association between thyroid function and sarcopenia. Thyroid hormones were analyzed as continuous variables, and relevant categorical variables were constructed based on data‐driven cutoffs. Models were adjusted for age, sex, duration of diabetes, body mass index (BMI), HbA1c, diabetic nephropathy, and medication use (insulin and α‐glucosidase inhibitors).
To minimize residual confounding factors, covariates were selected based on clinical relevance and preliminary statistical testing. Univariate logistic regression analyses showed only α‐glucosidase inhibitors and insulin were significantly associated with sarcopenia; these were retained in fully adjusted models. Additionally, HbA1c was included as a marker of long‐term glycemic control. Final models adjusted for core confounders (age, sex, diabetes duration, BMI, and nephropathy), ensuring comprehensive yet parsimonious control.
To assess discriminative ability, receiver operating characteristic (ROC) curves and the area under the curve (AUC) were calculated. The optimal FT3 cutoff was determined using the Youden index, with corresponding sensitivity and specificity reported. Incremental predictive value beyond conventional covariates was evaluated by calculating the change in the area under the receiver operating characteristic curve (ΔAUROC), NRI, and IDI. Regression results were presented as β coefficients with standard errors for linear models and odds ratios (ORs; with 95% confidence intervals [CIs]) for logistic models. All statistical analyses were performed using STATA Version 17 (StataCorp LLC, College Station, TX, United States) for descriptive statistics, regression modeling, and trend analyses. R Version 4.2.1 (R Foundation for Statistical Computing, Vienna, Austria) was used for ROC curve analysis, incremental predictive metrics (ΔAUROC, NRI, and IDI), and data visualization.
3. Results
3.1. Baseline Characteristics of the Study Population
In total, 1823 patients with T2DM were included (1110 men and 713 women). Women were older than men; however, their BMI and HbA1c levels did not differ significantly. Men were more likely to smoke and consume alcohol, had higher serum creatinine and liver enzyme levels, and more often used insulin or α‐glucosidase inhibitors. Women had higher total cholesterol and more frequent use of metformin, sulfonylureas, and GLP‐1 receptor agonists. Thyroid function profiles also differed by sex, with men having higher FT3 and FT4 levels and women having higher TSH levels. Muscle parameters (ASMI, handgrip strength, and gait speed) were lower in women, yet sarcopenia prevalence was similar between the sexes (7.3% vs. 8.1%, p = 0.511) (Table 1).
3.2. Associations of Thyroid Hormones With Muscle Parameters
In linear regression analyses, higher FT3 was positively associated with ASMI in the unadjusted and partially adjusted models, but this attenuated following full adjustment (Table 2). FT3 remained significantly associated with handgrip strength after adjustment (Table 3), while its association with gait speed weakened and lost significance (Table 4). In contrast, FT4 was inversely associated with ASMI and positively associated with gait speed in women, whereas TSH was positively associated with ASMI but showed no consistent association with strength or performance. A significant sex interaction was observed for FT3 on handgrip strength (p = 0.006), but not for ASMI or gait speed. Furthermore, ROC analysis demonstrated that FT3 had the strongest discriminatory ability for sarcopenia among the thyroid hormones (AUROC = 0.633), whereas FT4 and TSH showed no discriminative value (AUROC = 0.50). For the sarcopenia components, FT3 achieved AUROCs of 0.561 for low muscle mass, 0.586 for low strength, and 0.628 for low gait speed (Figures 1a, 1b, and 1c).
Figure 1ROC analysis of thyroid hormones for sarcopenia and its components. (a) Assessment of low skeletal muscle mass: AUC values: FT3 = 0.561, FT4 = 0.538, and TSH = 0.512. (b) Assessment of low muscle strength: AUC values: FT3 = 0.586, FT4 = 0.525, and TSH = 0.522. (c) Assessment of low physical performance: AUC values: FT3 = 0.628, FT4 = 0.523, and TSH = 0.572. (d) Diagnosis of sarcopenia: AUC values: FT3 = 0.633, FT4 = 0.501, and TSH = 0.500.(a)(b)(c)(d)
3.3. Prevalence of Sarcopenia Across FT3 Quartiles
When stratified by FT3 quartiles, the prevalence of sarcopenia and its components decreased significantly with increasing FT3 levels in the total population (all p < 0.004). Among men, all four outcomes (low muscle mass, low strength, low gait speed, and sarcopenia) significantly decreased (all p < 0.022). Among women, significant trends were observed for low gait speed and sarcopenia, while the associations between low muscle mass and low strength were borderline (Table 5). ROC analysis further identified an optimal FT3 cutoff of 3.62 pmol/L for sarcopenia detection, corresponding to a sensitivity of 85.6% and a specificity of 35.7% (Figure 1d).
3.4. Associations of FT3 With Sarcopenia Risk and Model Performance
In logistic regression, higher FT3 (continuous variable) was independently associated with lower sarcopenia odds in the total population (Model 2: OR = 0.68; 95% CI, 0.48–0.96; p = 0.028; (Table 6). Similar patterns were observed in men (OR = 0.65, p = 0.055) and women (OR = 0.78, p = 0.403), although the association was not significant in the sex‐stratified models. When categorized, low FT3 was associated with higher sarcopenia risk (total population: OR = 2.26; 95% CI, 1.36–3.78; p = 0.002), with stronger associations in women (OR = 3.29; 95% CI, 1.24–8.69; p = 0.016) than in men (OR = 1.83, p = 0.056). Notably, no significant FT3 × sex interaction was detected (Table 6).
To further assess predictive performance, we compared confounder‐adjusted models with and without thyroid hormones. Adding FT3 significantly improved discrimination, increasing AUROC from 0.814 to 0.821 (ΔAUROC = 0.007; 95% CI, 0.000–0.014; p = 0.04; (Table 7), whereas FT4 and TSH did not significantly alter AUROC. Reclassification analyses confirmed that continuous FT3 provided a modest incremental value with significant improvement at the 25th percentile risk threshold (NRI = 0.032; p = 0.009), although the overall category‐free NRI and IDI were not statistically significant (Table S1).
3.5. Clinical Characteristics and Risk of Sarcopenia by FT3 Cutoff
Stratified by the ROC‐derived FT3 cutoff (3.62 pmol/L), patients in the low‐FT3 group were older, had lower BMI, worse renal function (higher creatinine and lower eGFR), lower serum albumin, higher HbA1c, and poorer muscle measures (ASMI, handgrip strength, and gait speed). Sarcopenia prevalence was also markedly higher in the low FT3 group than in the high FT3 group (9.9% vs. 3.2%; (Table 8).
In multivariable logistic regression, high FT3 (≥ 3.62 pmol/L) significantly correlated with lower sarcopenia risk in the cohort (Model 2: OR = 0.52; 95% CI, 0.31–0.89; p = 0.015; (Table 9). Stratified analyses indicated significance in women (OR = 0.33; 95% CI, 0.12–0.87; p = 0.025) but not in men (OR = 0.64; 95% CI, 0.31–1.30; p = 0.220; (Table 9). The corresponding forest plots depict these associations: Figure 2a summarizes the overall cohort, and (Figure 2b) displays the sex‐stratified results (men and women analysed side‐by‐side); no significant sex interaction was detected. Reclassification analyses, based on the FT3 cutoff, showed modest incremental values, with significant improvement at the 25th percentile risk threshold (NRI = 0.032, p = 0.009) and borderline significance at the 50th percentile, while overall category‐free NRI and IDI were not significant (Table S2).
Figure 2. Forest plots showing the clinical characteristics associated with high FT3 levels in patients with T2DM. (a) Overall population. (b) Sex‐stratified subgroup analysis (males and females). Odds ratios (OR) and 95% confidence intervals (CI) were calculated to evaluate the associations. Statistical significance is indicated by p values. Sex‐stratified results are shown for illustrative purposes; no significant interaction by sex swas detected.(a)(b)
4. Discussion
This study examined the relationship between thyroid hormone levels and sarcopenia in 1823 patients with T2DM. FT3 emerged as the most informative thyroid marker for sarcopenia and showed the strongest discriminatory value on ROC analysis (AUROC = 0.633), with an exploratory cutoff of 3.62 pmol/L (sensitivity, 72.6% and specificity, 52.1; (Figure 1d), requiring external validation. In the multivariate models, FT3 remained positively associated with handgrip strength, while associations with ASMI and gait speed attenuated after full adjustment (Tables 2, 3, and 4). Higher FT3 levels were independently associated with lower sarcopenia odds, with a trend toward stronger effects in women, although no significant FT3 × sex interactions were detected (Table 6 and Figure 2a,b). Beyond risk association, adding FT3 to a confounder‐adjusted model yielded a statistically significant but modest improvement in discrimination (ΔAUROC = 0.007, p = 0.04; (Table 7); FT4 and TSH showed no benefit. Reclassification metrics showed a significant NRI at the 25th percentile risk threshold (Table S1). Collectively, FT3 may be a potentially relevant biomarker for sarcopenia risk stratification in patients with T2DM, providing a preliminary incremental predictive value over conventional factors (Table S2).
Our findings extend those of previous studies linking thyroid status to muscle health. Experimental and clinical evidence shows that thyroid hormones regulate muscle gene expression, metabolism, and mitochondrial function, thereby shaping skeletal muscle aging [18]. Consistent with Sheng et al. [19], we observed beneficial associations between FT3 and muscle mass/function indices; our results in a larger T2DM cohort align with reports in euthyroid diabetic populations [20, 21]. Notably, quartile analyses showed a stepwise decline in the prevalence of low muscle mass, strength, gait speed, and sarcopenia with increasing FT3 levels (Table 5), suggesting a possible dose–response relationship. Conversely, the ELSA‐Brasil study did not detect associations between thyroid function and sarcopenia in a general population sample [13], possibly owing to differences in population characteristics (community‐dwelling vs. T2DM patients) or methodological approaches, including diagnostic criteria. By incorporating sex stratification and pharmacotherapy covariates and formally testing incremental predictions, our study adds to the literature and provides preliminary evidence regarding the potential clinical utility of FT3 in a high‐risk metabolic context.
Several biological pathways may underlie the FT3–sarcopenia link in T2DM. Hyperglycemia‐related alterations in deiodinase activity, notably reduced type II iodothyronine deiodinase (DIO2), can limit peripheral T4‐to‐T3 conversion and blunt T3‐mediated anabolic signalling in the muscles [24–27]. Lower FT3 levels may reduce GLUT4 expression and impair insulin‐stimulated glucose uptake, thereby promoting muscle atrophy [24, 28, 29]. T3 is also integral to mitochondrial biogenesis and oxidative capacity via PGC‐1α–dependent transcriptional programs; diminished T3 signalling can exacerbate mitochondrial dysfunction and oxidative stress [30, 31], contributing to type I fiber vulnerability observed in T2DM [32]. Additionally, T3 influences fibre‐type specification and remodelling through AMPK–PGC‐1α pathways and mitochondrial biogenesis; reduced T3 may shift fibers toward glycolytic phenotypes and impair regeneration [33–38]. These mechanisms of insulin resistance, mitochondrial dysfunction, and fiber type remodeling provide a coherent biological framework for epidemiological observations.
Clinically, our data suggest that FT3 level may assist in early sarcopenia risk identification in patients with T2DM and complement conventional risk factors in predictive models. The ROC‐derived cutoff (3.62 pmol/L; (Figure 1d) may serve as a preliminary threshold but requires external validation before clinical adoption. Incremental analyses demonstrated statistically significant but modest gains in discrimination and reclassification (ΔAUROC = 0.007; NRI at the 25th percentile; (Table 7); (Tables S1 and S2), supporting potential value for risk enrichment in research settings rather than immediate clinical use. A trend toward stronger associations was observed in women (Table 6) and (Figure 2b), although the interaction by sex was nonsignificant, suggesting a possible sex‐specific susceptibility that merits further study. From a practical perspective, FT3 measurement is inexpensive and widely available, which may facilitate its consideration in future risk stratification strategies once prospective validation is achieved.
This study has several limitations. First, its cross‐sectional design limited its ability to infer causality. Although residual confounding cannot be fully ruled out, we minimized bias by including clinically relevant covariates identified from the univariate screening (Table 9). Information on nutrition and physical activity was unavailable, and thyroid function was assessed at a single time point, which may not fully reflect long‐term hormone status. Muscle mass was measured using BIA rather than DXA; however, BIA was validated against DXA and is recommended by the AWGS 2019 for both clinical and epidemiological applications. Finally, the participants were recruited from tertiary hospitals in China, and the findings may not be generalisable to other populations; however, the large sample size and standardized measurements enhance the robustness of our conclusions. Future research should include multicentre longitudinal cohorts, external validation of FT3‐based prediction models with clinically meaningful thresholds, and mechanistic studies on deiodinase activity, mitochondrial bioenergetics, and muscle fiber remodeling in T2DM.
5. Conclusion
Lower FT3 levels are associated with higher sarcopenia risk in T2DM, with a trend toward stronger associations in women. FT3 showed the strongest discriminatory performance among the thyroid hormones and may be a useful biomarker for early risk identification, pending external validation. Incorporating FT3 into the confounder‐adjusted models yielded statistically significant but modest improvements in model performance, indicating a preliminary incremental predictive value beyond that of conventional factors. Prospective multicentre studies are warranted to confirm these findings, establish temporal relationships, and evaluate FT3′s predictive and clinical utility in sarcopenia risk stratification.
Conflicts of Interest
The authors declare no conflicts of interest.
Funding
This work was supported by the National Key Research and Development Program of China, (Grant No. 2018YFC1314100), and the Taihu Lake Talent Plan of Wuxi, No. Y20242106.
Supporting information
Supporting Information Additional supporting information can be found online in the Supporting Information section. Tables S1 and S2: The reclassification analyses (NRI and IDI) for thyroid function indicators.
The reference list from the paper itself. Each links out to its DOI / PubMed record.
- 1Sun H. , Saeedi P. , Karuranga S. , Pinkepank M. , Ogurtsova K. , Duncan B. B. , Stein C. , Basit A. , Chan J. C. N. , Mbanya J. C. , Pavkov M. E. , Ramachandaran A. , Wild S. H. , James S. , Herman W. H. , Zhang P. , Bommer C. , Kuo S. , Boyko E. J. , and Magliano D. J. , IDF Diabetes Atlas: Global, Regional and Country-Level Diabetes Prevalence Estimates for 2021 and Projections for 2045, Diabetes Research and Clinical Practice. (2022) 183, 109119, 10.1016 · doi ↗ · pubmed ↗
- 2Yang Q. and Chan P. , Skeletal Muscle Metabolic Alternation Develops Sarcopenia, Aging and Disease. (2022) 13, no. 3, 801–814, 10.14336/AD.2021.1107, 35656108.35656108 PMC 9116905 · doi ↗ · pubmed ↗
- 3Wells C. E. , Polkey M. I. , and Baker E. H. , Insulin Resistance Is Associated With Skeletal Muscle Weakness in COPD, Respirology. (2016) 21, no. 4, 689–696, 10.1111/resp.12716, 2-s 2.0-84951802391, 26678022.26678022 · doi ↗ · pubmed ↗
- 4Meex R. C. R. , Blaak E. E. , and van Loon L. J. C. , Lipotoxicity Plays a Key Role in the Development of Both Insulin Resistance and Muscle Atrophy in Patients With Type 2 Diabetes, Obesity Reviews. (2019) 20, no. 9, 1205–1217, 10.1111/obr.12862, 2-s 2.0-85068313733, 31240819.31240819 PMC 6852205 · doi ↗ · pubmed ↗
- 5Tack W. , De Cock A. M. , Dirinck E. L. , Bastijns S. , Ariën F. , and Perkisas S. , Pathophysiological Interactions Between Sarcopenia and Type 2 Diabetes: A Two-Way Street Influencing Diagnosis and Therapeutic Options, Diabetes, Obesity & Metabolism. (2024) 26, no. 2, 407–416, 10.1111/dom.15321.37854007 · doi ↗ · pubmed ↗
- 6Qiao Y. S. , Chai Y. H. , Gong H. J. , Zhuldyz Z. , Stehouwer C. D. A. , Zhou J. B. , and Simó R. , The Association Between Diabetes Mellitus and Risk of Sarcopenia: Accumulated Evidences From Observational Studies, Front Endocrinol (Lausanne).(2021) 12, 782391, 10.3389/fendo.2021.782391, 35002965.35002965 PMC 8734040 · doi ↗ · pubmed ↗
- 7Fang Z. Y. , Sharman J. , Prins J. B. , and Marwick T. H. , Determinants of Exercise Capacity in Patients With Type 2 Diabetes, Diabetes Care. (2005) 28, no. 7, 1643–1648, 10.2337/diacare.28.7.1643, 2-s 2.0-24944502354.15983314 · doi ↗ · pubmed ↗
- 8Boonpor J. , Pell J. P. , Ho F. K. , Celis-Morales C. , and Gray S. R. , In People With Type 2 Diabetes, Sarcopenia Is Associated With the Incidence of Cardiovascular Disease: A Prospective Cohort Study From the UK Biobank, Diabetes, Obesity & Metabolism. (2024) 26, no. 2, 524–531, 10.1111/dom.15338, 37881162.37881162 · doi ↗ · pubmed ↗