Clinical Characteristics of Patients With Advanced Hepatocellular Carcinoma Who Transitioned to Subsequent Therapies Following Systemic Therapy
Kenji Imai, Koji Takai, Masashi Aiba, Shinji Unome, Takao Miwa, Tatsunori Hanai, Hiroyasu Sakai, Yohei Shirakami, Atsushi Suetsugu, Masahito Shimizu

TL;DR
This study identifies factors that help patients with advanced liver cancer move to additional treatments after first-line therapy.
Contribution
The study identifies clinical factors associated with transitioning to subsequent therapies in advanced hepatocellular carcinoma patients.
Findings
Patients with better ALBI scores, earlier TNM stages, and ICI treatment were more likely to transition to subsequent therapies.
Initiating systemic therapy before progression and preserving liver function improves chances of further treatment.
ALBI score, ICI use, and TNM stage were significant predictors of transitioning to second-line therapies.
Abstract
This study aimed to clarify the clinical characteristics of patients with advanced hepatocellular carcinoma (HCC) who transitioned to subsequent therapies following systemic therapy (ST). In total, 136 patients with unresectable HCC (26 hepatitis B, 47 hepatitis C and 63 others) receiving first‐line ST, including 31 patients treated with immune checkpoint inhibitors (ICIs), were enrolled. Clinical characteristics and adverse events observed during treatment, as well as overall survival (OS), progression‐free survival and post progression survival (PPS), were compared between patients who transitioned to subsequent therapies (2nd therapy group, n = 66) and those who did not (non‐2nd therapy group, n = 70). Significant differences between the two groups were observed in OS (29.3 vs. 10.7 months, p < 0.001), PPS (11.3 vs. 2.9 months, p < 0.001), ALBI score (−2.48 vs. −2.34, p = 0.018),…
Genes, proteins, chemicals, diseases, species, mutations and cell lines named across the full text — each resolved to its canonical identifier and authoritative record.
Click any figure to enlarge with its caption.
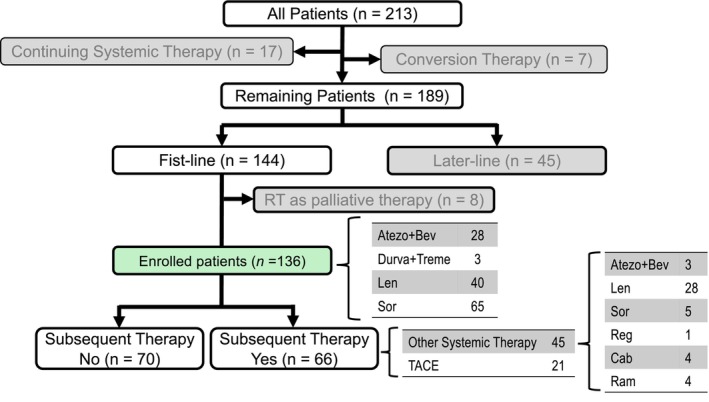 FIGURE 1
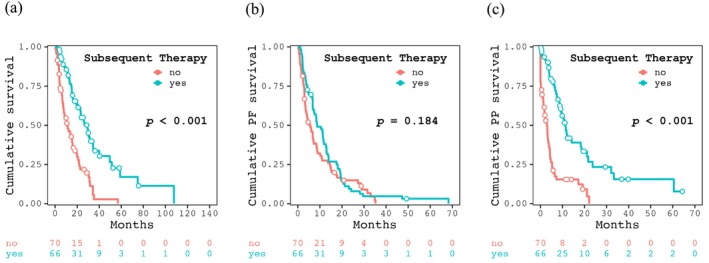 FIGURE 2
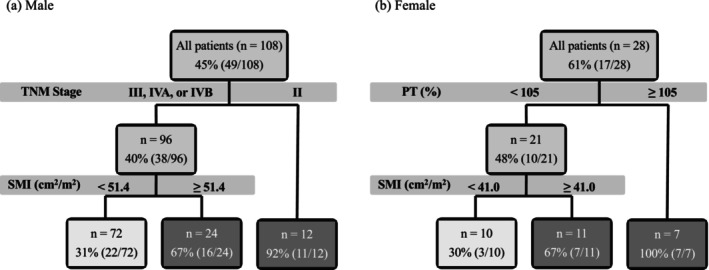 FIGURE 3
| All patients ( | 2nd therapy group ( | Non‐2nd therapy group ( |
| |
|---|---|---|---|---|
| Age (years) | 73 [66, 78] | 74 [66, 79] | 72 [65, 78] | 0.270 |
| ECOG PS (0/1/2) | 105/22/9 | 53/11/2 | 52/11/7 | 0.312 |
| Sex (male/female) | 108/28 | 49/17 | 59/11 | 0.203 |
| Etiology (HBV/HCV/others) | 26/47/63 | 15/21/30 | 11/26/33 | 0.574 |
| BMI (kg/m2) | 22.9 [20.4, 24.9] | 22.9 [19.9, 25.0] | 22.9 [20.9, 24.8] | 0.678 |
| SMI (cm2/m2) | 43.0 [38.8, 49.1] | 44.3 [38.7, 52.5] | 42.1 [39.5, 47.0] | 0.200 |
| SATI (cm2/m2) | 36.8 [24.1, 51.8] | 37.3 [24.8, 52.6] | 35.4 [22.7, 50.0] | 0.596 |
| VATI (cm2/m2) | 43.0 [25.2, 59.6] | 49.1 [31.9, 60.4] | 39.8 [21.0, 57.3] | 0.111 |
| ALBI score | −2.43 [−2.77, −2.14] | −2.48 [−2.82, −2.25] | −2.34 [−2.74, −1.99] | 0.018 |
| Previous treatment (yes/no) | 119/17 | 59/7 | 60/10 | 0.792 |
| Combination treatment (yes/no) | 83/63 | 23/43 | 30/40 | 0.382 |
| 1st line therapy (Atezo + Bev/Durva + Treme/Len/Sor) | 28/3/40/65 | 21/3/21/21 | 7/0/19/44 | < 0.001 |
| 1st line therapy (with ICI/without ICI) | 31/105 | 24/42 | 7/63 | < 0.001 |
| Duration of 1st line therapy (month) | 5.3 [1.8, 12.6] | 5.9 [1.9, 13.0] | 5.0 [1.8, 12.0] | 0.664 |
| TNM stage (II/III/IVA/IVB) | 18/53/17/48 | 15/26/7/18 | 3/27/10/30 | 0.008 |
| BCLC stage (A/B/C) | 8/56/72 | 6/31/29 | 2/25/43 | 0.075 |
| AFP (ng/mL) | 96 [8, 1446] | 52 [16, 1352] | 176 [16, 1470] | 0.149 |
| PIVKA‐II (×103 mAU/mL) | 571 [56, 3111] | 474 [58, 2357] | 829 [59, 6842] | 0.206 |
| Best treatment response (CR/PR/SD/PD/NE) | 6/24/45/56/5 | 4/16/22/23/1 | 2/8/23/33/4 | 0.230 |
| Follow up period (month) | 13.9 [5.8, 25.6] | 18.4 [10.2, 30.3] | 8.5 [4.1, 17.7] | < 0.001 |
| 2nd therapy group ( | Non‐2nd therapy group ( |
| |
|---|---|---|---|
| General fatigue (0/1/≥ 2) | 40/12/14 | 34/8/28 | 0.058 |
| Appetite loss (0/1/≥ 2) | 42/9/15 | 28/9/33 | 0.009 |
| Diarrhea (0/1/≥ 2) | 50/13/3 | 53/10/7 | 0.411 |
| Hypothyroidism (0/1/≥ 2) | 52/5/9 | 64/2/4 | 0.119 |
| Hand‐foot syndrome (0/1/≥ 2) | 47/7/12 | 54/6/10 | 0.775 |
| Proteinuria (0/1/≥ 2) | 45/8/13 | 63/2/5 | 0.006 |
| Hypertension (0/1/≥ 2) | 40/2/24 | 52/2/16 | 0.233 |
| Bleeding (0/1/≥ 2) | 61/3/2 | 63/2/5 | 0.590 |
| 2nd therapy group ( | Non‐2nd therapy group ( | |||||
|---|---|---|---|---|---|---|
| Introduction | End of treatment |
| Introduction | End of treatment |
| |
| SMI (cm2/m2) | 44.3 [38.7, 52.5] | 41.8 [36.0, 50.2] | 0.023 | 42.1 [39.5, 47.0] | 39.6 [33.5, 43.1] | < 0.001 |
| SATI (cm2/m2) | 37.3 [24.8, 52.6] | 30.7 [19.6, 48.0] | 0.029 | 35.4 [22.7, 50.0] | 35.0 [8.9, 43.7] | < 0.001 |
| VATI (cm2/m2) | 49.1 [31.9, 60.4] | 40.7 [22.9, 57.6] | 0.003 | 39.8 [21.0, 57.3] | 30.8 [18.6, 53.2] | 0.027 |
| ALBI score | −2.48 [−2.82, −2.25] | −2.19 [−2.50, −1.82] | < 0.001 | −2.35 [−2.75, −1.99] | −1.76 [−2.14, −1.25] | < 0.001 |
| AFP (ng/mL) | 52 [6, 1352] | 126 [9, 1808] | 0.053 | 176 [16, 1470] | 532 [80, 8053] | 0.005 |
| PIVKA‐II (mAU/mL) | 474 [58, 2357] | 1459 [103, 11,248] | < 0.005 | 829 [59, 6842] | 13,459 [753, 60,881] | < 0.001 |
| Univariate analysis | Multivariate analysis | |||
|---|---|---|---|---|
| Odds ratio (95% CI) |
| Odds ratio (95% CI) |
| |
| Age (years) | 0.98 (0.95–1.02) | 0.325 | ||
| ECOG PS | 0.68 (0.37–1.23) | 0.199 | ||
| Sex (Female vs. Male) | 0.54 (0.23–1.25) | 0.151 | ||
| Etiology | 0.56 | |||
| HBV | Reference | |||
| HCV | 0.59 (0.23–1.56) | 0.289 | ||
| Others | 0.67 (0.27–1.68) | 0.389 | ||
| SMI (cm2/m2) | 1.03 (0.99–1.07) | 0.143 | ||
| SATI (cm2/m2) | 1.00 (0.99–1.02) | 0.477 | ||
| VATI (cm2/m2) | 1.01 (0.99–1.03) | 0.156 | ||
| ALBI score | 0.35 (0.16–0.77) | 0.009 | 0.28 (0.11–0.69) | 0.005 |
| Drug (with ICI vs. without ICI) | 5.14 (2.03–13.0) | < 0.001 | 4.65 (1.72–12.6) | 0.002 |
| TNM stage | 0.007 | 0.027 | ||
| II | Reference | Reference | ||
| III | 0.19 (0.05–0.74) | 0.017 | 0.20 (0.05–0.86) | 0.031 |
| IV (A or B) | 0.12 (0.03–0.45) | 0.002 | 0.14 (0.03–0.59) | 0.007 |
| AFP (ng/mL) (per 1000 unit) | 0.98 (0.95–1.01) | 0.253 | ||
| PIVKA‐II (mAU/mL) (per 1000 unit) | 1.00 (0.99–1.00) | 0.970 | ||
Peer Reviews
No public reviews on file for this paper yet. If you reviewed it on a platform where reviews are public (OpenReview, ICLR, NeurIPS, ICML), you can paste yours below so the community can read it here.
Videos
No videos yet. Explain this paper in a talk, walkthrough, or lecture? Add one.
Taxonomy
TopicsHepatocellular Carcinoma Treatment and Prognosis · Cancer Immunotherapy and Biomarkers · Cancer Mechanisms and Therapy
Introduction
1
Hepatocellular carcinoma (HCC) is the most common primary liver cancer, with an estimated 957,000 new cases diagnosed worldwide and 830,200 deaths reported in 2020 [1, 2]. Systemic therapy (ST) is currently indicated in patients with unresectable HCC who are ineligible for local therapy [3]. STs for HCC can be broadly categorized into two groups [3]. The first group comprises immune checkpoint inhibitors (ICIs), which include programmed cell death ligand 1 inhibitors (atezolizumab [Atezo] and durvalumab [Durva]) and cytotoxic T‐lymphocyte‐associated protein 4 inhibitors (tremelimumab [Treme]). The second group includes anti‐angiogenic targeted therapies, such as sorafenib (Sor), lenvatinib (Len), regorafenib (Reg), cabozantinib (Cab), bevacizumab (Bev) and ramucirumab (Ram). According to the latest guidelines for HCC [3, 4, 5], STs with Atezo + Bev or Durva + Treme are the preferred first‐line options, while the others are considered later‐line therapies.
Significant advances in STs have greatly improved the prognosis of patients with unresectable HCC. However, in phase III clinical trials, the complete response (CR) rate for these STs alone has been reported to be remarkably low, ranging from 0% to 6.0%, while the percentage of patients who discontinued treatment due to disease progression, adverse events, or clinical deterioration during the trial was extremely high, ranging from 57.8% to 94.4% [6, 7, 8, 9, 10, 11, 12]. Thus, the effect of initial ST alone is inadequate, highlighting the importance of a prompt transition to subsequent therapies for improving treatment outcomes. Furthermore, while the prognosis of patients for whom subsequent therapy is considered unrealistic is expected to be extremely poor, the clinical characteristics facilitating a smooth transition to subsequent therapies in patients with advanced HCC receiving ST remain unclear.
This study aimed to identify the clinical factors associated with a successful transition to subsequent therapies by comparing patients with unresectable advanced HCC who received ST and transitioned to subsequent therapies with those who did not.
Methods
2
Patients and Treatment Strategy
2.1
Between May 2009 and December 2023, 213 patients with HCC received ST at Gifu University Hospital. Of these, seven patients achieved CR after conversion therapy; 17 were still receiving ST at the end of the study period. Of the remaining 189 patients, first‐line ST was administered to 144 patients and later‐line to 45. Out of the 144 patients, this study included a total of 136 cases in which ST was initiated as first‐line therapy, excluding eight cases in which radiotherapy was subsequently added for palliative purposes. The patient flow chart for this study is presented in Figure 1. Drugs were selected based on the guidelines for ST of HCC [3, 4, 5]. Dynamic CT or MRI was performed at the initiation of ST and the therapeutic response was evaluated using these imaging modalities every 3–6 months based on physician judgment.
Patients flow in this study. Atezo, atezolizumab; Bev, bevacizumab; Cab, cabozantinib; Durva, durvalumab; Len, lenvatinib; Ram, ramucirumab; Reg, regorafenib; Sor, sorafenib; Treme, tremelimumab.
Patients enrolled in this study were informed about the study details and given the opportunity to withdraw their participation. The study design, including the informed consent procedure, was approved by the Ethics Committee of Gifu University School of Medicine on 13 February 2024 (Ethical Protocol Code: 2023–283).
Comparison of Cases That Transitioned to Subsequent Therapies and Those That Did Not
2.2
Among the enrolled patients, 66 transitioned to subsequent therapies (2nd therapy group) because of progressive disease (PD) (n = 33), adverse events (AEs) (n = 19), worsening hepatic reserve (n = 4), patient preference (n = 1), or others (n = 9), including 45 to other STs (Atezo+Bev/Len/Sor/Reg/Ram/Cab = 3/28/5/1/4/4) and 21 to transcatheter arterial chemoembolization (TACE) performed exclusively for salvage purposes rather than palliative intent. Subsequent therapy was chosen based on HCC clinical guidelines [3, 4, 5], similar to the selection of first‐line ST. The remaining 70 (non‐2nd therapy group) did not transition because of a decline in their general condition (n = 38), AEs (n = 17), worsening hepatic reserve (n = 9), or patient preference (n = 6). (Figure 1). All patients in the non‐2nd therapy group transitioned to best supportive care after discontinuation of first‐line ST. Baseline demographic and clinical characteristics of the enrolled patients at the time of ST initiation, AEs, treatment responses observed during treatment and clinical outcomes, including overall survival (OS) and progression‐free survival (PFS) and post progression survival (PPS) were compared between the two groups.
The skeletal muscle index (SMI; cm^2^/m^2^), subcutaneous adipose tissue index (SATI; cm^2^/m^2^) and visceral adipose tissue index (VATI; cm^2^/m^2^) were calculated as previously described [13]. AEs were graded according to the Common Terminology Criteria for Adverse Events (CTCAE), version 5.0. The treatment response was assessed according to the modified RECIST Criteria for Solid Tumors [14]. OS and PFS were defined as the interval from the date of initiation of ST to the date of death or PD, respectively. If these events did not occur, they were defined as the last observation day.
Statistical Analyses
2.3
Baseline demographic and clinical characteristics were compared between the 2nd and non‐2nd therapy groups using the Mann–Whitney U test for continuous variables and Fisher's exact test for categorical variables. Survival was estimated using the Kaplan–Meier method and differences between survival curves were assessed with the log‐rank test. Chronologic changes from baseline to end of treatment in SMI, SATI, VATI, α‐fetoprotein (AFP), protein induced by vitamin K absence or antagonist‐II (PIVKA‐II) and ALBI scores were analyzed using the Wilcoxon paired test. Odds ratios for transitioning to subsequent therapies were analyzed using logistic regression. Factors identified as significant in the univariate analysis were included in a multivariate analysis. In addition, classification tree analysis was performed to comprehensively examine clinical characteristics associated with higher transition rates to subsequent therapies, stratified by sex. All analyses were conducted using R software version 4.4.1, with the packages, ‘Rcmdr’, ‘RcmdrPlugin. EZR’, ‘rpart’, ‘rpart. plot’ and ‘ggplot2’ (R Foundation for Statistical Computing, Vienna, Austria; http://www.R‐project.org/ [accessed on 22 August 2024]).
Results
3
Baseline Clinical Characteristics and Treatment Course of the Enrolled Patients
3.1
For the 136 enrolled patients (108 men; median age 73 years), therapies included Atezo+Bev (28 patients), Durva+Treme (3 patients), Len (40 patients), Sor (65 patients). The median ALBI score was −2.43 and the performance status (PS: 0/1/2) was 105/22/9. The TNM staging (II/III/IVA/IVB) was 18/53/17/48 and the median AFP and PIVKA‐II levels were 96 ng/mL and 571 mAU/L, respectively. Prior treatment was received by 119 patients, while 83 underwent combination therapies during ST. The median treatment was 5.3 months (Table 1).
Comparison Between the 2nd and Non‐2nd Therapy Groups at the Initiation of First‐Line Systemic Therapy
3.2
At the start of first‐line ST, significant differences were observed between the 2nd and non‐2nd therapy group in terms of ALBI score (−2.48 vs.−2.34, p = 0.018), first‐line ST (Atezo + Bev/Durva + Treme/Len/Sor/; 21/3/21/21 vs. 7/0/19/44, p < 0.001), first‐line ST (with ICI/without ICI; 24/42 vs. 7/63, p < 0.001) and TNM classification (II/III/IVA/IVB; 15/26/7/18 vs. 3/27/10/30, p = 0.008). No significant differences were noted in age, sex, liver condition, body composition, prior or combination therapy (Table 1).
Comparison of the Clinical Outcomes and Incidence of AEs Between the 2nd and Non‐2nd Therapy Groups
3.3
Table 1 summarizes the clinical outcomes of patients in the 2nd and non‐2nd therapy groups. The median follow up period in this study was 13.9 [5.8, 25.6] months, with significant difference between the two groups (18.4 [10.2, 30.3] vs. 8.5 [4.1, 17.7] moths, p < 0.001). The median duration of first‐line ST was 5.3 [1.8, 12.6] months and was indistinguishable between the two groups (5.9 [1.9, 13.0] vs. 5.0 [1.8, 12.0] months, p = 0.664). However, the duration was significantly shorter in the ICI‐treated group than in the non‐ICI group (2.7 [1.4, 7.5] vs. 6.3 [2.3, 14.9] months, p = 0.006). The best responses of first line ST (CR/partial response [PR]/stable disease [SD]/PD/not evaluable [NE]), objective response and disease control rates were 4/16/22/23/1, 30.8% and 64.6% for the 2nd therapy group and 2/8/23/33/4, 15.2% and 50.0% for the non‐2nd therapy group. There was no significant difference between the two groups. In the 2nd therapy group, the median duration and the best therapeutic response (CR/PR/SD/PD/NE) in the 45 patients who received ST were 3.2 [1.2, 6.1] months and 1/4/20/18/2, respectively. The OS rates at 1, 2 and 3 years and the median OS were 81.9%, 55.0%, 33.7% and 29.3 months for the 2nd therapy group and 47.9%, 21.9%, 2.8% and 10.7 months for the non‐2nd therapy group (p < 0.001, Figure 2a). The PFS rates were 38.0%, 9.5%, 4.8% and 8.7 months for the 2nd therapy group and 14.9%, 2.2%, 0.0% and 5.6 months for the non‐2nd therapy group (p = 0.184, Figure 2b). The PPS rates were 44.2%, 23.4%, 15.6% and 11.3 months for the 2nd therapy group and 15.4%, 0.0%, 0.0% and 2.9 months for the non‐2nd therapy group (p < 0.001, Figure 2c).
Kaplan–Meier curves for (a) cumulative survival, (b) cumulative progression‐free (PF) survival and (c) cumulative post progression (PP) survival between the patients who transitioned to subsequent therapy and those who did not.
The frequency and severity of AEs that occurred during ST are shown in Table 2. The incidence and severity of appetite loss and proteinuria were significantly higher in the non‐2nd therapy group (p = 0.009 and 0.006, respectively).
Chronological Changes in Body Composition, Liver Functional Reserve and Tumor Markers During Systemic Therapy
3.4
The chronological changes in body composition (SMI, SATI and VATI), liver functional reserve (ALBI score) and tumor markers (AFP and PIVKA‐II) during first‐line ST are shown in Table 3. AFP levels in the 2nd therapy group were the only parameter that did not exhibit a statistically significant change. In contrast, both groups demonstrated a significant decline in body composition and hepatic reserve and a considerable increase in tumor marker levels.
Clinical Characteristics of 2nd Therapy Group Determined by Logistic Regression and Classification Tree Analysis
3.5
Patients with favourable ALBI score (Odds ratio [OR] = 0.28, 95% confidence interval [CI]; 0.11–0.69, p = 0.005), treatment with ICIs (Atezo+Bev or Durva+Treme; OR = 4.65, 95% CI; 1.72–12.6, p = 0.002) and earlier TNM stage (p = 0.027) were found by logistic regression analysis to be more likely to transition to subsequent therapies (Table 4).
Classification tree analysis showed that 92% of men with TNM stage II were classified into the 2nd therapy group, whereas 31% of men with TNM stage III or higher and with an SMI < 51.4 cm^2^/m^2^ were classified into the 2nd therapy group. Additionally, 100% of women with a prothrombin time ≥ 105% were classified into the 2nd therapy group, whereas 30% of women with a prothrombin time < 105% and with an SMI < 41.0 cm^2^/m^2^ were classified into the 2nd therapy group. (Figure 3).
Classification tree analysis results for predicting patient eligibility for transitioning to subsequent therapy. Each node displays the total number of patients within the node and the proportion of those who progressed to subsequent therapy.
Discussion
4
This study demonstrated that patients with advanced HCC who exhibit favourable ALBI scores, earlier TNM stage at the initiation of ST and treatment with Atezo+Bev or Durva+Treme were more likely to progress to subsequent therapies. In addition, although PFS was not significantly different between the two groups, OS and PPS were significantly prolonged in the 2nd therapy group. These findings suggest that the extension of survival duration is primarily attributable to the impact of subsequent therapies rather than the efficacy of first‐line therapy. In this study, achieving CR after starting ST was extremely rare (7/213, 3%) in patients with advanced HCC and most patients (189/206, 92%) were forced to discontinue therapy as previously documented [6, 7, 8, 9, 10, 11, 12]. Therefore, to improve the survival of patients with advanced HCC, initiating ST, including ICIs, when the patient's liver functional reserve is favourable and the clinical cancer is at an earlier stage, ensuring a smoother transition to subsequent therapies, is recommended.
Tumor burden, liver function reserve and PS were included in the Barcelona Clinic Liver Cancer staging system for HCC [3, 5]. However, this study did not identify BCLC stage as a determinant influencing the transition to subsequent therapies. According to this algorithm, ST is indicated for patients at an intermediate stage (multinodular, preserved liver function reserve and PS of 0) and advanced stage (portal invasion and/or extrahepatic spread, preserved liver function reserve and PS of 1–2). As patients with intermediate‐stage disease are also recommended to undergo TACE [3, 5], there is often considerable debate as to whether TACE or ST should be administered to these patients. Considering the risk of liver function deterioration associated with TACE [15] and the results of this study, prioritizing ST in patients with intermediate‐stage HCC may be prudent. Recently, combination therapy with TACE and Len has attracted attention because of its high antitumor efficacy and favourable safety profile [16]. Furthermore, the abscopal effect, which refers to tumor regression outside the radiation field, induced by radiotherapy for advanced HCC may be further enhanced by immune checkpoint inhibitors [17]. Therefore, even after the initiation of ST, active consideration of the combination of TACE and radiotherapy may be beneficial for preserving the liver function reserves and maintaining high antitumor efficacy.
According to previous studies [18, 19, 20], the transition rate to second‐line ST varies widely, ranging from 1.7% to 54.5%, depending on the treatment era and the first‐line systemic agents used. Patients who permanently discontinued Sor had a particularly poor prognosis, with a median survival of only 4.1 months [21]. Our findings, in conjunction with previous research [18, 19, 20, 21], demonstrate that patients who are unable to transition to second‐line ST have a significantly shorter overall survival. This study also demonstrated that ST including ICIs appears to facilitate a more seamless progression to subsequent therapies than other treatment regimens. This may be related to ICIs having a higher antitumor efficacy than other regimens [6, 7]. In addition, Atezo+Bev treatment is reportedly associated with fewer AEs, including decreased appetite and general fatigue, than Len or Sor treatments [22, 23]. Preventing these AEs supports the maintenance of skeletal muscle mass and affects the smooth transition to subsequent therapies during treatment [22, 23]. In particular, as shown in this study, the preservation of skeletal muscle mass in men with TNM stage III or higher and in women with a prothrombin time < 105% is important for the transition to subsequent therapies. Since sarcopenia and rapid loss of skeletal muscle mass are critical prognostic factors in patients with HCC, it is important to consider their impact on muscle mass when choosing ST [24]. Therefore, patients with HCC treated with ICIs who have a low risk of muscle mass loss [22] are expected to have an easier transition to subsequent therapies because of their high antitumor efficacy and lower incidence of AEs that could lead to preservation of skeletal muscle mass. The latest HCC guidelines recommend Atezo + Bev or Durva + Treme as the first‐line therapy [3, 4, 5] and adherence to these guidelines is advisable from the perspective of facilitating a seamless transition to subsequent therapies.
This was a retrospective, single‐center study that had several limitations, including a relatively small sample size. In addition, because many of the treatment regimens evaluated in this study were newly introduced during the observation period, the timing of treatment initiation and agent selection may have evolved, potentially introducing bias into the results. While conducting survival analyses based on the presence or absence of subsequent therapies, there is a potential risk of introducing an immortal time bias. Owing to the inherent susceptibility of classification tree analysis to model instability, careful consideration is necessary when interpreting the results for female participants in this study, given the limited sample size. Prospective studies with larger patient cohorts are required to address these limitations.
In conclusion, among patients with advanced HCC, those with good ALBI scores, early TNM stage at the start of ST and those treated with Atezo + Bev or Durva + Treme were more likely to progress to subsequent therapies. Patients who progressed to subsequent therapies had significantly improved OS compared to those who did not progress; therefore, developing a treatment strategy that recognizes the appropriate progression to subsequent therapies is important.
Author Contributions
Kenji Imai: conceptualization (lead), data curation (lead), formal analysis (lead), investigation (equal), writing – original draft (lead). Koji Takai: investigation (equal), supervision (lead), writing – original draft (supporting), writing – review and editing (equal). Masashi Aiba: investigation (equal), writing – original draft (supporting). Shinji Unome: investigation (equal), writing – original draft (supporting). Takao Miwa: investigation (equal), writing – original draft (supporting). Tatsunori Hanai: investigation (equal), writing – original draft (supporting). Hiroyasu Sakai: investigation (equal), writing – original draft (supporting). Yohei Shirakami: investigation (equal), writing – original draft (supporting). Atsushi Suetsugu: investigation (equal), writing – original draft (supporting). Masahito Shimizu: investigation (equal), supervision (lead), writing – original draft (supporting), writing – review and editing (lead).
Funding
This research received no external funding.
Ethics Statement
Patients enrolled in this study were given the opportunity to opt out with a full disclosure of study details. The study design, including the consent procedure, was approved by the Ethics Committee of Gifu University School of Medicine on February 13, 2024 (ethical protocol code: 2023–283).
Conflicts of Interest
The authors declare no conflicts of interest.
The reference list from the paper itself. Each links out to its DOI / PubMed record.
- 1A. Forner , M. Reig , and J. Bruix , “Hepatocellular Carcinoma,” Lancet 391, no. 10127 (2018): 1301–1314, 10.1016/S 0140-6736(18)30010-2.29307467 · doi ↗ · pubmed ↗
- 2J. Ferlay , M. Colombet , I. Soerjomataram , et al., “Cancer Statistics for the Year 2020: An Overview,” International Journal of Cancer 149, no. 4 (2021): 778–789, 10.1002/ijc.33588.33818764 · doi ↗ · pubmed ↗
- 3A. G. Singal , J. M. Llovet , M. Yarchoan , et al., “AASLD Practice Guidance on Prevention, Diagnosis and Treatment of Hepatocellular Carcinoma,” Hepatology 78, no. 6 (2023): 1922–1965, 10.1097/HEP.0000000000000466.37199193 PMC 10663390 · doi ↗ · pubmed ↗
- 4K. Hasegawa , N. Takemura , T. Yamashita , et al., “Clinical Practice Guidelines for Hepatocellular Carcinoma: The Japan Society of Hepatology 2021 Version (5th JSH‐HCC Guidelines),” Hepatology Research 53, no. 5 (2023): 383–390, 10.1111/HEPR.13892.36826411 · doi ↗ · pubmed ↗
- 5M. Reig , A. Forner , J. Rimola , et al., “BCLC Strategy for Prognosis Prediction and Treatment Recommendation: The 2022 Update,” Journal of Hepatology 76, no. 3 (2022): 681–693, 10.1016/j.jhep.2021.11.018.34801630 PMC 8866082 · doi ↗ · pubmed ↗
- 6R. S. Finn , S. Qin , M. Ikeda , et al., “Atezolizumab Plus Bevacizumab in Unresectable Hepatocellular Carcinoma,” New England Journal of Medicine 382, no. 20 (2020): 1894–1905, 10.1056/nejmoa 1915745.32402160 · doi ↗ · pubmed ↗
- 7G. K. Abou‐Alfa , G. Lau , M. Kudo , et al., “Tremelimumab Plus Durvalumab in Unresectable Hepatocellular Carcinoma,” NEJM Evidence 1, no. 8 (2022): EVI Doa 2100070, 10.1056/evidoa 2100070.38319892 · doi ↗ · pubmed ↗
- 8J. M. Llovet , S. Ricci , V. Mazzaferro , et al., “Sorafenib in Advanced Hepatocellular Carcinoma,” New England Journal of Medicine 359, no. 4 (2008): 378–390, 10.1056/NEJ Moa 0708857.18650514 · doi ↗ · pubmed ↗