Computational prediction of the interaction network between long non-coding RNAs and microRNAs in maize based on the transcriptome of the fuzzy tassel mutant line
J. Yan, A.Yu. Pronozin, D.A. Afonnikov

TL;DR
This study predicts interactions between long non-coding RNAs and microRNAs in a maize mutant using transcriptome data and machine learning, revealing how these RNA molecules may regulate gene expression.
Contribution
A novel computational approach combining RNA-seq data and machine learning to predict miRNA–lncRNA interactions in a maize Dicer-like1 mutant.
Findings
10 lncRNAs in shoots and 34 in tassels showed differential expression in the maize mutant line.
PmliPred and IntaRNA identified potential miRNA–lncRNA interactions, forming ceRNA networks.
Some lncRNAs bind multiple miRNAs, supporting their role as miRNA sponges in post-transcriptional regulation.
Abstract
Long non-coding RNAs (lncRNAs) play an important role in the regulation of gene expression, including interactions with microRNAs (miRNAs), acting as molecular “sponges”. Bioinformatics methods are generally used to predict such interactions. To refine computational predictions, additional evidence based on the co-expression of miRNAs and lncRNAs can be incorporated. In the present study, we investigated potential interactions between lncRNAs and miRNAs in the maize mutant line fuzzy tassel (fzt), which is characterized by reduced expression of certain miRNAs due to a mutation in the Dicer-like1 (DCL1) gene in shoot and tassel tissues. Transcriptome assembly was performed based on RNA-seq data from maize shoot and tassel tissues of control and mutant lines, with data obtained from the NCBI SRA archive. In the shoot, 10 lncRNAs with significantly altered expression levels between control…
Genes, proteins, chemicals, diseases, species, mutations and cell lines named across the full text — each resolved to its canonical identifier and authoritative record.
Click any figure to enlarge with its caption.
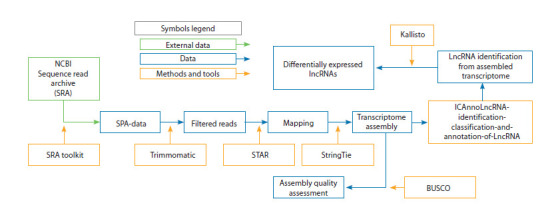 Fig. 1
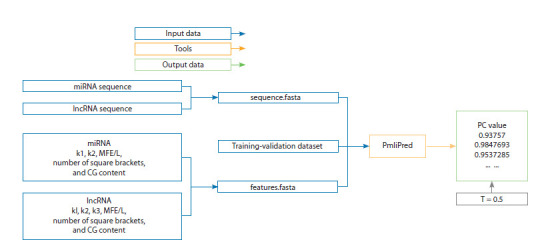 Fig. 2
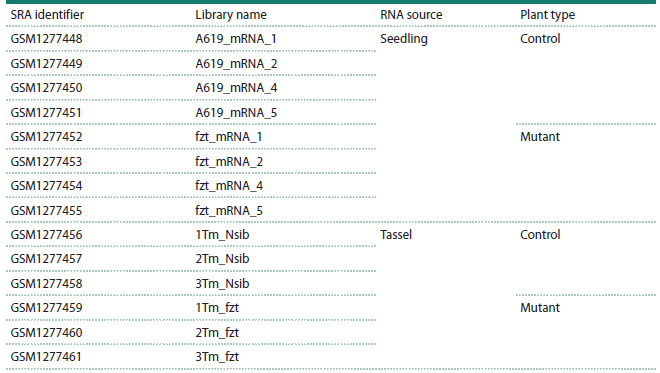 Table 1
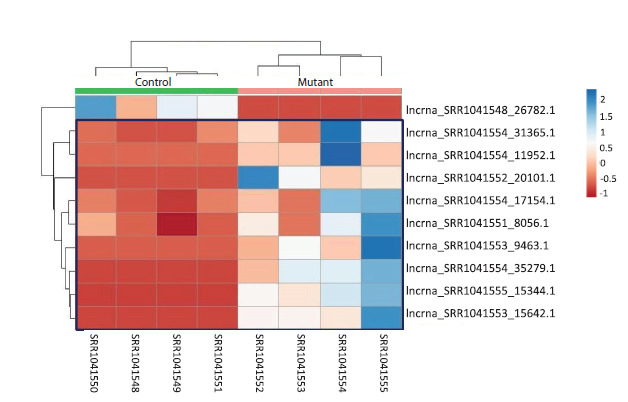 Fig. 3
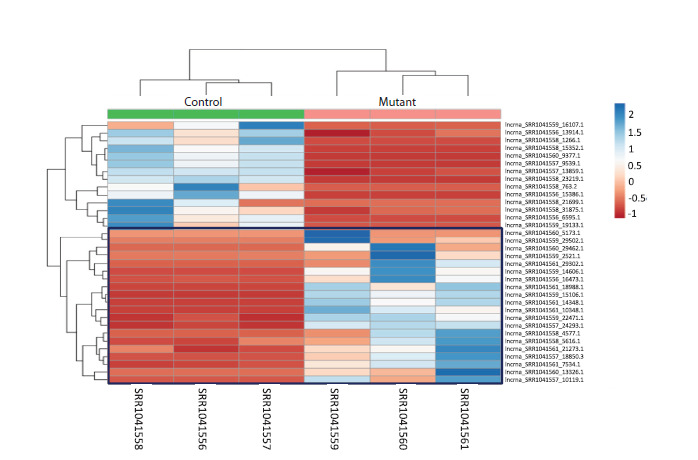 Fig. 4
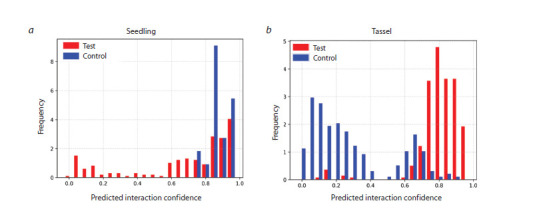 Fig. 5
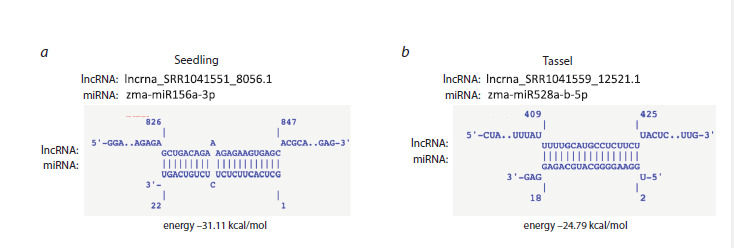 Fig. 6
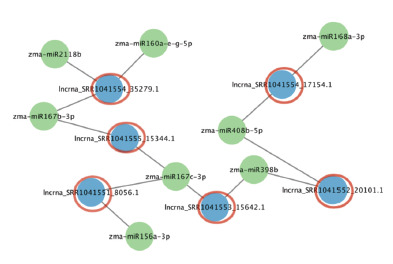 Fig. 7
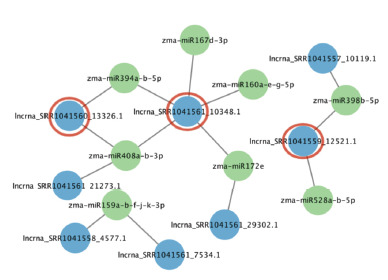 Fig. 8
Peer Reviews
No public reviews on file for this paper yet. If you reviewed it on a platform where reviews are public (OpenReview, ICLR, NeurIPS, ICML), you can paste yours below so the community can read it here.
Videos
No videos yet. Explain this paper in a talk, walkthrough, or lecture? Add one.
Taxonomy
TopicsPlant Molecular Biology Research · MicroRNA in disease regulation · Cancer-related molecular mechanisms research
Introduction
In recent years, the rapid development of next-generation high-throughput sequencing technologies has enabled the identification of tens of thousands of non-protein-coding transcripts (Sheng et al., 2023). Initially, these sequences were considered transcriptional noise. However, subsequent studies have revealed that approximately 75 % of cellular transcripts lack protein-coding potential, yet they actively participate in the regulation of gene expression (Wang L., Wang J.W., 2015). Non-coding RNAs (ncRNAs) are generally classified into housekeeping and regulatory types. Regulatory ncRNAs can be further divided into small and long non-coding RNAs based on their transcript length (Li R. et al., 2016). To date, the biological functions of small ncRNAs, particularly microRNAs (miRNAs), have been extensively studied; they are capable of repressing mRNA expression at both transcriptional and post-transcriptional levels. In contrast, the functions of long non-coding RNAs (lncRNAs) remain poorly understood, especially in plants
Recent studies have revealed that lncRNAs and miRNAs engage in complex interactions that play crucial roles in numerous biological processes. Several mechanisms underlying these interactions have been identified (Pronozin, Afonnikov, 2025). For example, lncRNAs can function as molecular “sponges”, binding complementarily to miRNAs and thereby preventing their interaction with target mRNAs. Such interactions contribute to the regulation of plant growth, development, tissue differentiation, and stress responses. However, due to the limited scale of experimental studies, bioinformatic approaches are increasingly needed to identify these interactions (Sheng et al., 2023).
To date, the PmliPred method has been developed to identify interactions between lncRNAs and miRNAs (Kang et al., 2020). This method is based on deep learning for predicting molecular interactions. Information on potential miRNA– lncRNA interactions can be valuable for modeling regulatory networks involved in gene expression. Furthermore, the obtained results can serve as a basis for subsequent functional experiments and may have practical applications in breeding programs. It should also be noted that potential miRNA– lncRNA interactions can be inferred from co-expression analyses (He et al., 2020).
The present study aims to identify interactions between lncRNAs and miRNAs in maize using bioinformatic approaches, taking into account co-expression data of miRNAs and lncRNAs. The fuzzy tassel ( fzt) mutant line of maize, which exhibits disrupted miRNA biogenesis due to a mutation in the Dicer-like1 (DCL1) gene, a key player in the processing of miRNA precursors, was used as a model for this study (Thompson et al., 2014). Impaired DCL1 function leads to reduced levels of several mature miRNAs, which in turn causes an imbalance in regulatory interactions and, consequently, in the expression of miRNAs and their target mRNAs (Thompson et al., 2014). We hypothesize that the decreased concentration of miRNAs may reduce the formation of duplexes with lncRNAs that act as molecular “sponges”. In this scenario, the degradation rate of lncRNA “sponges” would decrease, leading to an increase in their abundance. Thus, similar to mRNAs exhibiting elevated expression in the fzt maize line (Thompson et al., 2014), lncRNAs with increased levels in this line may serve as targets of these miRNAs. The results obtained from this study are expected to enhance our understanding of post-transcriptional regulation in plants and may inform the development of novel breeding strategies aimed at improving stress tolerance and crop productivity (Zhang L. et al., 2009; Sun Q. et al., 2013).
Materials and methods
Transcriptome data. In this study, RNA-seq data were obtained from the open NCBI Sequence Read Archive (SRA) database (accession numbers GSM1277448–GSM1277461, see the Table) (Thompson et al., 2014). The samples were divided into two groups: control and mutant. The mutant lines contained a deletion in the Dicer-like1 (DCL1) gene, which plays a key role in the processing of miRNA precursors. Gene expression was assessed separately for whole seedling and tassel tissues, including both long RNAs and miRNAs.
As shown previously (Thompson et al., 2014), expression of 22 miRNAs was significantly reduced in the seedling (miR398b-5p, miR408a-b-3p, miR408b-5p, miR394a-b-5p, miR167c-3p*, miR156a-3p*, miR167b-3p*, miR319b,d-5p*, miR169i-k-5p, miR167a-d-5p, miR168b-3p*, miR168a-3p*, miR156d-f-g-3p*, miR398a-b-3p, miR528a-b-3p, miR156e- 3p*, miR397a-b-5p, miR159a-5p, miR2118b, miR399e,i-j-3p, miR160a-e,g-5p, miR398a-5p*) and 14 miRNAs in the tassel (miR167d-3p*, miR167a-d-5p, miR172e, miR408a-b-3p, miR398b-5p*, miR394a-b-5p, miR167c-3p*, miR398a-b-3p, miR319a-d-3p, miR159a-b,f,j-k-3p, miR528a-b-5p, miR160ae, g-5p, miR166j-k,n-3p, miR159a-5p*)
The reference genome of maize (Zea mays) version 5 (Zm-B73-REFERENCE-NAM-5.0) was used in this study, downloaded along with its annotation from the Ensembl Plants database (Bolser et al., 2016)MiRNA sequences were obtained from miRBase version 22.1 (https://www.mirbase.org/).
Bioinformatics analysis. This study consisted of two main blocks of bioinformatics analysis: transcriptome assembly followed by the differential expression analysis of lncRNAs; prediction of miRNA–lncRNA interactions using deep learning– based approaches. A detailed description of each analytical step is provided below
Transcriptome assembly and analysis of maize. Transcriptome assembly (Fig. 1) included the following steps: data preprocessing, transcriptome assembly, identification and annotation of lncRNAs, and quantification of transcript expression levels.
Workflow of the bioinformatics pipeline for maize transcriptome assemblyGreen rectangles represent the description of external data sources; blue rectangles indicate library data and intermediate results, and orange rectangles denote software tools used in the analysis
Read filtering was performed using Trimmomatic (Bolger et al., 2014) with the following parameters: removal of adapter sequences, elimination of short reads shorter than 36 nucleotides, and quality-based trimming of low-quality reads. After preprocessing, the filtered reads were aligned to the Z. mays reference genome using STAR (Dobin et al., 2013). Based on the alignment results, transcriptome assembly was conducted using StringTie (Pertea et al., 2015). The completeness and quality of the assembled transcriptome were evaluated with BUSCO (Simão et al., 2015). Identification and annotation of lncRNAs were performed using ICAnnoLncRNA (Pronozin, Afonnikov et al., 2023). Expression levels of identified lncRNAs and other transcripts were quantified using Kallisto (Bray et al., 2016).
Differential expression analysis of lncRNAs in maize. Differential expression analysis of lncRNAs was performed separately for shoot and inflorescence tissues by comparing wild-type (control) and mutant ( fzt) maize lines. Statistical analysis was conducted using the DESeq2 and edgeR packages (Robinson et al., 2010; Love et al., 2014). Transcripts were considered significantly differentially expressed at a p-value < 0.05, adjusted for multiple testing
For the differentially expressed lncRNAs, heatmaps of normalized expression values were generated to visualize expression patterns across biological replicates and to confirm the consistency of expression changes between the control and mutant groups
Analysis of interactions between miRNAs and lncRNAs. Interactions between miRNA and lncRNA molecules were predicted using the PmliPred method (Kang et al., 2020), which involves several consecutive analytical stages (Fig. 2). At the first stage, input data were prepared, including nucleotide sequences of miRNAs and lncRNAs that exhibited downregulated miRNA expression and upregulated lncRNA expression in mutant plants compared with the control. The input to the program also included quantitative sequence features extracted by the built-in algorithms of the model, as well as the training dataset provided with the software package (Kang et al., 2020). For miRNAs, the following features were used: k-mer frequencies (k = 1, k = 2), minimum free energy normalized by length (MFE/L), number of paired nucleotides in the secondary structure, and GC content ratio. For lncRNAs, an additional feature representing k-mer frequencies (k = 3) was extracted
Workflow of predicting interactions between lncRNAs and miRNAs using the PmliPred modelBlue rectangles represent the input data, green rectangles indicate the output results, and orange rectangles denote the software tools used in the analysis. The threshold value of confidence probability (T = 0.5) is shown.
The processed data were analyzed using the PmliPred program to estimate the interaction probability between miRNA– lncRNA pairs (output parameter PC, confidence probability). A miRNA–lncRNA pair was considered to have a potential interaction when the PC value was ≥ 0.5. The results were presented in a table containing probability scores, which reflected the predicted strength of interaction between miRNA and lncRNA molecules
RNA-seq libraries of maize (Zea mays) obtained from seedling and tassel tissues of control plants and the fuzzy tassel (fzt) mutant line
Analysis and visualization of interactions between miRNAs and lncRNAs. The obtained miRNA–lncRNA pairs were divided into two groups based on their interaction parameters: lncRNAs with increased expression levels in the mutant line (test group) and lncRNAs with decreased expression levels (control group). Both groups of lncRNAs were compared with all miRNAs showing reduced expression levels, as reported by Thompson et al. (2014) (see section “Transcriptomic data”). As a threshold for selecting potential interactions in the test group, the maximum value of the PC parameter calculated by the PmliPred program for the control group was used. If for a given miRNA–lncRNA pair from the test group, the PC parameter exceeded any of the PC values from the control group, such miRNA–lncRNA pairs were considered to interact.
The sequences of the selected miRNAs and lncRNAs were uploaded into the IntaRNA program (Mann et al., 2017) for the identification and visualization of base-pairing interactions. Among all predicted interactions, only those pairs were retained, in which the number of unpaired nucleotides within the interaction region of the two molecules was fewer than 4, and the length of the interaction region exceeded 16 nucleotides
Such interactions between lncRNAs and miRNAs have important biological significance. lncRNAs can function as competing endogenous RNAs (ceRNAs), or “sponges”, by binding to miRNAs and thereby preventing them from interacting with their mRNA targets. This mechanism contributes to the regulation of gene expression involved in plant growth, development, and stress responses (Pronozin, Afonnikov, 2025).
Results
Transcriptome assembly
As a result of the transcriptomic analysis of Z. mays, covering both seedling and tassel stages for control and mutant ( fzt) lines, high-quality raw data were obtained. The average percentage of uniquely mapped reads during alignment using STAR (Dobin et al., 2013) was 84.73 %, while only 3.10 % of reads remained unmapped. For the aligned reads, the average mismatch rate per nucleotide was 0.76 %, indicating high sequencing accuracy and the reliability of the data for subsequent analyses.
The transcriptome assemblies generated using StringTie (Pertea et al., 2015) were evaluated with the BUSCO tool (Simão et al., 2015). In all 14 libraries, the proportion of complete BUSCO groups exceeded 95 %, reaching a maximum of 98.8 % (252 out of 255 expected orthologs detected in library SRR1041561). These metrics indicate the completeness and high quality of the obtained assemblies, confirming their suitability for subsequent expression analysis and the identification of noncoding RNAs.
Differential expression of lncRNAs between control and mutant Z. mays samples
In seedling tissue, 10 lncRNAs were identified as significantly differentially expressed between the control and mutant groups (Table S1)1. Among these, nine lncRNAs showed increased expression in the mutants, suggesting that they may serve as targets for miRNAs and participate in post-transcriptional regulatory mechanisms. These transcripts were subsequently considered as candidate miRNA targets in further analyses
Supplementary Materials are available in the online version of the paper: https://vavilovj-icg.ru/download/pict-2025-29/appx51.pdf
The heatmap (Fig. 3) illustrates systematic differences in the expression of these lncRNAs across the analyzed transcriptomic libraries. For 9 out of the 10 lncRNAs, expression levels were higher in the mutant plants compared with the control.
Heatmap of differentially expressed lncRNAs in seedling tissueHere and in Fig. 4: the color scale on the right represents normalized expression levels, with blue indicating high expression, and red indicating low expression. Cells corresponding to lncRNAs with increased expression in the mutant line are highlighted with a blue frame.
In tassel tissue, the number of differentially expressed lncRNAs was considerably higher, with a total of 34 lncRNAs identified (Table S2). Among these, 20 lncRNAs exhibited increased expression in the mutant line. Notably, pronounced differences in transcription levels were observed for several lncRNAs that displayed strong tissue-specific expression patterns unique to the tassel.
The heatmap of lncRNA expression in tassel tissue (Fig. 4) also illustrates systematic differences across the analyzed transcriptomic libraries. lncRNAs with decreased and increased expression levels in the mutant plants formed two clearly distinct clusters.
Heatmap of differentially expressed lncRNAs in tassel tissue
Overall, the identified lncRNAs represent a prioritized set for subsequent analysis of interactions with miRNAs and for further functional annotation.
Assessment of the accuracy of miRNA–lncRNA interaction predictions
The evaluation of the model’s ability to distinguish lncRNAs from the test group (with increased expression in mutants) from those in the control group (with decreased expression) is presented in Fig 5.
Distribution of predicted miRNA–lncRNA interaction scores in seedlings and tassel tissuesa – seedlings: interaction scores for the test group (lncRNAs with increased expression) are shown in red, and for the control group (lncRNAs with decreased expression), in blue; b – tassel: similarly, red represents the test group, and blue, the control group (lncRNAs with decreased expression). The X-axis represents the predicted interaction confidence (PC) calculated by PmliPred, and the Y-axis indicates the number of miRNA–lncRNA pairs analyzed.
In seedling tissue, the interaction scores for the test lncRNAs (with increased expression in mutants) were shifted above 0.5, suggesting a potential ability of these transcripts to bind miRNAs. However, it should be noted that the control group contained only a single lncRNA with a high predicted score. Because the control in this experiment consisted of only one lncRNA (with decreased expression in mutants), it was difficult to accurately assess the precision and discriminatory power of the PmliPred model
In tassel tissue, the differences between the groups were even more pronounced: interaction scores for the test lncRNAs were predominantly above 0.5, whereas the control lncRNAs displayed a distribution shifted below 0.5. This behavior of the model indicates its ability to effectively distinguish biological classes based on the predicted miRNA–lncRNA interaction parameters.
Thus, the PmliPred model demonstrated high discriminatory power and can be used for the preliminary selection of lncRNAs potentially involved in interactions with miRNAs
miRNA–lncRNA interaction networks in maize tissues
The results obtained using the miRNA–lncRNA interaction prediction tool IntaRNA are shown in Fig. 6. For example, two RNA pairs clearly formed stable and extensive regions of complementary binding. In total, 13 reliable miRNA–lncRNA pairs were identified in seedling tissue, and 14 pairs, in tassel tissue. These data confirm that the selected lncRNAs not only exhibit increased expression in the mutants but also possess a high potential for specific interactions with miRNAs, the expression of which is reduced in the mutants. This makes them justified candidates as miRNA targets.
Examples of miRNA–lncRNA interactions predicted using IntaRNAa – seedlings: zma-miR156a-3p and lncRNA_mapped_SRR1041551_8056.1; b – tassel: zma-miR528a-b-5p and lncRNA_mapped_SRR1041559_ 12521.1. Regions of base pairing and the interaction structures are shown, calculated based on minimum free energy (kcal/mol).
Visualization of the identified interactions using Cytoscape (Figs. 7 and 8) revealed that some lncRNAs are potentially capable of binding multiple miRNAs simultaneously. For example, lncrna_SRR1041561_10348.1 (in tassel) interacts with five different miRNAs: zma-miR160a-e-g-5p, zmamiR167d- 3p, zma-miR394a-b-5p, zma-miR408a-b-3p, and zma-miR172e, suggesting its potential role as a “sponge” within a ceRNA mechanism. Another example is lncrna_ SRR1041554_35279.1 in seedling tissue, which interacts with zma-miR2118b, zma-miR160a-e-g-5p, and zma-miR167b-3p.
miRNA–lncRNA interaction networks in maize seedling tissueHere and in Fig. 8: green circular nodes represent miRNAs, blue circular nodes represent lncRNAs, and red circles indicate lncRNAs that are potentially functioning as “sponges”.
miRNA–lncRNA interaction networks in maize tassel tissue
Discussion
The analysis revealed that 9 out of 14 identified lncRNAs are potentially capable of interacting with multiple miRNAs simultaneously, suggesting their possible role as competing endogenous RNAs (ceRNAs), molecular “sponges” that bind miRNAs and prevent their interaction with target mRNAs. Through this mechanism, lncRNAs can indirectly regulate the expression of various genes involved in key biological processes.
Among the predicted miRNA partners are well-characterized regulators of plant growth, development, and stress responses (Jones-Rhoades et al., 2006; Sunkar et al., 2012): • miR156 regulates the transition from the juvenile to the adult phase, flowering, leaf morphogenesis, and branching by suppressing SPL genes (Preston et al., 2013; Wang H., Wang H., 2015); • miR167 and miR160 regulate the auxin signaling pathway by suppressing ARF genes, thereby influencing root formation, leaf, flower, and seed development, as well as somatic embryogenesis (Caruana et al., 2020; Barrera-Rojas et al., 2021; Wang Y. et al., 2020); • miR168 participates in maintaining the stable level of the AGO1 protein, a central component of the RNA interference (RNAi) machinery, thereby regulating the entire miRNA pathway (Martínez de Alba et al., 2011; Li W. et al., 2012); miR172 regulates the onset of flowering and organogenesis by repressing AP2-type transcription factor genes (Ripoll et al., 2015; Zhang B. et al., 2015); • miR2118 activates the biogenesis of phased small interfering RNAs (phasiRNAs), playing a critical role in plant immunity and anther development (Canto-Pastor et al., 2019; Jiang P. et al., 2020); • miR398 and miR408 provide antioxidant protection by regulating the levels of superoxide dismutases and metalbinding proteins, and they also respond to a wide range of abiotic stresses (Jiang A. et al., 2021; Zou et al., 2021; Gao et al., 2022); • miR394 influences leaf morphogenesis, fruit development, and meristem activity (Song et al., 2015; Sun P. et al., 2017); • miR528 is involved in redox homeostasis, resistance to viral infections, salt stress response, and regulation of lignification (Wu et al., 2017; Sun Q. et al., 2018).
Functional annotation of the interacting miRNAs indicates that most of them are involved not only in the development of plant morphological structures, but also in the complex regulatory networks controlling responses to biotic and abiotic stresses.
Moreover, the identified ceRNA networks confirm that post- transcriptional regulation in plants is mediated through finely coordinated interactions between non-coding and coding RNAs. The presence of lncRNAs capable of binding multiple regulatory miRNAs suggests the existence of potential hubs of regulatory cross-talk within RNA networks, which represents a particularly promising target for functional validation.
The obtained results emphasize the importance of a systems- level approach to transcriptomic data analysis, as such strategies enable the identification of hidden layers of gene regulation and promising molecular targets. Furthermore, these findings may serve as a theoretical foundation for the development of new agronomically valuable maize varieties with enhanced stress tolerance and improved adaptive traits.
Conclusion
In this study, a comprehensive analysis of Z. mays transcriptomic data was conducted to identify potential interactions between miRNAs and lncRNAs. Based on the results of differential expression analysis comparing control and mutant samples, lncRNAs and miRNAs with potential interactions were identified.
The PmliPred model, based on machine learning approaches, was applied to predict potential miRNA–lncRNA pairs. Subsequent structural analysis using IntaRNA confirmed the presence of stable complementary binding sites between the selected molecules, indicating high reliability of the predicted interactions.
Based on the selected interaction pairs, competing endogenous RNA (ceRNA) networks were constructed, demonstrating that individual lncRNAs are capable of binding multiple miRNAs simultaneously. This supports the hypothesis that they participate in post-transcriptional regulatory mechanisms as miRNA “sponges”, capable of modulating the activity of regulatory molecules and influencing the expression of target genes
Additionally, key interactions were visualized using Cytoscape, allowing a clear representation of the structure and potential functional significance of the identified regulatory connections. The results confirm the role of lncRNAs as important components of plant regulatory networks and provide a foundation for further functional studies.
Conflict of interest
The authors declare no conflict of interest.
References
Barrera-Rojas C.H., Otoni W.C., Nogueira F.T.S. Shaping the root system: the interplay between miRNA regulatory hubs and phytohormones. J Exp Bot. 2021;72(20):6822-6835. doi 10.1093/jxb/ erab299
Bolger A.M., Lohse M., Usadel B. Trimmomatic: a flexible trimmer for Illumina sequence data. Bioinformatics. 2014;30(15):2114-2120. doi 10.1093/bioinformatics/btu170
Bolser D.M., Staines D.M., Perry E., Kersey P.J. Ensembl Plants: integrating tools for visualizing, mining, and analyzing plant genomic data. In: van Dijk A. (Ed.) Plant Genomics Databases. Methods in Molecular Biology. Vol. 1533. New York: Humana Press, 2017; 1-31. doi 10.1007/978-1-4939-6658-5_1
Bray N., Pimentel H., Melsted P., Pachter L. Near-optimal probabilistic RNA-seq quantification. Nat Biotechnol. 2016;34(5):525-527. doi 10.1038/nbt.3519
Canto-Pastor A., Santos B., Valli A., Summers W., Schornack S., Baulcombe D. Enhanced resistance to bacterial and oomycete pathogens by short tandem target mimic RNAs in tomato. Proc Natl Acad Sci USA. 2019;116(7):2755-2760. doi 10.1073/pnas.181438011
Caruana J.C., Dhar N., Raina R. Overexpression of Arabidopsis microRNA167 induces salicylic acid-dependent defense against Pseudomonas syringae through the regulation of its targets ARF6 and ARF8. Plant Direct. 2020;4(9):e00270. doi 10.1002/pld3.270
Dobin A., Davis C.A., Schlesinger F., Drenkow J., Zaleski C., Jha S., Batut P., Chaisson M., Gingeras T.R. STAR: ultrafast universal RNA-seq aligner. Bioinformatics. 2013;29(1):15-21. doi 10.1093/ bioinformatics/bts635
Gao Y., Feng B., Gao C., Zhang M., Zhang X., Han X., Liu P., Wang B., Li Z. The evolution and functional roles of miR408 and its targets in plants. Int J Mol Sci. 2022;23(1):530. doi 10.3390/ijms 23010530
He X., Guo S., Wang Y., Wang L., Shu S., Sun J. Systematic identification and analysis of heat-stress-responsive lncRNAs, circRNAs and miRNAs with associated co-expression and ceRNA networks in cucumber (Cucumis sativus L.). Physiol Plant. 2020;168(3):736-754. doi 10.1111/ppl.12997
Jiang A., Guo Z., Pan J., Yu B., Chen D., Li Y. The PIF1-miR408- PLANTACYANIN repression cascade regulates light-dependent seed germination. Plant Cell. 2021;33(5):1506-1529. doi 10.1093/ plcell/koab060
Jiang P., Lian B., Liu C., Fu Z., Shen Y., Cheng Z., Ding Y. 21-nt phasiRNAs direct target mRNA cleavage in rice male germ cells. Nat Commun. 2020;11(1):5191. doi 10.1038/s41467-020-19034-y
Jones-Rhoades M.W., Bartel D.P., Bartel B. MicroRNAs and their regulatory roles in plants. Annual Rev Plant Biol. 2006;57:19-53. doi 10.1146/annurev.arplant.57.032905.105218
Kang Q., Jun M., Jun C., Zhang Y., Wang W. PmliPred: a method based on hybrid model and fuzzy decision for plant miRNA–lncRNA interaction prediction. Bioinformatics. 2020;36(10):2986-2992. doi 10.1093/bioinformatics/btaa074
Li R., Yang Y.F., Li R., Zhu H.L., Luo Y.B. Functions of long non-coding RNA and its interacting mechanisms. Chin Bull Life Sci. 2016; 28(6):703-711. doi 10.13376/j.cbls/2016090
Li W., Cui X., Meng Z., Huang X., Xie Q., Wu H., Jin H., Zhang D., Liang W. Transcriptional regulation of Arabidopsis MIR168a and ARGONAUTE1 homeostasis in abscisic acid and abiotic stress responses. Plant Physiol. 2012;158(3):1279-1292. doi 10.1104/pp. 111.188789
Love M.I., Huber W., Anders S. Moderated estimation of fold change and dispersion for RNA-seq data with DESeq2. Genome Biol. 2014;15(12):550. doi 10.1186/s13059-014-0550-8
Mann M., Wright P.R., Backofen R. IntaRNA 2.0: enhanced and customizable prediction of RNA–RNA interactions. Nucleic Acids Res. 2017;45(W1):W435-W439. doi 10.1093/nar/gkx279
Martínez de Alba A.E., Jauvion V., Mallory A.C., Bouteiller N., Vaucheret H. The miRNA pathway limits AGO1 availability during siRNA-mediated PTGS defense against exogenous RNA. Nucleic Acids Res. 2011;39(21):9339-9344. doi 10.1093/nar/gkr590
Pertea M., Pertea G.M., Antonescu C.M., Chang T.C., Mendell J.T., Salzberg S.L. StringTie enables improved reconstruction of a transcriptome from RNA-seq reads. Nat Biotechnol. 2015;33(3):290- 295. doi 10.1038/nbt.3122
Preston J.C., Hileman L.C. Functional evolution in the plant SQUAMOSA- PROMOTER BINDING PROTEIN-LIKE (SPL) gene family. Front Plant Sci. 2013;4:80. doi 10.3389/fpls.2013.00080
Pronozin A.Y., Afonnikov D.A. ICAnnoLncRNA: a snakemake pipeline for a long noncoding RNA search and annotation in transcriptomic sequences. Genes. 2023;14(7):1331. doi 10.3390/genes14071331
Pronozin A.Y., Afonnikov D.A. The role of long noncoding RNAs in plants. Russ J Genet. 2025;61:1-18. doi 10.1134/S1022795424 701345
Ripoll J.J., Bailey L.J., Mai Q.A., Wu S.L., Hon C.T., Chapman E.J., Ditta G.S., Estelle M., Yanofsky M.F. microRNA regulation of fruit growth. Nat Plants. 2015;1(4):15036. doi 10.1038/nplants.2015.36
Robinson M.D., McCarthy D.J., Smyth G.K. edgeR: a Bioconductor package for differential expression analysis of digital gene expression data. Bioinformatics. 2010;26(1):139-140. doi 10.1093/bioinformatics/ btp616
Sheng N., Huang L., Gao L., Zhao W., Zhang Y., Wang X. A survey of computational methods and databases for lncRNA-miRNA interaction prediction. IEEE/ACM Trans Comput Biol Bioinform. 2023; 20(5):2810-2826. doi 10.1109/TCBB.2023.32642541
Simão F.A., Waterhouse R.M., Ioannidis P., Kriventseva E.V., Zdobnov E.M. BUSCO: assessing genome assembly and annotation completeness with single-copy orthologs. Bioinformatics. 2015; 31(19):3210-3212. doi 10.1093/bioinformatics/btv35
Song J.B., Shu X.X., Shen Q., Guo C.Y., Jiang J., Xie L.H., Liu Y.F., Yang Z.M. Altered fruit and seed development of transgenic rapeseed (Brassica napus) over-expressing microRNA394. PLoS One. 2015;10(5):e0125427. doi 10.1371/journal.pone.0125427
Sun P., Cheng C., Lin Y., Zhu Q., Lin J., Jin Y., Yuan H., Lin Y. Combined small RNA and degradome sequencing reveals complex microRNA regulation of catechin biosynthesis in tea (Camellia sinensis). PLoS One. 2017;12(2):e0171173. doi 10.1371/journal.pone. 0171173
Sun Q., Csorba T., Skourti-Stathaki K., Proudfoot N.J., Dean C. R-loop stabilization represses antisense transcription at the Arabidopsis FLC locus. Science. 2013;340(6132):619-621. doi 10.1126/science. 1234848
Sun Q., Liu X., Yang J., Wang Y., Zhang Y., Li J., Wang N., Li H., Wang J. MicroRNA528 affects lodging resistance of maize by regulating lignin biosynthesis under nitrogen-luxury conditions. Mol Plant. 2018;11(6):806-814. doi 10.1016/j.molp.2018.03.013
Sunkar R., Li Y.F., Jagadeeswaran G. Functions of microRNAs in plant stress responses. Trends Plant Sci. 2012;17(4):196-203. doi 10.1016/j.tplants.2012.01.010
Thompson B.E., Basham C., Hammond R., Sidorenko L., Becker M.G., Neuffer M.G., Meeley R.B., Timmermans M.C.P., Chandler V.L., Hake S. The dicer-like1 homolog fuzzy tassel is required for the regu-lation of meristem determinacy in the inflorescence and vegetative growth in maize. Plant Cell. 2014;26(12):4702-4717. doi 10.1105/ tpc.114.132670
Wang H., Wang H. The miR156/SPL module, a regulatory hub and versatile toolbox, gears up crops for enhanced agronomic traits. Mol Plant. 2015;8(5):677-688. doi 10.1016/j.molp.2015.01.008
Wang L., Wang J.W. Coding function for non-coding RNA in plantsinsights from miRNA encoded peptide (miPEP). Sci China Life Sci. 2015;58(5):503-505. doi 10.1007/s11427-015-4854-z
Wang Y., Liu W., Wang X., Yang R., Wu Z., Wang H., Wang L., Hu Z., Guo S., Zhang H., Lin J., Fu C. MiR156 regulates anthocyanin biosynthesis through SPL targets and other microRNAs in poplar. Hortic Res. 2020;7:118. doi 10.1038/s41438-020-00341-w
Wu J., Yang R., Yang Z., Yao S., Zhao S., Wang Y., Li P., … Zhou X., Chu C., Qi Y., Cao X., Li Y. ROS accumulation and antiviral defence control by microRNA528 in rice. Nat Plants. 2017;3:16203. doi 10.1038/nplants.2016.203
Zhang B., Wang L., Zeng L., Zhang C., Ma H. Arabidopsis TOE proteins convey a photoperiodic signal to antagonize CONSTANS and regulate flowering time. Genes Dev. 2015;29(9):975-987. doi 10.1101/gad.251520.114
Zhang L., Chia J.M., Kumari S., Stein J.C., Liu Z., Narechania A., Maher C.A., Guill K., McMullen M.D., Ware D. A genome-wide characterization of microRNA genes in maize. PLoS Genet. 2009; 5(11):e1000716. doi 10.1371/journal.pgen.1000716
Zou H., Guo X., Yang R., Wang D., Liu K., Gan L., Yuan Y., Qi J., Wang Y. MiR408-SmLAC3 module participates in salvianolic acid B synthesis in Salvia miltiorrhiza. Int J Mol Sci. 2021;22(14):7541. doi 10.3390/ijms22147541