Color Doppler Ultrasound Versus Magnetic Resonance Imaging for Diagnosing Giant Cell Arteritis: A Systematic Review and Meta-Analysis
Mustapha El Yaman, Fatima Khan, Bareq S Al-Lami, Abdulrahman O Saeed, Baqir S Al-Lami, Yasir Al-Lami, Leen El Yaman

TL;DR
This study compares color Doppler ultrasound and MRI for diagnosing giant cell arteritis, finding MRI to be more accurate and consistent.
Contribution
The study provides a systematic review and meta-analysis comparing diagnostic accuracy of CDUS and MRI for GCA.
Findings
MRI showed higher median diagnostic odds ratio (72.0) compared to CDUS (24.9).
CDUS accuracy varied more between studies and was operator-dependent.
Both imaging methods support non-biopsy diagnosis of GCA but with different reliability.
Abstract
Rapid diagnosis of giant cell arteritis (GCA) is essential to prevent ischemic complications. Color Doppler ultrasound (CDUS) and high-resolution magnetic resonance imaging (MRI) are increasingly used as alternatives or adjuncts to temporal artery biopsy, but their comparative diagnostic performance remains uncertain. We performed a systematic review and bivariate random-effects meta-analysis of diagnostic accuracy studies in adults with suspected GCA. Studies reporting extractable 2×2 data against temporal artery biopsy, or accepted clinical reference standards when biopsy was unavailable, were included. Risk of bias was assessed using Quality Assessment of Diagnostic Accuracy Studies 2 (QUADAS-2). Pooled sensitivity, specificity, diagnostic odds ratios (DOR), and summary receiver operating characteristic (ROC) curves were calculated, with evaluation of heterogeneity and publication…
Genes, proteins, chemicals, diseases, species, mutations and cell lines named across the full text — each resolved to its canonical identifier and authoritative record.
Click any figure to enlarge with its caption.
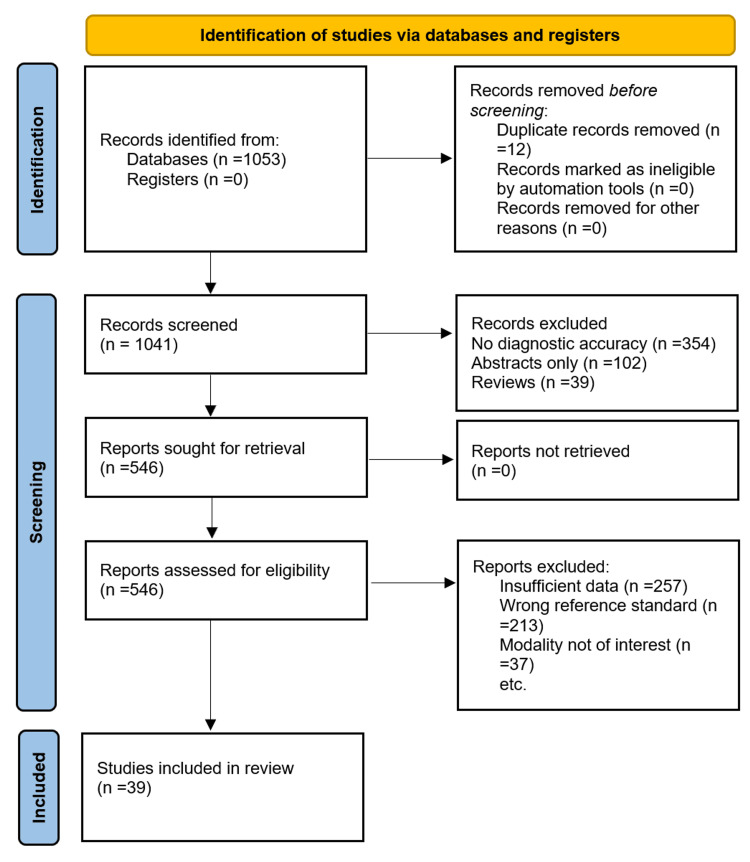 Figure 1
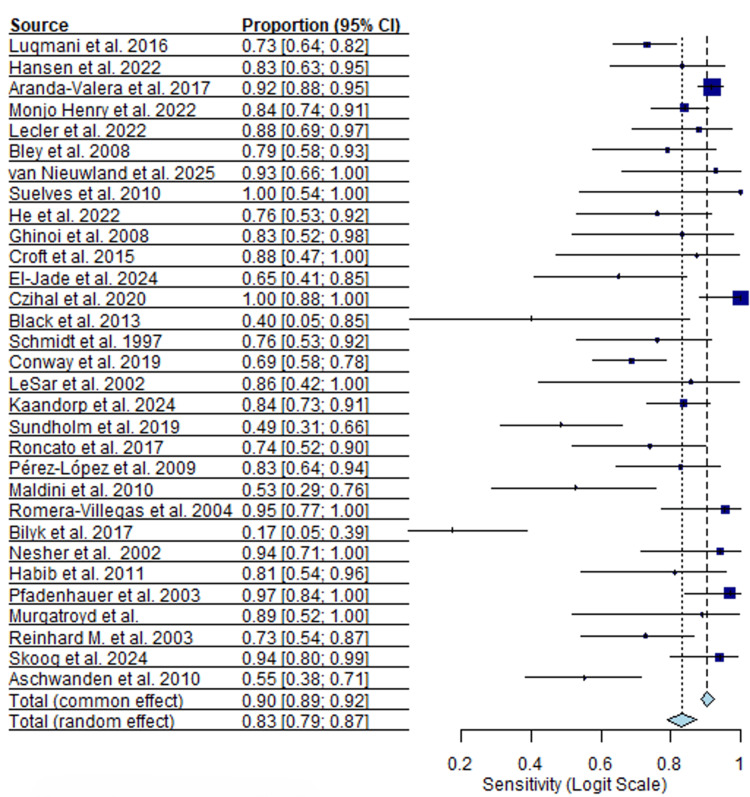 Figure 2
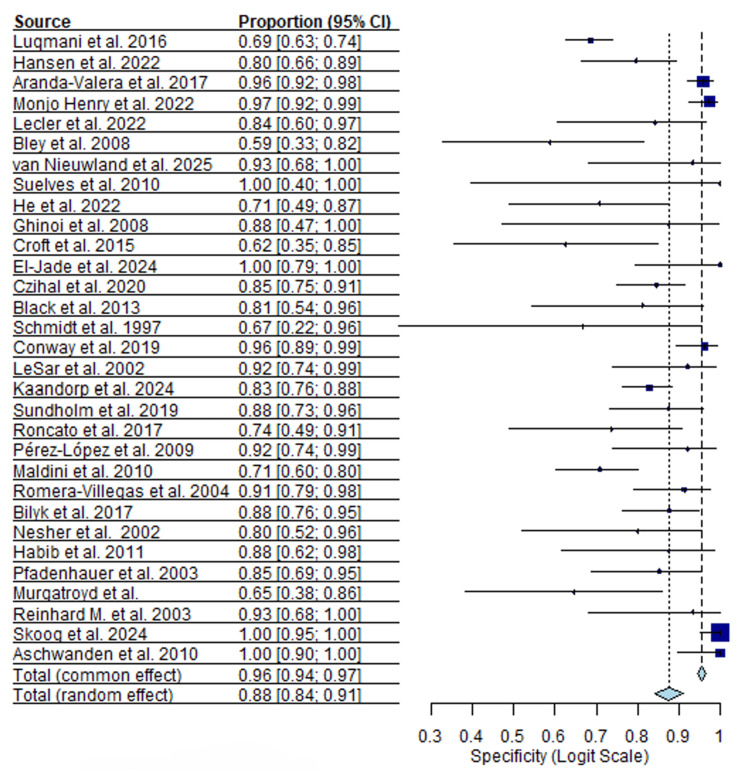 Figure 3
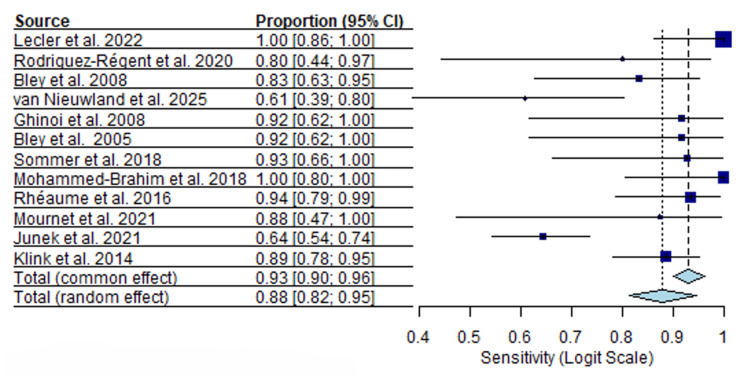 Figure 4
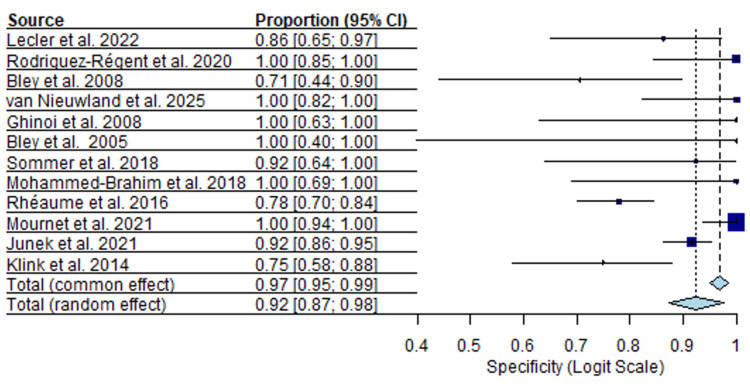 Figure 5
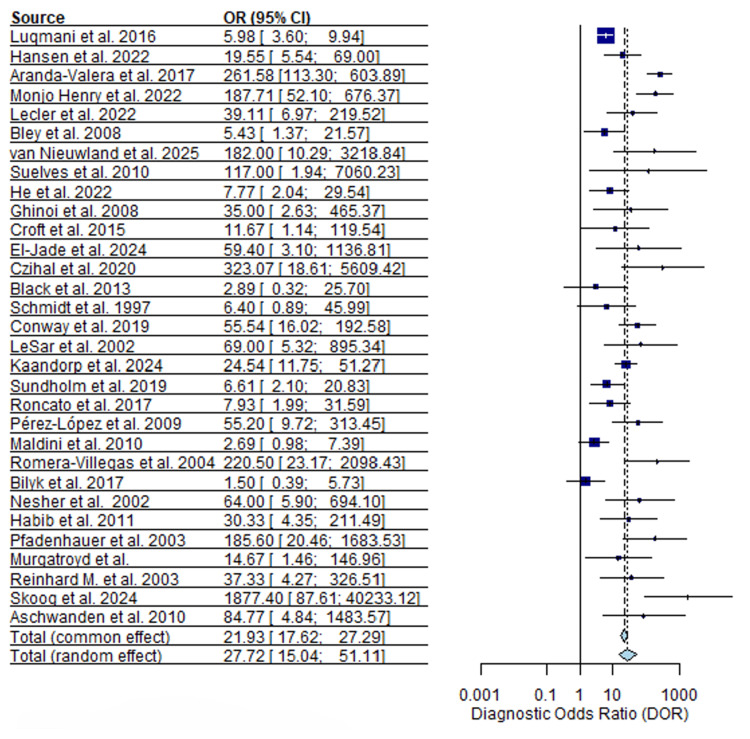 Figure 6
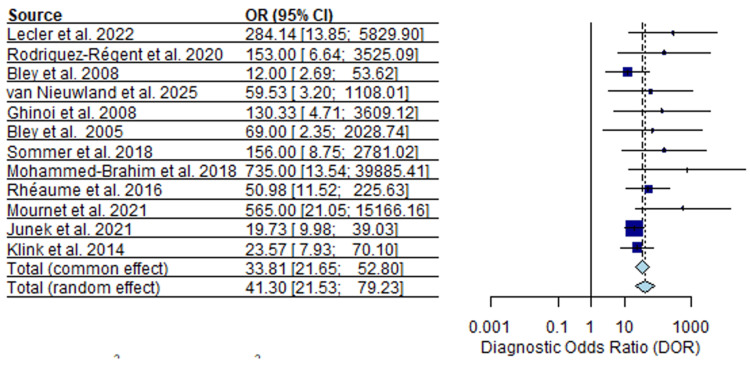 Figure 7
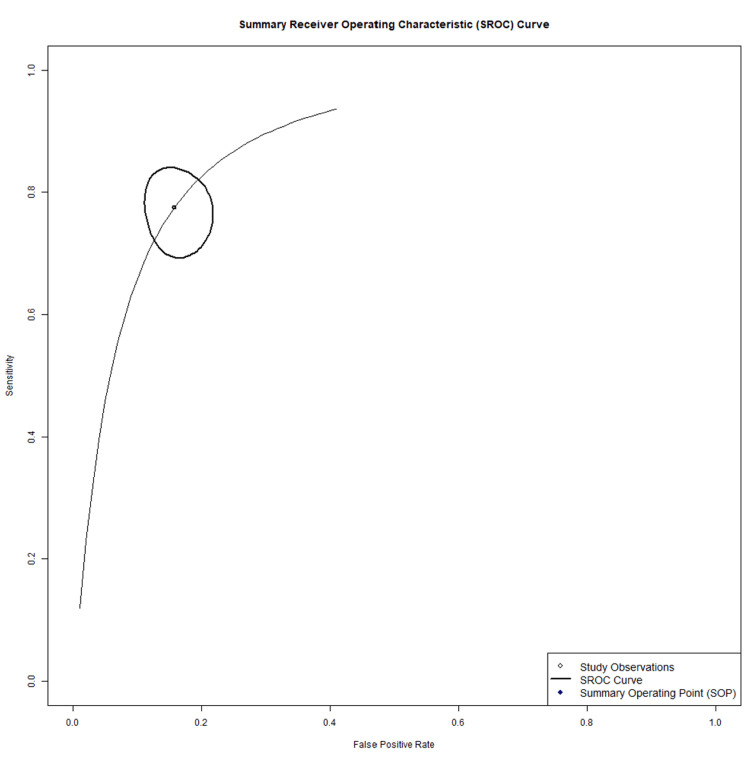 Figure 8
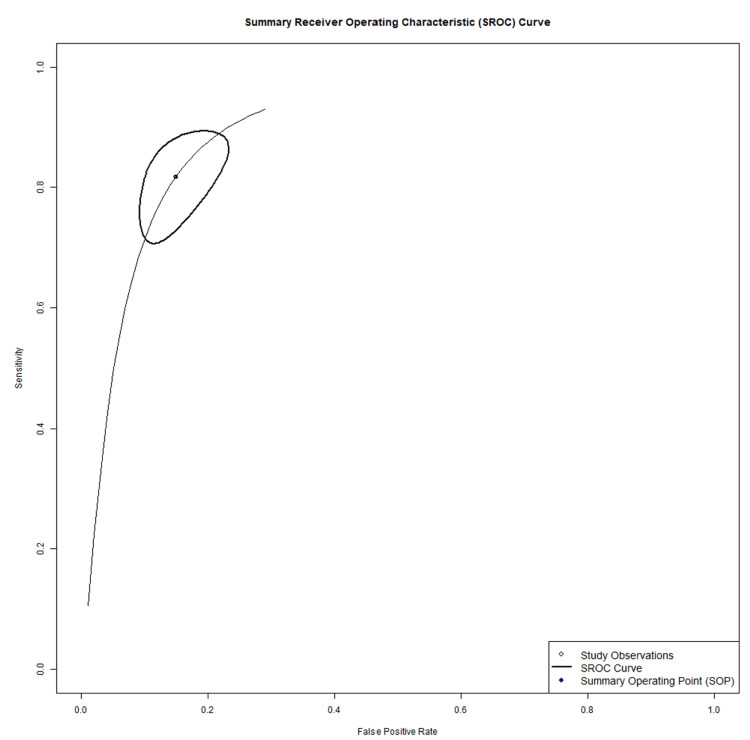 Figure 9
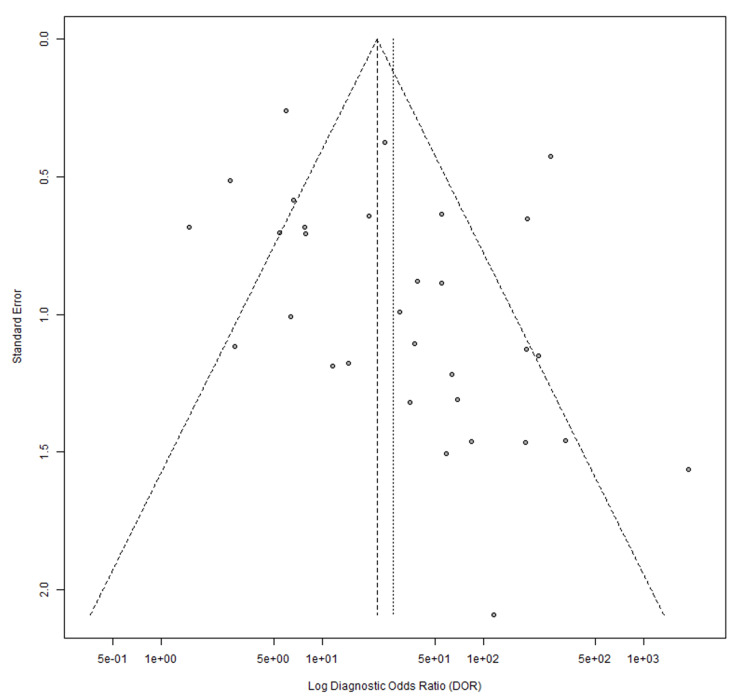 Figure 10
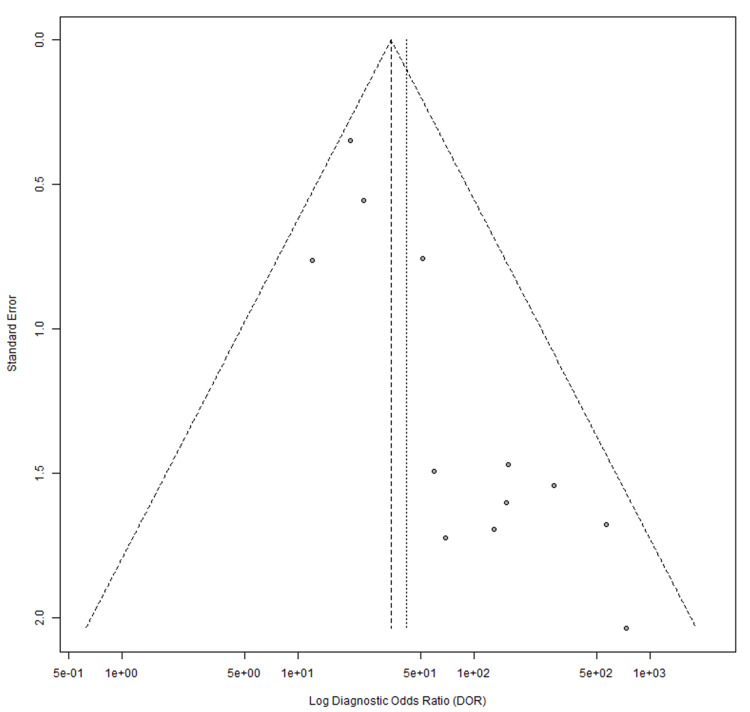 Figure 11
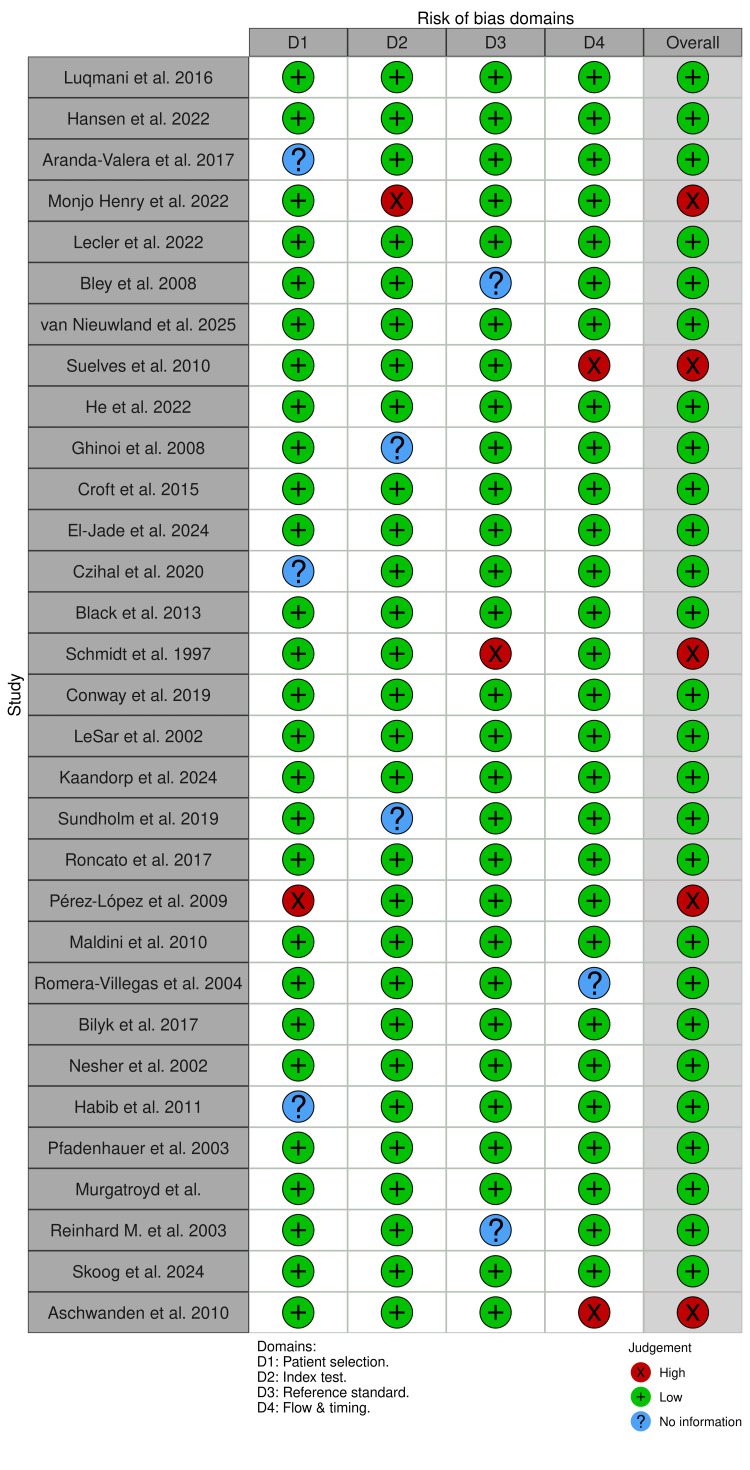 Figure 12
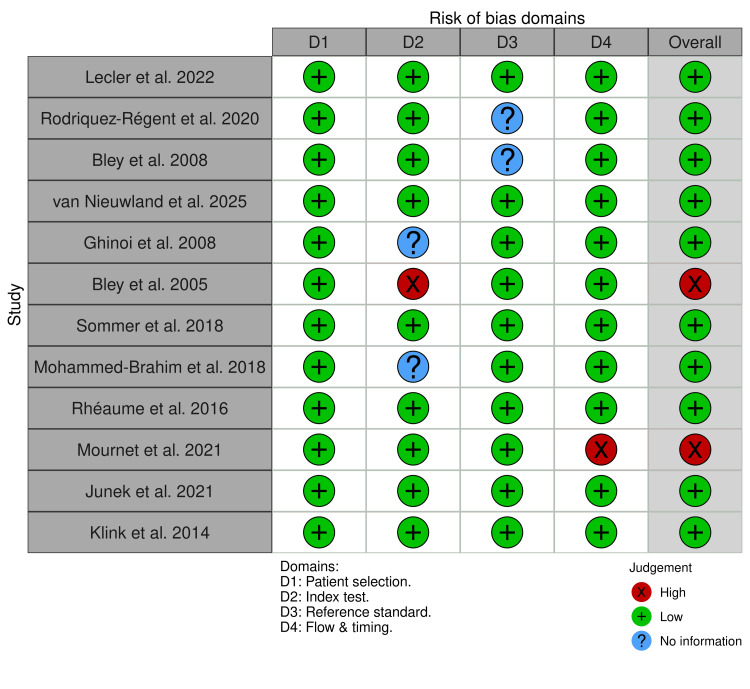 Figure 13
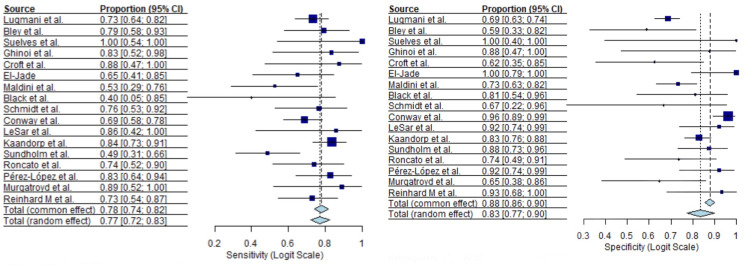 Figure 14
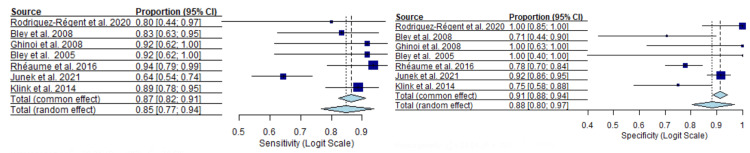 Figure 15
| First Author | Year | Design | Sample size |
| Luqmani et al. [ | 2016 | Prospective, multicenter diagnostic cohort study | 381 |
| Hansen et al. [ | 2022 | Prospective diagnostic accuracy cohort study | 106 Analyzed (US + TAB available): 78 |
| Aranda-Valera et al. [ | 2017 | Prospective diagnostic accuracy cohort | 451 suspected GCA TAB performed: 166 Final GCA diagnosis (clinical): 256 |
| Molina-Collada et al. [ | 2022 | Retrospective diagnostic accuracy cohort | 198 |
| Lecler et al. [ | 2022 | Prospective single-center diagnostic accuracy cohort | 45 |
| Rodriguez-Régent et al. [ | 2020 | Prospective diagnostic accuracy cohort | 32 |
| Bley et al. [ | 2008 | Retrospective diagnostic-accuracy cohort | 59 |
| van Nieuwland et al. [ | 2025 | Nested case–control diagnostic-accuracy study | 42 |
| Suelves et al. [ | 2010 | Prospective pilot diagnostic-accuracy study | 10 |
| He et al. [ | 2022 | Single-center retrospective diagnostic accuracy cohort study | 63 |
| Ghinoi et al. [ | 2008 | Prospective diagnostic accuracy cohort study | 20 |
| Bley et al. [ | 2005 | Prospective diagnostic accuracy cohort study | 20 |
| Croft et al. [ | 2015 | Retrospective diagnostic cohort study | 24 |
| El-Jade et al. [ | 2024 | Retrospective diagnostic accuracy cohort | 38 |
| Czihal et al. [ | 2020 | Prospective diagnostic accuracy cohort | 114 |
| Black et al. [ | 2013 | Retrospective diagnostic accuracy cohort | 50 (TAB subset: 21) |
| Schmidt et al. [ | 1997 | Prospective diagnostic accuracy cohort | 30 |
| Conway et al. [ | 2019 | Prospective diagnostic accuracy cohort | 162 |
| LeSar et al. [ | 2002 | Prospective diagnostic accuracy cohort | 32 |
| Kaandorp et al. [ | 2024 | Prospective diagnostic accuracy cohort | 242 |
| Sundholm et al. [ | 2019 | Prospective diagnostic accuracy cohort | 75 |
| Roncato et al. [ | 2017 | Retrospective diagnostic accuracy cohort | 42 |
| Pérez-López et al. [ | 2009 | Prospective diagnostic accuracy cohort | 54 |
| Maldini et al. [ | 2010 | Retrospective diagnostic accuracy cohort | 77 |
| Romera-Villegas et al. [ | 2004 | Prospective diagnostic accuracy cohort | 68 |
| Bilyk et al. [ | 2017 | Prospective diagnostic accuracy cohort, masked | 71 |
| Nesher et al. [ | 2002 | Prospective diagnostic accuracy cohort | 69 |
| Habib et al. [ | 2011 | Prospective diagnostic accuracy cohort | 32 |
| Pfadenhauer et al. [ | 2003 | Prospective diagnostic accuracy cohort | 67 |
| Murgatroyd et al. [ | 2003 | Prospective diagnostic accuracy pilot study | 26 |
| Reinhard et al. [ | 2003 | Prospective diagnostic accuracy cohort | 83 |
| Skoog et al. [ | 2024 | Retrospective diagnostic accuracy cohort study | 107 |
| Aschwanden et al. [ | 2010 | Prospective observational diagnostic study | 72 |
| Sommer et al. [ | 2018 | Prospective monocentric cohort | 27 |
| Mohammad-Brahim et al. [ | 2018 | Prospective single-center study | 27 |
| Rheuaume et al. [ | 2016 | Prospective cohort study | 171 |
| Mournet et al. [ | 2021 | Retrospective single-center | 64 |
| Junek et al. [ | 2021 | Retrospective cohort | 268 |
| Klink et al. [ | 2014 | Prospective multicenter cohort | 185 |
Peer Reviews
No public reviews on file for this paper yet. If you reviewed it on a platform where reviews are public (OpenReview, ICLR, NeurIPS, ICML), you can paste yours below so the community can read it here.
Videos
No videos yet. Explain this paper in a talk, walkthrough, or lecture? Add one.
Taxonomy
TopicsVasculitis and related conditions · Otitis Media and Relapsing Polychondritis · IgG4-Related and Inflammatory Diseases
Introduction and background
Giant cell arteritis (GCA) is a vasculitis of medium- and large-sized arteries that mostly affects older adults and carries an immediate risk of irreversible visual loss and other ischemic complications. In practice, the risk of irreversible visual loss often leads to immediate initiation of high-dose corticosteroids prior to imaging or temporal artery biopsy (TAB), and corticosteroid exposure before testing can reduce the sensitivity of subsequent diagnostic investigations [1,2]. TAB remains a widely used reference standard and is highly specific when positive, but it is invasive and imperfect: segmental inflammation produces skip lesions and biopsies, and therefore, can be falsely negative even when disease is present, a limitation that has important consequences for both diagnosis and management [3,4].
Because of these shortcomings, noninvasive vascular imaging has become central to modern diagnostic pathways. Color Doppler ultrasound (CDUS) can demonstrate the hypoechoic circumferential “halo sign,” a marker of mural edema and probable active arteritis, and early work suggested the halo sign had good specificity in the appropriate clinical context [5,6]. High-resolution, contrast-enhanced magnetic resonance vessel-wall imaging also identifies concentric wall thickening and post-contrast mural enhancement that correlate with histologic inflammation of the temporal artery, and single-center and multicenter series have reported promising sensitivity and specificity for dedicated protocols [7]. Practice guidelines have moved to reflect these data: international task forces now recommend early imaging; ultrasound or MRI, as part of the diagnostic workup for suspected cranial GCA where local expertise and equipment permit, although uptake and recommended sequencing vary by region and resource availability [8]. Reported accuracy for both CDUS and high-resolution MRI varies substantially between studies, driven by differences in operator experience, scanner and probe parameters, study populations, steroid timing, and choice of reference standard.
The clinical question therefore remains unsettled: is one imaging test consistently accurate enough to be preferred as the primary noninvasive diagnostic alternative to biopsy, or do trade-offs in availability, reproducibility, and diagnostic performance mean both tests retain complementary roles? This review addresses that question by pooling and directly comparing diagnostic accuracy estimates for CDUS versus high-resolution MRI, while paying close attention to bias risks that commonly inflate test performance in single studies.
Review
Methodology
We conducted a systematic review and meta-analysis of diagnostic accuracy studies of imaging for suspected GCA. Eligible studies enrolled adults with clinical features suggestive of GCA (for example, new temporal headache, jaw claudication, or acute visual symptoms). Studies were excluded if patients received high-dose corticosteroids for more than two weeks before imaging. Index tests evaluated were: (A) CDUS and (B) MRI of arteries relevant to GCA. For each study, we recorded the specific CDUS criteria used (for example, presence of a halo sign, intima-media thickness thresholds, unilateral versus bilateral criteria), probe frequency, arterial territories examined (temporal only versus temporal + axillary/extra-cranial), and for MRI the pulse sequences, use of dedicated head coils, field strength, contrast protocol, and the vessel-wall criteria applied.
Reference Standard and Verification
The primary reference standard was the temporal artery biopsy (histological demonstration of vasculitis). When a biopsy was not performed or reported, a study-level clinical diagnosis based on accepted criteria and clinical adjudication (commonly using American College of Rheumatology/European League Against Rheumatism (ACR/EULAR) clinical classification and local diagnostic pathways) [9] was accepted as a secondary reference standard. To address the potential for differential verification bias introduced by mixed reference standards, we prespecified subgroup and sensitivity analyses separating studies using biopsy alone from those using a clinical diagnosis (or composite reference) and performed analyses restricted to biopsy-confirmed cohorts where data permitted.
Data Sources and Search Strategy
We searched PubMed, Embase, Cochrane CENTRAL, and Google Scholar from inception to the date of the search. Search terms combined GCA vocabulary (e.g., “giant cell arteritis”, “temporal arteritis”) with imaging terms (“ultrasound”, “Doppler”, “halo”, “MRI”, “vessel wall enhancement”) and diagnostic keywords (“sensitivity”, “specificity”, “biopsy”). We supplemented database searches by screening reference lists of included studies and relevant reviews.
Study Selection and Data Extraction
Two reviewers independently screened titles/abstracts and full texts and extracted study data using a standardized form. For each imaging modality and study, we extracted or reconstructed 2×2 contingency tables (true positives, false negatives, true negatives, false positives) against the prespecified reference standard. When studies reported raw counts these were used directly. When only sensitivity, specificity and subgroup totals were provided, we back-calculated integer 2×2 counts by applying reported rates to reported denominators and rounding to the nearest integer; the specific rounding rule used was to round fractions ≥0.5 up and <0.5 down. We also extracted study design and conduct features relevant to heterogeneity and bias: study design (prospective/retrospective), sampling (consecutive/enriched sampling), patient demographics, clinical setting (fast-track/secondary/tertiary care), blinding of index test readers to reference standard results, timing between imaging and biopsy, and details of operator experience (sonographer training, radiologist expertise) and equipment where reported.
Risk of Bias Assessment
Each study was assessed with Quality Assessment of Diagnostic Accuracy Studies 2 tool (QUADAS-2) [10]. Domain-level judgements (patient selection, index test, reference standard, flow and timing) were completed independently by two reviewers, and disagreements were resolved by consensus. We reported QUADAS-2 domain ratings and used these to inform sensitivity analyses (for example, excluding studies at high risk in key domains).
Statistical Analysis and Investigation of Heterogeneity
We pooled sensitivity and specificity for each modality using a bivariate random-effects meta-analytic model [11]. We calculated pooled diagnostic odds ratios (DOR) and plotted summary receiver operating characteristic (SROC) curves. Heterogeneity was quantified using I² for sensitivity, specificity and DOR estimates, and visually inspected via forest and SROC plots.
Given the recognized influence of corticosteroids on the imaging yield, we extracted timing between steroid initiation and imaging (and between imaging and biopsy) whenever reported. Where possible we categorized imaging timing relative to steroid start (imaging before steroid initiation; imaging within zero to three days after initiation; imaging greater than three days after initiation) and included timing as a covariate in meta-regression or performed subgroup analyses. Where timing data were incompletely reported, we documented this and addressed it in sensitivity analyses or in explicit limitations.
Publication bias and small-study effects were assessed using funnel plots and Egger's regression tests as appropriate for diagnostic accuracy meta-analysis. All statistical analyses were performed using R programming meta-analysis software (packages for diagnostic meta-analysis and meta-regression) (Version 4.5.2, Foundation for Statistical Computing, Vienna, Austria, https://www.R-project.org/) and followed Preferred Reporting Items for a Systematic Review and Meta-analysis of Diagnostic Test Accuracy Studies (PRISMA-DTA) [12] reporting guidance. Results for the number of reconstructed tables, subgroup analyses, and sensitivity analyses are reported in the results section.
Results
Our systematic search and review process yielded a final set of 39 diagnostic accuracy studies [13-51], as shown in the PRISMA flow chart (Figure 1), meeting the inclusion criteria.
PRISMA flowchartPRISMA: Preferred Reporting Items for a Systematic Review and Meta-analyses.
Of these, 31 studies evaluated CDUS and 12 evaluated MRI. The combined analysis includes data from a total of 3,619 patients with suspected GCA. The populations were predominantly drawn from specialized vascular or rheumatology clinics, reflecting a high pre-test probability of disease in most cohorts. Study characteristics are shown in Table 1.
Across the 39 included studies, most evaluated a single imaging modality, with only a small subset assessing both CDUS and MRI within the same patient cohort. As a result, pooled diagnostic accuracy estimates for CDUS and MRI were derived predominantly from separate study populations. Comparisons between modalities in this meta-analysis therefore represent indirect, study-level comparisons based on pooled sensitivity, specificity, and diagnostic odds ratios, rather than paired within-patient analyses.
Thirty-one ultrasound studies comprising 2,766 patients were included in the quantitative synthesis. Reported sensitivity values varied widely across studies, with a median sensitivity of 0.83 (95% CI, I²=51.7%) and a range from 0.17 to 1.00. Specificity estimates were more consistent but remained heterogeneous, with a median specificity of 0.88 (95% CI, I²=47.4%) and a range from 0.59 to 1.00. Forest plots for pooled sensitivity and specificity are shown in Figures 2, 3.
Ultrasound sensitivity forest plot[13-43]
Ultrasound specificity forest plot[13-43]
Moderate heterogeneity was observed across both diagnostic parameters for the ultrasound modality.
Twelve MRI studies including 853 patients were analyzed. Sensitivity estimates were generally high, with a median sensitivity of 0.88 (95% CI, I²=53.1%) and a range from 0.61 to 1.00. Specificity estimates showed a median of 0.92 (95% CI, I²=59.2%), ranging from 0.71 to 1.00. Forest plots for MRI sensitivity and specificity are presented in Figures 4, 5.
MRI sensitivity forest plot[17-19], [22], [44-51].
MRI specificity forest plot[17-19], [22], [44-51].
Diagnostic odds ratios (DORs) for ultrasound demonstrated marked dispersion. The median DOR was 24.9 (95% CI), with individual study estimates ranging from 1.6 to 1,877 (Figure 6), indicating substantial between-study variability.
Ultrasound diagnostic odds ratios (DOR) forest plot[13-43]
MRI DORs were higher overall than those observed for ultrasound, with a median DOR of 72.0 (95% CI) and a range from 10.4 to 735 (Figure 7).
MRI diagnostic odds ratios (DOR) forest plot[17-19], [22], [44-51].
Compared with ultrasound, MRI DOR estimates showed less dispersion across studies.
The ultrasound SROC curve showed a median operating point of 83% sensitivity and 88% specificity, with wide scatter of individual study estimates (Figure 8).
Ultrasound summary receiver operating characteristic (SROC)[13-43]
The MRI SROC curve demonstrated a median operating point of 88% sensitivity and 96% specificity, with tighter clustering of contributing study estimates relative to ultrasound (Figure 9).
MRI summary receiver operating characteristic (SROC)[17-19], [22], [44-51].
Publication bias was assessed using Egger’s regression test. For ultrasound studies, the test indicated borderline asymmetry (p=0.0554; bias estimate 1.5460). MRI studies demonstrated significant asymmetry (p=0.0004; bias estimate 1.5974). Funnel plots illustrating these findings are shown in Figures 10, 11.
Ultrasound funnel plot[13-43]
MRI funnel plot[17-19], [22], [44-51].
Methodological quality was evaluated using the QUADAS-2 tool, with domain-level results presented in Figures 12, 13.
Ultrasound cohort QUADAS-2 resultsQUADAS 2: Quality Assessment of Diagnostic Accuracy Studies 2 tool. [13-43]
MRI cohort QUADAS-2 resultsQUADAS-2: Quality Assessment of Diagnostic Accuracy Studies 2 tool. [17-19], [22], [44-51].
For ultrasound studies, most domains were rated as low risk of bias, though uncertainties were noted in patient selection and index test blinding in several retrospective or older studies. MRI studies showed fewer concerns in applicability domains, though the smaller number of studies limits the robustness of these assessments. Overall, QUADAS-2 findings indicate variable risk-of-bias profiles across studies rather than uniformly low risk.
In the subgroup restricted to studies using temporal artery biopsy (TAB) as the reference standard, both ultrasound and MRI demonstrated consistently high diagnostic performance, with narrower confidence intervals compared with the overall analysis. For ultrasound (Figure 14), the TAB-based subgroup analysis yielded a pooled sensitivity of 0.7 (95% CI 0.72-0.83) using a random-effects model and 0.78 (95% CI 0.74-0.82) under common effects.
Pooled sensitivity and specificity of ultrasound in studies using temporal artery biopsy as the reference standard[13,18,20,22-24,26-34,40,41]
Pooled specificity was 0.83 (95% CI 0.77-0.90) with random effects and 0.88 (95% CI 0.86-0.90) with common effects. While several ultrasound studies reported perfect or near-perfect specificity, sensitivity estimates were more variable across studies, with some reporting values below 0.60.
For MRI (Figure 15), pooled sensitivity was 0.85 (95% CI 0.77-0.94) using a random-effects model and 0.87 (95% CI 0.82-0.91) under a common-effects model.
Pooled sensitivity and specificity of MRI in studies using temporal artery biopsy as the reference standard[18,22,44,45,48,50,51]
Pooled specificity for MRI was similarly high, reaching 0.88 (95% CI 0.80-0.97) with random effects and 0.91 (95% CI 0.88-0.94) with common effects. Individual study estimates showed moderate variability, particularly for sensitivity, although most point estimates clustered above 0.75.
Discussion
This meta-analysis indicates that high-resolution MRI of the cranial arteries is reported with greater consistency and less between-study variability than CDUS for diagnosing GCA. Reported CDUS accuracy is heterogeneous: a unilateral halo sign has been associated with pooled sensitivity of about 68% and specificity of 91%, while bilateral halo signs produced lower pooled sensitivity (43%) but very high specificity (100%), accompanied by substantial heterogeneity across studies [52]. In our pooled DOR analysis, CDUS values ranged widely (1.6-1,877), whereas MRI DORs were more tightly clustered around a higher median (72.0), a pattern that suggests more uniform discrimination by MRI in the published literature.
This apparent consistency for MRI should be interpreted with caution. MRI studies are fewer in number and are often performed in specialized academic centers using dedicated head coils and standardized vessel-wall sequences. Such settings can magnify measured performance through selection of patients, protocol standardization, and possibly publication bias. Thus, some of the observed difference may reflect study context and methodology rather than intrinsic superiority of the modality. Conversely, CDUS performance is highly sensitive to operator experience, choice of probe and Doppler settings, and the completeness of the arterial survey (temporal and axillary arteries in particular). Multicenter evidence shows that ultrasound accuracy improves in expert hands and with standardized protocols, but falls in less-experienced environments [53-60]. Importantly, CDUS can achieve high accuracy when performed by trained sonographers who follow guideline-recommended techniques. MRI interpretation is not free from similar concerns. Accurate MRI assessment requires radiologists experienced in vessel-wall imaging and appropriate pulse sequences; results can be affected by scanner field strength, sequence selection, spatial resolution, and timing of contrast administration. These MRI-specific sources of variability are less well reported in the literature but are relevant for implementation outside specialized centers. Taken together, both modalities have factors that influence real-world performance: CDUS is more operator-dependent, while MRI performance depends on scanner and protocol characteristics and reader expertise.
In our pooled data, forest plots of DOR illustrated this contrast. Ultrasound DORs ranged from 1.6 to 1,877, reflecting extreme heterogeneity (Figure 6), whereas MRI DORs clustered around a higher median value (72.0). This suggests that, within published studies, MRI offers more stable discrimination between GCA-positive and GCA-negative patients across centers. However, ultrasound accuracy can be high in expert hands and may decline in settings with less experience. This interpretation aligns with multicenter evidence showing that vascular ultrasound performance in suspected GCA varies according to operator expertise, protocols, and arterial territories examined, with more consistent results reported in specialized centers [53]. In TAB-confirmed studies, both ultrasound and MRI showed high diagnostic performance with reduced heterogeneity, providing more precise estimates than the overall analysis. MRI demonstrated slightly higher pooled sensitivity and specificity, though overlapping confidence intervals indicate these differences are modest and study-level rather than within-patient. MRI sensitivity was more variable, likely reflecting differences in imaging sequences, scanner resolution, timing relative to treatment, and interpretation criteria.
These findings have practical implications. The wide variability in CDUS performance likely reflects its operator dependence and sensitivity to technical factors. Diagnostic accuracy depends on sonographer experience, equipment, and scanning protocol [53-59]. Use of high-frequency linear probes, optimization of Doppler settings, and a standardized approach to examining temporal and axillary arteries reduce false-negative and false-positive findings [54]. Even with good technique, reported CDUS sensitivity varies widely: one meta-analysis found that requiring halo signs in more than one artery increased sensitivity toward 100%, while many single-center series reported substantially lower values [53]. MRI, by contrast, relies on standardized pulse sequences and dedicated head coils to depict mural inflammation, which may contribute to more uniform results in controlled settings. For example, one study reported similar sensitivity for MRI and CDUS in detecting temporal artery inflammation (60% vs 76%), but MRI achieved 100% specificity [58]. Clinically, this means that a negative ultrasound; particularly outside expert centers, may not exclude GCA, while a positive MRI strongly supports the diagnosis, acknowledging that MRI performance may vary with local expertise and protocols. Current EULAR and ACR guidance favors early ultrasound; including assessment of axillary arteries, within fast-track pathways because of its accessibility and speed. Our pooled results support ultrasound as a pragmatic first-line test in many settings but emphasize that a negative or equivocal ultrasound, particularly when obtained outside experienced units, does not exclude GCA. In those circumstances, MRI can provide complementary information and may have a high positive predictive value when obtained using appropriate vessel-wall protocols.
Timing and pre-test treatment substantially affect imaging yield. In routine practice, patients with suspected GCA are often started on high-dose corticosteroids immediately to reduce the risk of vision loss. Both ultrasound halo signs and MRI vessel-wall enhancement can diminish within days of treatment [57,58]. One review noted that ultrasound and MRI findings may normalize rapidly and should therefore be obtained as early as possible, preferably before or within the first day of treatment [58]. Guidelines similarly emphasize early imaging, recommending ultrasound (including axillary arteries) as the initial test, while noting that delayed imaging of any type increases false-negative rates [60]. Although our meta-analysis excluded studies with prolonged steroid exposure, real-world decision-making requires balancing treatment urgency against diagnostic yield. In many fast-track pathways, ultrasound is performed at presentation because of its immediate availability [53]. When ultrasound is negative or inconclusive but clinical suspicion remains high, MRI can be considered, particularly if steroid exposure has been brief. Consequently, it remains uncertain whether MRI and CDUS are equally susceptible to early corticosteroid effects in aggregated analyses. This limitation affects how pooled estimates translate to clinical practice, where treatment is often started immediately to protect vision.
Overall, our data show that MRI is associated with more consistent performance in published studies and that CDUS accuracy is highly variable but can be excellent in experienced hands. Differences in reported performance likely reflect a combination of modality characteristics, study selection, protocol standardization, operator and reader expertise, and publication patterns. A cautious interpretive approach that references guideline frameworks and local diagnostic resources will best serve clinicians faced with suspected GCA.
Limitations
The present analysis has several limitations. Heterogeneity in imaging protocols and diagnostic thresholds; including probe frequency, Doppler settings, MRI sequences, coil use, and arterial territories examined, contributed to between-study variance and limits direct comparability. Reference standards also varied, with some studies relying on clinical diagnosis or composite outcomes rather than biopsy or long-term adjudication, introducing potential misclassification bias. The timing of corticosteroid exposure was inconsistently reported, preventing stratification of diagnostic accuracy by treatment interval. MRI studies were predominantly conducted in specialized academic centers with standardized protocols, which may overestimate performance in routine practice and increase susceptibility to publication bias. Operator and reader effects further influence accuracy, as ultrasound depends on sonographer expertise and MRI on scanner characteristics and radiologist experience, yet these factors were inconsistently reported. Finally, potential publication and selective-reporting biases could inflate pooled estimates for either modality.
Conclusions
In conclusion, within the published literature, MRI shows more consistent and reproducible diagnostic performance for GCA, while CDUS demonstrates greater variability related to operator dependence. Both modalities play complementary roles. Ultrasound remains an effective and scalable first-line test in experienced centers, particularly within fast-track pathways, while MRI provides useful confirmatory information when ultrasound is inconclusive or expertise is limited. Imaging choice should be guided by clinical context, local expertise, access, and timing of corticosteroid therapy. Overall, our findings support imaging-based diagnostic pathways for GCA, with careful consideration of the strengths and limitations of each modality.
The reference list from the paper itself. Each links out to its DOI / PubMed record.
- 1Giant-cell arteritis and polymyalgia rheumatica N Engl J Med Weyand CM Goronzy JJ 505737120142533775910.1056/NEJ Mc 1409206 · doi ↗ · pubmed ↗
- 2Polymyalgia rheumatica and giant-cell arteritis Lancet Salvarani C Cantini F Hunder GG 23424537220081864046010.1016/S 0140-6736(08)61077-6 · doi ↗ · pubmed ↗
- 3Skip lesions in temporal arteritis Mayo Clin Proc Klein RG Campbell RJ Hunder GG Carney JA 504510511976 https://pubmed.ncbi.nlm.nih.gov/950804/950804 · pubmed ↗
- 4False-negative temporal artery biopsy Am J Surg Pathol Ashton-Key MR Gallagher PJ 634635161992159904210.1097/00000478-199206000-00014 · doi ↗ · pubmed ↗
- 5Color duplex ultrasonography in the diagnosis of temporal arteritis N Engl J Med Schmidt WA Kraft HE Vorpahl K Völker L Gromnica-Ihle EJ 133613423371997935812710.1056/NEJM 199711063371902 · doi ↗ · pubmed ↗
- 6Role of ultrasonography in the diagnosis of temporal arteritis Br J Surg Ball EL Walsh SR Tang TY Gohil R Clarke JM 176517719720102079929010.1002/bjs.7252 · doi ↗ · pubmed ↗
- 7High-resolution magnetic resonance vessel wall imaging in cerebrovascular diseases Neurol India Adhithyan R Kesav P Thomas B Sylaja PN Kesavadas C 112411326620183003810510.4103/0028-3886.236964 · doi ↗ · pubmed ↗
- 8EULAR recommendations for the use of imaging in large vessel vasculitis in clinical practice Ann Rheum Dis Dejaco C Ramiro S Duftner C 6366437720182935828510.1136/annrheumdis-2017-212649 · doi ↗ · pubmed ↗