MethylModes: computationally efficient detection of multimodal distributions in DNA methylation data
T Sophia Luo, Jonathon LeFaive, John Dou, Kelly M Bakulski, Erin B Ware, Matthew Zawistowski

TL;DR
MethylModes is a tool that efficiently detects multimodal DNA methylation patterns at individual CpG sites, helping researchers identify potential confounding factors in methylation data.
Contribution
MethylModes introduces a computationally efficient algorithm for detecting multimodal distributions in DNA methylation data using kernel smoothing and parallel processing.
Findings
MethylModes can be easily integrated into existing DNA methylation quality control pipelines.
The algorithm efficiently identifies peaks in methylation data at genome scale through parallel processing.
A case study demonstrates MethylModes' implementation in large-scale health studies.
Abstract
MethylModes is an R package and Shiny application to identify multimodal distributions in human DNA methylation at individual CpG sites. Multimodal distributions, which can be the result of nearby genetic variation, environmental exposures, or assay artifacts, are susceptible to confounding and important to identify for methylation analysis. MethylModes is easily incorporated into existing quality control pipelines of array-based DNA methylation data. The underlying algorithm uses kernel smoothing of probe-level data to locate the number and location of peaks. The algorithm can be parallelized across probes for efficient implementation at genome-scale. We provide a case study implementation of MethylModes in the Health and Retirement Study as well as the Airwave Health Monitoring Study. MethylModes is available on GitHub at https://github.com/lutiffan/methylModes as an R package…
Genes, proteins, chemicals, diseases, species, mutations and cell lines named across the full text — each resolved to its canonical identifier and authoritative record.
Click any figure to enlarge with its caption.
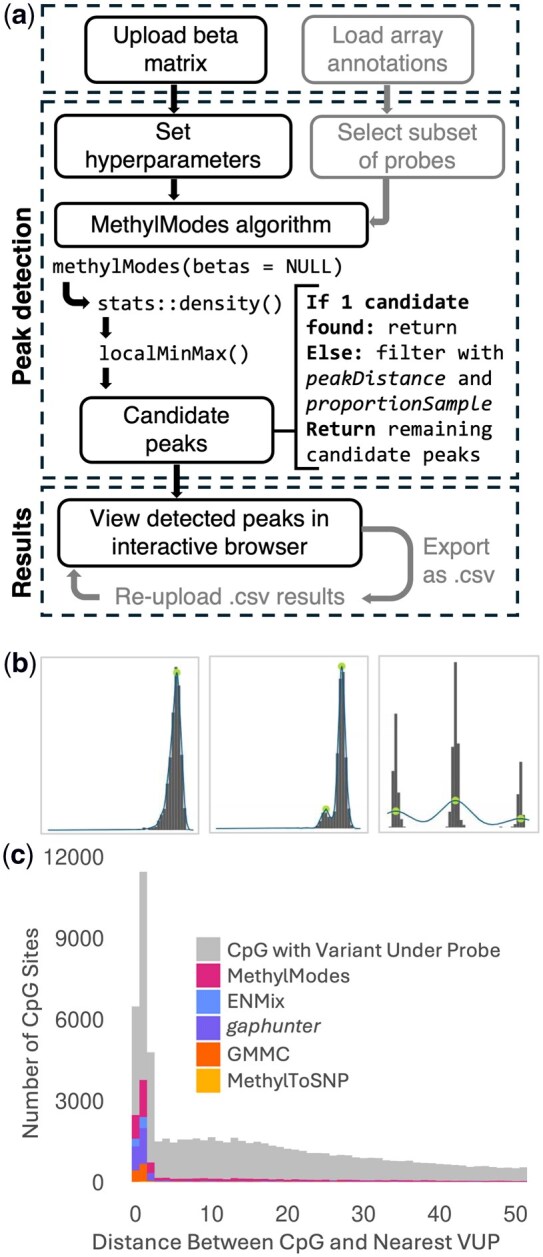 Figure 1
- —National Institute on Aging10.13039/100000049
- —University of Michigan10.13039/100007270
- —NIH/National Human Genome Research Institute Genome Science Training Program
Peer Reviews
No public reviews on file for this paper yet. If you reviewed it on a platform where reviews are public (OpenReview, ICLR, NeurIPS, ICML), you can paste yours below so the community can read it here.
Videos
No videos yet. Explain this paper in a talk, walkthrough, or lecture? Add one.
Taxonomy
TopicsEpigenetics and DNA Methylation · Cancer Genomics and Diagnostics · Gene expression and cancer classification
1 Introduction
DNA methylation is a dynamic biological process in which a methyl group is chemically bonded to DNA (Moore et al. 2013), usually at the cytosine nucleotide of a cytosine-phosphate-guanine (CpG) motif (Schultz et al. 2015). DNA methylation plays an essential role in physiological development by regulating gene expression (Moore et al. 2013). Changes in DNA methylation patterns are associated with adverse health outcomes (Robertson 2005), motivating epigenetic studies to investigate links between DNA methylation, genetic variation, environmental exposures, and disease. Array-based methylation assays, such as Illumina’s Infinium MethylationEPIC BeadChip, are efficient for quantifying DNA methylation levels across the methylome in large cohorts (Illumina Support, https://support.illumina.com/). However, the assays are susceptible to confounding by biological factors such as genetic variation at or near the probe binding site as well as technical artifacts such as cross-hybridization of the probe to multiple locations in the genome (Naeem et al. 2014, McCartney et al. 2016). These issues can result in probes with multimodal methylation values, which can violate regression assumptions, produce false associations, and reduce power to detect true associations. Empirical methods to identify multimodal CpG probes are therefore an important quality control procedure for a DNA methylation analysis.
Individual-level methylation at a specific CpG site is commonly quantified using the beta value, the ratio of methylated to total (unmethylated plus methylated) intensities in the biological sample. Beta values range between 0, indicating complete lack of methylation at all copies of the CpG site in the individual’s biological sample, to 1, indicating all CpG sites are methylated (Du et al. 2010). The distribution of beta values at a given CpG site across all samples provides insight into variation in methylation driven by biological factors as well as potential artifacts. Most CpG probes have unimodal distributions. A well-known cause of multimodality is a single nucleotide polymorphism (SNP) at the CpG site, which creates a trimodal distribution with distinct peaks corresponding to genotypes of the SNP. Methylation quantitative trait loci (mQTLs) and technical artifacts such as cross-hybridization can result in subtler, irregular forms of multimodality. We developed MethylModes to robustly identify multimodality in beta value distributions using an intuitive algorithm that avoids stringent modeling assumptions.
MethylModes builds on existing approaches. Andrews et al. proposed gaphunter to identify multimodal beta distributions based on “gaps” between discrete clusters of observed beta values (Andrews et al. 2016), a strong requirement that results in reduced ability to identify distinct clusters as sample sizes increase (Hu and Li 2018). MethylToSNP uses a clustering algorithm to identify probes with a SNP at or adjacent to the CpG site (LaBarre et al. 2019). Other methods allow for the identification of subtler multimodal distributions. Hu and Li proposed a Gaussian mixture model clustering (GMMC) approach. Xu et al. implemented a peak detection algorithm based on kernel density estimation (KDE) as part of the ENMix R package, which uses a sliding-window approach to identify local maxima (Xu et al. 2016). Figure 3, available as supplementary data at Bioinformatics online, illustrates the classification performed by gaphunter and GMMC. MethylModes uses a KDE approach to smooth the empirical beta value histograms and identify stationary points on the curve, then applies denoising steps to differentiate local maxima from distinct modes. MethylModes can be run on all CpG sites in an efficient parallelized manner or restricted to specific genomic regions. We implemented a user-friendly Shiny app to allow visual inspection of the multimodal calls. The app includes annotations for CpG sites on the Illumina Infinium HumanMethylation450 BeadChip, EPIC v1.0, and EPIC v2.0 arrays to cross-tabulate modality with various probe features, including relationships to CpG islands, SNPs under probes, and hypo- and hypermethylation status. MethylModes results can be exported as .csv files.
2 Materials and methods
2.1 Parameters and filtering
MethylModes has two peak detection parameters: peakDistance and proportionSample. peakDistance specifies the minimum distance required between two adjacent peaks. proportionSample specifies the minimum proportion of the sample size captured within the boundaries of the peak. The MethylModes app has optional thresholds for classifying hypo- and hyper-methylated sites, which are characterized by the probe-level mean and variance of beta values across the sample.
We applied a post-hoc filtering step based on the proportion of samples contained in the secondary peak (in MethylModes results, column “proportionSample_2”). Intuitively, sites for which the secondary peak contains a large proportion of samples represent unambiguous multimodality rather than noise. The proportion of samples in the secondary peak also provides a convenient means by which to rank CpG sites based on confidence in multimodality.
2.2 Peak detection algorithm
MethylModes uses the KDE method implemented in base R to infer the locations of distinct modes in distributions of beta values at individual probes (R Core Team 2024, https://www.r-project.org/). Figure 3, available as supplementary data at Bioinformatics online, provides illustration of algorithm steps and comparison to previous methods.
Smoothing of the empirical beta distribution: perform KDE using the stats::density() function.Detection of local maxima and minima:
- Approximate the slope by calling base::diff() on fitted KDE values.
- Calculate a logical vector: if slope > 0, then TRUE, else FALSE.
- Determine locations of stationary points by identifying indices where the logical vector switches from sequences of TRUE to FALSE and vice versa.
- Candidate peaks are defined as locations where the slope changes from positive to zero or negative, i.e. a local maximum. Classification of modality:
- If only one candidate peak was identified, classify the CpG site as unimodal.
- Otherwise, proceed to noise filtering steps.
- Calculate the proportion of the sample contained within each candidate peak. If a peak contains less than proportionSample of the sample and one of its bounding minima is equal to zero, it is considered noise and discarded.
- Adjacent peaks that are within peakDistance of each other are considered to be a group of local maxima that represent the same mode and are merged.
- Re-calculate sample proportion in merged peaks. If the combined proportion is below proportionSample, then discard it.
- If one peak remains, classify the CpG site as unimodal. Otherwise, classify the site as multimodal.
Figure 2, available as supplementary data at Bioinformatics online, contains pseudocode for the above steps.
2.3 Software input
The input for MethylModes is an R matrix of methylation beta values. Accepted formats include .csv and .RDS files. We recommend running MethylModes on methylation data that has already undergone standard quality control steps including removal of .idat file irregularities, sex mismatches, and technical replicates. MethylModes returns a .csv file with columns containing probe name, mean beta value across samples, MethylModes-inferred modality, peak location along with corresponding sample proportions and variances within each peak, and flags indicating hypo- or hyper-methylation status. Figure 1a summarizes the Shiny app workflow. A toy dataset is provided with the R package to demonstrate file format and to validate package installation. The MethylModes workflow is provided in Fig. 1, available as supplementary data at Bioinformatics online.
(a) Overview of full MethylModes workflow, with optional steps in grey; (b) Example visualizations of MethylModes results with identification of uni- or multimodality. Left to right: unimodal, multimodal (two peaks), and multimodal (three peaks); (c) Comparison of CpG sites with a variant under the probe (MAF > 0.01) identified by each method as multimodal in the HRS dataset as a function of distance between the CpG site and nearest SNP. MethylModes parameters were set to: proportionSample = 0.01, peakDistance = 0.10. MethylModes results were filtered to remove probes with a secondary peak smaller than 4% of the sample. All other methods were run using author-recommended parameters.
2.4 Real-world use cases: the health and retirement study and the airwave health monitoring study
The Health and Retirement Study (HRS) is a nationally representative, longitudinal study of Americans over age 50 (Juster and Suzman 1995, Sonnega et al. 2014). Blood DNA methylation was measured using the Illumina Infinium MethylationEPIC v1.0 BeadChip for 4018 HRS participants who participated in the 2016 Venous Blood Study. The dataset and methylation quality control steps have been previously described (https://hrs.isr.umich.edu/sites/default/files/biblio/HRS2016VBSDD_1.pdf, https://hrs.isr.umich.edu/sites/default/files/genetic/HRS_DNAm_OCT2023.pdf) (Crimmins et al. 2016, Faul et al. 2023). We performed further quality control by removing 95 431 probes with detection p-value < 0.0001 using the ewastools R package (Murat et al. 2020). An additional 41 071 probes were removed for cross-reactivity (Zhou et al. 2017). Twenty-four samples were excluded due to low signal intensity, control probe failures, or high genetic relatedness. A total of 3994 samples and 729 529 probes were analyzed in this study. The Airwave Health Monitoring Study consists of British police officers and staff (Robinson et al. 2020) obtained from the recountmethylation R package (Maden et al. 2023). Blood DNA methylation was measured using the Infinium HumanMethylation EPIC BeadChip for 1110 participants. We analyzed the available data based on previously described quality control steps (https://police-health.org.uk/sites/default/files/2024-06/Annex-K-DNA-Methylation.pdf) (Karimi and Chadeau-Hyam 2018).
The EPIC v1.0 manifest includes 729 529 probes whose hybridization sequence overlaps with at least one documented SNP, of which 74 417 include at least one SNP with minor allele frequency (MAF) > 0.01. We refer to these SNPs within probe hybridization sequences as variants under the probe (VUP). Because CpG sites with VUPs often have a multimodal beta value distribution, we defined the sensitivity of a method as the percentage of probes overlapping variants with MAF > 0.01 that were detected by the method (Price et al. 2013, Naeem et al. 2014). Default MethylModes parameter values were chosen using a grid search that balanced detection of probes with VUPs with sensitivity to noise (Fig. 4, available as supplementary data at Bioinformatics online). We chose parameter values of *proportionSample *= 0.01 and *peakDistance *= 0.10. Two additional parameter combinations were tested (Fig. 8, available as supplementary data at Bioinformatics online). A post-processing filter discarding multimodal calls whose secondary peak was smaller than 4% of the sample was applied, where the cutoff was determined by visual inspection (Fig. 6, available as supplementary data at Bioinformatics online). GMMC was implemented using the mclust R package and the post-processing parameters specified by Hu et al. with the user-specified parameter of OUT_CUTT set to 0.9 to filter out typical unimodal distributions (https://cran.r-project.org/web/packages/mclust/index.html) (Hu and Li 2018, Fraley et al. 2024). gaphunter was run using its author-recommended parameters. We ran the nmode function in ENMix using its default parameters. MethylToSNP software was found to be limited to datasets containing fewer than 2000 samples; to run it on HRS data, we created a copy with a minor modification removing the limitation.
3 Results and discussion
In the Health and Retirement Study dataset, MethylModes classified 10 967 of 73 645 (14.9%) autosomal CpG sites with VUPs with MAF > 0.01 as multimodal (Fig. 7, available as supplementary data at Bioinformatics online). Figure 1b provides examples of modality classifications. Of these, 5806 (52.9%) were not identified by other methods. ENMix identified 5132 (7.0%) of the VUP sites, gaphunter identified 3716 (5.0%), GMMC identified 1366 (1.9%), and MethylToSNP identified 81 (0.1%). Overlap with MethylModes was greatest with ENMix (90.9%) followed by GMMC (85.7%) and then gaphunter (60.1%) (Figs 7 and 8, available as supplementary data at Bioinformatics online). MethylModes demonstrated greater sensitivity to identify subtle multimodal patterns in which the VUP was further from the CpG site (Fig. 1c). Of probes called by gaphunter but not MethylModes, 1284 (86.6%) are probes initially called as multimodal by MethylModes but were discarded based on the filter requiring secondary peaks to contain at least 4% of samples. The low overlap with MethylToSNP is unsurprising, given the different objectives of the methods: MethylToSNP aims to find probes with SNPs 0–1 bp from the CpG site, using an algorithm that targets a “three-tier” pattern defined by two large gaps between three distinct clusters (LaBarre et al. 2019). Of the 79 probes found by MethylToSNP and not MethylModes, 12 had been filtered out of MethylModes results using the secondary peak; the remaining probes were visualized in the MethylModes Shiny app and found to have unimodal distributions. While the extent of overlap with calls from other methods changes with different MethylModes parameter values, it consistently remains the most sensitive method (Fig. 8, available as supplementary data at Bioinformatics online).
We ran all methods on the Airwave dataset (Fig. 9, available as supplementary data at Bioinformatics online). Results were consistent with that of a downsampled version of the HRS dataset (Fig. 10, available as supplementary data at Bioinformatics online). Namely, MethylModes identified the largest number of CpGs with VUP as multimodal, followed by gaphunter, highlighting the known sensitivity of gaphunter to smaller sample sizes.
4 Conclusion
MethylModes is an intuitive peak detection algorithm that contributes to the power of downstream epigenetic analyses. It provides a balance between computational efficiency and improved multimodal detection over existing methods (Fig. 11, available as supplementary data at Bioinformatics online) and is readily incorporated into existing pipelines. The MethylModes Shiny app is a novel tool for visual inspection of multimodal beta distributions. Given the subjective nature of multimodality, the app is a crucial accompaniment to interpret results and fills a critical gap in quality control of high-throughput methylation data. We assessed performance of MethylModes and other methods in the large and ancestrally diverse HRS dataset and confirmed performance in an independent cohort.
A key challenge is objectively defining multimodal distributions. Multimodality exists on a spectrum, ranging from distributions containing distinct and prominent peaks with clear separation to subtle fluctuations that can be attributable to noise. The primary goal of MethylModes is to distinguish unimodality versus multimodality rather than discerning the exact number of peaks since this aligns with analysis considerations. As with previous methods, inferred modality in MethylModes is sensitive to parameter choices (Figs 5 and 8, available as supplementary data at Bioinformatics online). Although MethylModes reduces subjectivity in peak detection by imposing numeric thresholds, we cannot avoid the inherent limitation in the lack of a formal definition for multimodality. Since the degree of multimodality is driven by a variety of biological and technical factors, the ultimate decision of whether to exclude a given probe from analysis is left to the investigator based on study goals. MethylModes empowers researchers to make informed quality control decisions for methylation array data.
Supplementary Material
btag045_Supplementary_Data
The reference list from the paper itself. Each links out to its DOI / PubMed record.
- 1Andrews SV , Ladd-Acosta C, Feinberg AP et al Gap hunting” to characterize clustered probe signals in Illumina methylation array data. Epigenet Chromatin 2016;9:56.10.1186/s 13072-016-0107-z PMC 514214727980682 · doi ↗ · pubmed ↗
- 2Crimmins E , Faul JD, Thyagarajan B et al Venous blood collection and assay protocol in the 2016 Health and Retirement Study 2016 Venous Blood Study (VBS). 2016.
- 3Du P , Zhang X, Huang C-C et al Comparison of beta-value and M-value methods for quantifying methylation levels by microarray analysis. BMC Bioinformatics 2010;11:587.21118553 10.1186/1471-2105-11-587PMC 3012676 · doi ↗ · pubmed ↗
- 4Faul JD, Crimmins E, Munro S et al HRS DNA Methylation—VBS 2016. Ann Arbor, MI: Survey Research Center, Institute for Social Research, University of Michigan, 2023.
- 5Fraley C , Raftery AE, Scrucca L et al Mclust: Gaussian mixture modelling for model-based clustering, classification, and density estimation. 2024.
- 6Hu K , Li J. Detection and analysis of Cp G sites with multimodal DNA methylation level distributions and their relationships with SN Ps. BMC Proc 2018;12:36.30275887 10.1186/s 12919-018-0141-x PMC 6157119 · doi ↗ · pubmed ↗
- 7‘Illumina Support’ (26 June 2025, date last accessed).
- 8Juster FT , Suzman R. An overview of the health and retirement study. J Hum Resour 1995;30:S 7–56.