Hospitalisations and Costs of Chronic Health Conditions Among Long‐Term Survivors of Childhood, Adolescent, and Young Adult Cancers in Queensland, Australia
Doreen Nabukalu, Louisa G. Collins, Daniel Lindsay, John Lowe, Katharina M. D. Merollini

TL;DR
This study examines hospitalizations and healthcare costs for long-term cancer survivors in Queensland, finding that chronic conditions like hypertension and depression significantly increase healthcare use and costs.
Contribution
The study provides new evidence on the impact of chronic conditions on hospitalization rates and healthcare costs among childhood and young adult cancer survivors.
Findings
16% of cancer survivors were hospitalized with chronic diseases, with hypertension and depression being most common.
Survivors with chronic conditions had higher inpatient admissions and higher mean annual healthcare costs.
Conditions like chronic kidney disease and schizophrenia incurred the highest individual healthcare costs.
Abstract
Adult cancer survivors are likely to be hospitalised with chronic illnesses, although evidence for childhood and AYA survivors is limited. This study quantified hospitalisations and the costs of health services used by survivors of childhood, adolescent, and young adult (AYA) cancers with and without chronic conditions. We assessed long‐term survivors (≥ 5 years past diagnosis) of childhood and AYA cancers diagnosed at ages 0–39 years between 1997 and 2011 in Queensland, Australia. Utilising a linked administrative dataset, we determined the prevalence of chronic conditions from hospital records using classification codes (ICD‐10‐AM) and quantified hospitalisations and associated costs in 2024 Australian dollars (AU$). Generalised linear regression modelling was used to examine how chronic conditions affected healthcare costs, controlling for clinical and socio‐demographic factors.…
Genes, proteins, chemicals, diseases, species, mutations and cell lines named across the full text — each resolved to its canonical identifier and authoritative record.
Click any figure to enlarge with its caption.
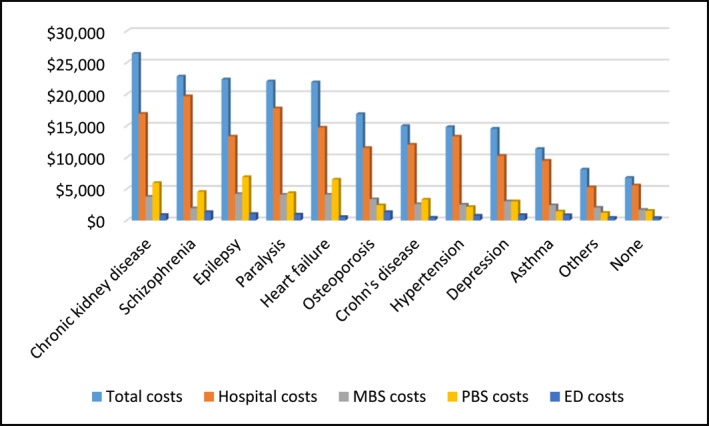 FIGURE 1
| Characteristic |
| % |
|---|---|---|
| Age at diagnosis | ||
| Mean (SD) | 29 (9.5) | |
| Follow up person years | ||
| Mean (SD) | 6.5 (4.3) | |
| Age categories, years | ||
| 0–14 | 1310 | 9.1 |
| 15–24 | 2255 | 15.6 |
| 25–39 | 10857 | 75.3 |
| Sex | ||
| Male | 6123 | 42.5 |
| Female | 8299 | 57.5 |
| Status (December 31, 2016) | ||
| Alive | 13798 | 95.7 |
| Dead | 624 | 4.3 |
| Country of birth | ||
| Australia | 12247 | 84.9 |
| Others | 2175 | 15.1 |
| Social economic index for areas (SEIFA) | ||
| Quintile 1 (least advantaged) | 1713 | 11.9 |
| Quintile 2 | 2781 | 19.3 |
| Quintile 3 | 3484 | 24.2 |
| Quintile 4 | 3378 | 23.4 |
| Quintile 5 (most advantaged) | 2990 | 20.7 |
| Accessibility/remote index of Australia | ||
| Major cities | 8531 | 59.1 |
| Regional | 5492 | 38.1 |
| Remote | 359 | 2.5 |
| Chronic conditions | ||
| No | 12136 | 84.1 |
| Yes | 2286 | 15.8 |
| Number of chronic conditions | ||
| 0 | 12136 | 84.1 |
| 1 | 1729 | 12 |
| 2 or more | 557 | 3.9 |
| Five most prevalent childhood cancers. | ||
| Leukaemias | 507 | 38.7 |
| Central nervous system | 114 | 8.7 |
| Lymphomas | 139 | 10.6 |
| Other malignant epithelial neoplasms | 122 | 9.3 |
| Neuroblastoma | 77 | 5.9 |
| Five most prevalent AYA cancers. | ||
| Melanoma | 4336 | 33.1 |
| Breast cancer | 1539 | 11.7 |
| Digestive organs | 983 | 7.5 |
| Thyroid and other endocrine glands. | 1287 | 9.8 |
| Female genital organs | 1075 | 8.2 |
| Number of primary cancer sites | ||
| One | 13974 | 96.9 |
| 2 or more cancers | 450 | 3.1 |
| Total ( | 0–14 years ( | 15–24 years ( | 25–39 years ( |
| |
|---|---|---|---|---|---|
|
|
|
| |||
| Chronic conditions | |||||
| Yes | 2286 (15.8) | 278 (21.2) | 275 (12.2) | 1733 (16.0) | |
| No | 12136 (84.1) | 1032 (78.8) | 1980 (87.8) | 9124 (84.0) | |
| Specific conditions | |||||
| Hypertension | 675 (4.7) | 129 (9.8) | 52 (2.3) | 494 (4.5) | < 0.001 |
| Depression | 463 (3.2) | 15 (1.1) | 78 (3.5) | 370 (3.4) | < 0.001 |
| Arthritis and osteoarthritis | 350 (2.4) | 07 (0.5) | 26 (1.1) | 317 (2.9) | < 0.001 |
| Asthma | 299 (2.1) | 55 (4.2) | 48 (2.1) | 196 (1.8) | < 0.001 |
| Paralysis | 253 (1.7) | 34 (2.6) | 32 (1.4) | 187 (1.7) | 0.031 |
| Epilepsy | 196 (1.4) | 23 (1.8) | 27 (1.2) | 146 (1.3) | 0.368 |
| Chronic heart failure | 162 (1.1) | 15 (1.1) | 23 (1.0) | 124 (1.1) | 0.878 |
| Ischaemic heart disease | 122 (0.8) | 00 (0.0) | 05 (0.2) | 117 (1.0) | < 0.001 |
| Chronic kidney diseases | 117 (0.8) | 02 (0.1) | 19 (0.8) | 96 (0.9) | 0.007 |
| Schizophrenia | 99 (0.7) | 01 (0.1) | 20 (0.9) | 78 (0.7) | 0.003 |
| Crohn's disease | 72 (0.6) | 00 (0,0) | 10 (0.4) | 62 (0.6) | 0.004 |
| Disorder of intellectual development | 66 (0.5) | 10 (0.8) | 14 (0.6) | 66 (0.5) | 0.074 |
| Bronchiectasis | 66 (0.5) | 35 (2.7) | 08 (0.3) | 23 (0.2) | < 0.001 |
| Osteoporosis | 26 (0.2) | 09 (0.7) | 05 (0.2) | 12 (0.1) | < 0.001 |
| Systemic lupus erythematosus | 20 (0.1) | 0 (0.0) | 03 (0.1) | 17 (0.2) | 0.468 |
| Multiple sclerosis | 19 (0.1) | 0 (0.0) | 0 (0.0) | 19 (0.2) | 0.048 |
| COPD | 16 (0.1) | 0 (0.0) | 01 (0.0) | 15 (0.1) | 0.375 |
| Cerebral palsy | 15 (0.1) | 04 (0.3) | 05 (0.2) | 06 (0.1) | 0.005 |
| Chronic respiratory failure | 14 (0.1) | 02 (0.1) | 01 (0.0) | 11 (0.1) | 0.582 |
| Others | 14 (0.1) | 0 (0.0) | 04 (0.2) | 10 (0.1) | |
| Variable | No chronic condition | Chronic condition | Total |
|
|---|---|---|---|---|
| Number of hospital admissions | ||||
|
| 7334 | 1782 | 9116 | |
| Mean (SD) | 1.0 (4) | 3.0 (10) | 1.0 (5) | < 0.001 |
| Median (IQR) | 0.3 (0.2–0.7) | 0.7 (0.4–1.9) | 0.4 (0.2–0.8) | |
| Total | 6964 | 5001 | 11965 | |
| Length of stay | ||||
|
| 7334 | 1782 | 9116 | |
| Mean (SD) | 1.5 (5.1) | 6.4 (15.3) | 2.5 (8.4) | < 0.001 |
| Median (IQR) | 0.5 (0.2–1.1) | 1.6 (0.6–5.5) | 1 (0.2–2.0) | |
| Total | 11186 | 11385 | 22571 | |
| Healthcare costs (AU$) | ||||
| Total cost | ||||
|
| 11554 | 2189 | 13743 | |
| Mean (SD) | $6798 ($19,055) | $19,227 ($36,957) | $8778 ($23,311) | < 0.001 |
| Median (IQR) | $2294 ($970–$2294) | $7496 ($3246–$19,110) | $2721 ($1098–$6700) | |
| Total | $78,500,000 | $42,100,000 | $121,000,000 | |
| MBS costs | ||||
|
| 11401 | 2146 | 13547 | |
| Mean (SD) | $1697 ($1567) | $3054 ($3914) | $1912 ($2801) | < 0.001 |
| Median (IQR) | $1055 ($561–$1930) | $2002 ($1023–$3651) | $1155 ($599–$2174) | |
| Total | $19,300,000 | $6,600,000 | $25,900,000 | |
| PBS costs | ||||
|
| 10661 | 2098 | 12759 | |
| Mean (SD) | $1539 ($8861) | $3433 ($9883) | $1850 ($9064) | < 0.001 |
| Median (IQR) | $29 ($0–$180) | $399 ($53–$2235) | $45 ($0–$314) | |
| Total | $16,400,000 | $7,200,000 | $23,600,000 | |
| Hospital costs | ||||
|
| 7334 | 1782 | 9116 | |
| Mean (SD) | $5569 ($16,490) | $15,049 ($32,688) | $7422 ($21,016) | < 0.001 |
| Median (IQR) | $1849 ($802–$4400) | $5398 ($2178–$5398) | $2226 ($918–$5694) | |
| Total | $40,800,000 | $26,800,000 | $67,700,000 | |
| Emergency visits | ||||
|
| 4777 | 1400 | 6177 | |
| Mean (SD) | $407 ($830) | $1081 ($2691) | $560 ($1501) | < 0.001 |
| Median (IQR) | $210 ($108–$430) | $459 ($200–$1014) | $244 ($120–$535) | |
| Total | $1,900,000 | $1,500,000 | $3,500,000 | |
| Un adjusted |
| Adjusted model 1 |
| Adjusted model 2 |
| ||||||
|---|---|---|---|---|---|---|---|---|---|---|---|
| exp (b) | (95% Cl) | exp (b) | (95% CI) | exp (b) | (95% Cl) | ||||||
| Age at first diagnosis | 1.01 | (1.00–1.01) | < 0.001 | Age at first diagnosis | 1.01 | (1.00–1.01) | < 0.001 | Age at first diagnosis | 1.01 | (1.00–1.01) | < 0.001 |
| Person years | 0.94 | (0.93–0.95) | < 0.001 | Person years | 0.94 | (0.93–0.95) | < 0.001 | Person years | 0.93 | (0.92–0.94) | < 0.001 |
| Number of cancers | 2.27 | (1.75–2.95) | < 0.001 | Number of cancers | 2.16 | (1.74–2.68) | < 0.001 | ||||
| Chronic condition | Chronic condition | Chronic condition | |||||||||
| Yes | 2.9 | (2.52–3.25) | < 0.001 | Yes | 2.3 | (2.04–2.59) | < 0.001 | Yes | 2.3 | (2.042–2.60) | < 0.001 |
| Country of birth | Country of birth | Country of birth | |||||||||
| Others | 0.86 | (0.75–0.98) | 0.026 | Others | 0.88 | (0.79–0.99) | 0.034 | Others | 0.85 | (0.75–0.96) | 0.008 |
| Sex | Sex | Sex | |||||||||
| Female | 1.14 | (1.03–1.25) | 0.01 | Female | 1.28 | (1.29–1.39) | < 0.001 | Female | 1.28 | (1.17–1.38) | < 0.001 |
| Status (31/Dec/2016) | Status (31/Dec/2016) | ||||||||||
| Dead | 5.46 | (4.32–6.91) | < 0.001 | Dead | 3.74 | (3.02–4.62) | < 0.001 | ||||
| ARIA | ARIA | ARIA | |||||||||
| Regional | 0.94 | (0.85–1.04) | 0.229 | Regional | 0.97 | (0.89–1.06) | 0.539 | Regional | 0.96 | (0.87–1.04) | 0.401 |
| Remote | 0.99 | 0.73–1.35) | 0.972 | Remote | 0.85 | 0.66–1.11) | 0.306 | Remote | 0.81 | 0.62–1.05) | 0.116 |
| Unknown | 1.01 | (0.40–2.56) | 0.978 | Unknown | 0.77 | (0.26–2.29) | 0.864 | Unknown | 0.91 | (0.29–2.82) | 0.866 |
| SEIFA | SEIFA | SEIFA | |||||||||
| Quintile 2 | 0.84 | (0.71–1.00) | 0.056 | Quintile 2 | 0.99 | (0.85–1.15) | 0.915 | Quintile 2 | 0.93 | (0.80–1.05) | 0.399 |
| Quintile 3 | 0.91 | (0.77–1.08) | 0.286 | Quintile 3 | 0.97 | (0.84–1.12) | 0.7 | Quintile 3 | 0.92 | (0.80–1.09) | 0.274 |
| Quintile 4 | 0.9 | (0.76–1.06) | 0.221 | Quintile 4 | 1.03 | (0.90–1.19) | 0.658 | Quintile 4 | 0.98 | (0.85–1.13) | 0.751 |
| Quintile 5 | 0.89 | (0.75–1.06) | 0.19 | Quintile 5 | 1.01 | (0.87–1.16) | 0.916 | Quintile 5 | 0.98 | (0.85–1.14) | 0.805 |
| Unknown | 0.79 | (0.40–1.54) | 0.486 | Unknown | 0.72 | (0.33–1.58) | 0.413 | Unknown | 0.67 | (0.29–1.50) | 0.329 |
| Chronic health conditions | Chronic health conditions | Chronic health conditions | |||||||||
| Schizophrenia | Schizophrenia | Schizophrenia | |||||||||
| Yes | 3.34 | (1.89–5.90) | < 0.001 | Yes | 1.86 | (1.15–3.00) | 0.012 | Yes | 1.64 | (1.00–2.71) | 0.051 |
| Chronic kidney disease | Chronic kidney disease | Chronic kidney disease | |||||||||
| Yes | 7.78 | (4.74–12.79) | < 0.001 | Yes | 3.5 | (2.23–5.47) | < 0.001 | Yes | 3.82 | (2.39–6.10) | < 0.001 |
| Heart failure | Heart failure | Heart failure | |||||||||
| Yes | 4.45 | (2.91–6.80) | < 0.001 | Yes | 1.38 | (0.94–2.02) | 0.101 | Yes | 1.61 | (1.07–2.40) | 0.021 |
| Paralysis | Paralysis | Paralysis | |||||||||
| Yes | 3.35 | (2.31–4.84) | < 0.001 | Yes | 1.34 | (0.96–1.83) | 0.07 | Yes | 1.57 | (1.13–2.18) | 0.007 |
| Epilepsy | Epilepsy | Epilepsy | |||||||||
| Yes | 3.46 | (2.31–5.19) | < 0.001 | Yes | 1.31 | (0.93–1.86) | 0.123 | Yes | 1.48 | (1.03–2.12) | 0.033 |
Peer Reviews
No public reviews on file for this paper yet. If you reviewed it on a platform where reviews are public (OpenReview, ICLR, NeurIPS, ICML), you can paste yours below so the community can read it here.
Videos
No videos yet. Explain this paper in a talk, walkthrough, or lecture? Add one.
Taxonomy
TopicsChildhood Cancer Survivors' Quality of Life · Adolescent and Pediatric Healthcare · Family Support in Illness
Background
1
Chronic health conditions are Australia's largest disease burden comprising 91% of the non‐fatal burden, 78% of the fatal burden, and over one‐third of the total healthcare expenditure [1, 2, 3]. They encompass a range of long‐term illnesses, which last at least 6 months, and gradually lower the quality of life [4]. According to the Australian Institute of Health and Welfare (AIHW), close to half (47%) of Australians have at least one chronic health condition [5].
Although prevalence estimates for AYAs (defined in this study as being aged 15–39 years) are not routinely reported as a single group, national data reports around 45% of Australian children (defined in this study as being aged 0–14 years) live with at least one chronic condition [6]. A recent study in NSW highlighted this growing health concern in adolescents particularly in relation to mental health disorders with well‐documented impact on psychological well‐being, and developmental outcomes in young people [7]. Among Australian children, asthma, hay fever, and mental health problems are common, while AYA often experience back problems, asthma, arthritis, and diabetes [8].
Children and AYA with a previous cancer diagnosis are at a higher risk of developing a chronic condition such as cardiomyopathy, stroke, chronic kidney disease, asthma, depression, hypertension, and arthritis among others, compared to their counterparts without a history of cancer [9, 10, 11, 12, 13]. As reported in international studies with large survivorship cohorts, about 60%–88% of childhood and AYA cancer survivors have at least one chronic health condition, with an estimated 25%–40% developing severe, disabling, or life‐threatening conditions over the life course [11, 12, 13]. This heightened risk is attributed to the effects of cancer treatment, including cardiovascular and respiratory complications, hormonal irregularities, and mental health complications, which often emerge and persist years after completion of treatment. Furthermore, the effects of chronic psychological conditions such as depression and schizophrenia extend far beyond medical outcomes and health care costs. They additionally cause disruptions in education, employment, and social participation, which ultimately compound the economic and psychosocial burden experienced by survivors [14, 15, 16].
Although prior studies report a high prevalence of chronic conditions among childhood and AYA cancer survivors, population‐based evidence for long‐term survivors in Australia is limited. While AIHW's National Centre for Monitoring Chronic Conditions (NCMCC), conducts surveillance of chronic health conditions for the general population, it does not capture condition‐specific information for cancer survivor populations. Additionally, although chronic conditions require ongoing medical attention due to their persistent nature [8, 17], there is limited evidence quantifying their impact on health service use, such as hospitalisation and the economic implications in high‐risk groups including survivors of childhood and AYA cancer [17].
To address these gaps, our study used population‐based linked administrative data from Queensland to examine the chronic diseases in admitted long‐term childhood and AYA cancer survivors. We describe and quantify hospitalisations and the costs of all health services used, comparing cancer survivors hospitalised with a chronic condition as a principle or other diagnosis and those without chronic conditions. Highlighting the concentration of the health care cost in young cancer survivors is critical for understanding the broader impact of cancer survivorship on the demand of health services [18] and for informing targeted allocation of resources to survivor populations with high health care needs.
Methods
2
Study Design
2.1
We undertook a cost analysis based on a retrospective longitudinal cohort study with linked administrative healthcare data [19]. We conducted the analysis from the government health provider's perspective which included public hospital and medical service costs and excluded patient out‐of‐pocket expenses and private health insurance payments.
Australia's Healthcare System
2.2
Australia has a predominantly publicly funded healthcare system, with the Federal Government contributing about two‐thirds of the healthcare budget and the remainder covered by private health insurance and patient out‐of‐pocket expenses [20]. Through Medicare, the national health insurance scheme, eligible residents receive free public hospital services and subsidised nonhospital services via the Medicare Benefits Schedule (MBS). This covers general practitioner visits, specialist consultations, diagnostic imaging, and pathology. The Pharmaceutical Benefits Scheme (PBS) provides subsidised medicines. In Queensland, the Queensland Children's Hospital delivers, comprehensive cancer care for children while the Queensland Youth Cancer Service (QYCS) offers specialised care for AYA (aged 15–25) through a state‐wide network of clinicians across public and private healthcare systems. After treatment, follow up and survivorship care is continued through hospital‐based clinics led by specialists and general practitioners (GPs), who collaborate to manage late effects, comorbidities, and disease surveillance throughout the transition to adult care [21, 22, 23].
Data Sources and Data Linkage
2.3
We used data from a population‐based data linkage study [19], which comprised all people diagnosed with cancer between 1st January 1997 and 31st December 2015 in Queensland, Australia. Queensland is the third most populous state in Australia, with a population of approximately 5.4 million residents [24]. All cancer diagnoses in the state, except for basal and squamous cell carcinoma of the skin, must be reported to the Queensland Cancer Registry (QCR) with relevant information. Using unique identifiers and probabilistic methods, selected QCR patients were linked to other administrative databases, including the Queensland Hospital Admitted Patient Data Collection (QHAPDC), Emergency Department Information System (EDIS), Medicare Benefits Schedule (MBS) and Pharmaceutical Benefits Scheme (PBS). More information on the data linkage process is available in a previous publication [19]. This linkage process generated a comprehensive dataset with information on the socio‐demographics, clinical data, health service use and costs, as shown in Supporting Information S1: Figure 1.
Study Population and Sample Selection Criteria
2.4
The study population comprised individuals diagnosed with cancer in Queensland between January 1997 and December 2011. We included long‐term survivors of childhood and AYA cancer, defined as those aged 0–39 years at diagnosis, and alive at least 5 years after diagnosis. All individuals with multiple primary cancer diagnoses were included; however, baseline demographic characteristics and subsequent analyses were based on the individual's first (and therefore primary) cancer diagnosis. We identified chronic diseases from the International Statistical Classification of Diseases and Related Health Problems, Tenth Revision, Australian Modification (ICD‐10‐AM) codes recorded in the hospital data. In Australia, the ICD‐10‐AM classifies diseases, injuries, and related health problems. In the tenth revision, supplementary codes for 29 clinically significant chronic health conditions and the new Australian coding standard (0003 Supplementary codes for chronic conditions) were developed [25]. We used the Independent Health and Aged Care Pricing Authority (IHACPA) mapping algorithms [26] to convert the supplementary codes to their equivalent ICD‐10‐AM codes and code descriptions. For our analysis, we included ICD‐10‐AM codes for a principal or additional diagnosis during an episode of care. Therefore, survivors without hospital data after their cancer diagnosis were excluded (Supporting Information S1: Figure 1).
We obtained ethics approval from the Australian Institute of Health and Welfare (AIHW #EO2017/3/348) and the University of the Sunshine Coast Human Research Ethics Committee (UniSC HREC Approval #A/17/941).
Cancer Site Classifications
2.5
We assigned cancer sites using two classification systems. The ICD‐03 for AYA aged 15–39 years [27] or the International Childhood Cancer Classification system (ICCC) for childhood cancers (0–14 years) [28]. In consideration of the different cancer classifications, we summarised cancer types according to these broad groups (children or AYA).
Socio‐Economic Indexes for Areas (SEIFA) and Accessibility/Remoteness Index of Australia (ARIA)
2.6
We used the ARIA to assess the geographical distribution of patients [29]. Given the small numbers of cancer survivors residing in more remote areas, we compressed the ARIA categories into ‘major cities’, ‘regional/outer regional’ and ‘remote/very remote’ locations. SEIFA was used to compare outcomes across different socioeconomic groups. SEIFA scores provide a relative measure of socio‐economic advantage and disadvantage. The scores are based on census data on people's access to materials and resources, such as education and employment based on their location of residence [30]. We categorised SEIFA into quintiles, with the first quintile being the least disadvantaged and the fifth quintile being the most advantaged.
Study Outcome Measures
2.7
Our primary outcomes were prevalence of chronic conditions, health service use and annual direct healthcare costs. We quantified the inpatient hospital admissions and length of stay using variables in the QHAPDC dataset and valued these admissions using cost weights from the Australian Refined Diagnosis‐Related Groups (AR‐DRG) codes related to each episode of care. Each AR‐DRG code for public hospital admissions and Urgency Related Groups (URG) codes for emergency presentations was selected from the 2018 National Hospital Cost Data Collection (NHCDC) report [31]. We extracted government costs for out‐of‐hospital medical services and pharmaceuticals from linked MBS and PBS records, respectively.
Data Analysis
2.8
Descriptive statistics were conducted for baseline factors including age at diagnosis, sex, country of birth, survival status, geographical remoteness, and socio‐economic status. For continuous variables, we reported means and standard deviations (SD), medians and inter‐quartile ranges (IQR), while we described frequencies and percentages for categorical variables. For people with more than one cancer diagnosis, baseline factors were based on the first primary cancer diagnosed.
The frequency of conditions was counted and aggregated per person, and the population was stratified into two groups: having a chronic condition or no chronic condition. Depending on the frequencies in each age group, Chi‐square or Fisher's exact tests were used to compare the prevalence of chronic health conditions among children and AYA.
We assessed outcomes for the long‐term phase of care, which spans from the fifth year after diagnosis to 31st December 2016 or one year before death for deceased participants (Supporting Information S1: Figure 2). This assessment period was used to generate the follow‐up person‐years for each participant, potentially ranging from 0.1 to 15 years.
Counts for inpatient hospital admissions and aggregated days for length of stay were generated per person. These were divided by the person‐years in the assessment period to generate the mean hospital admissions per person per year.
Total healthcare costs were the sum of the costs for hospital admissions, emergency department presentations, medical services, and pharmaceuticals. We divided the total costs by the person years to generate costs per person per year. Means and SDs, and medians and IQRs were calculated for the total healthcare costs and for each type of health service. Using the non‐parametric Mann‐Whitney test, we assessed the differences in hospital admissions, length of stay, and healthcare costs between people with and without chronic health conditions. Only people who used services in the long‐term phase were included in the cost calculations.
We assessed the effect of having a chronic health condition on healthcare costs using a generalised linear regression model with a log link function and gamma distribution. Given that cost data is typically right skewed, we selected this distribution and function because of their optimal model fit diagnostics. The covariates were age at diagnosis, person‐years, number of prior malignancies, country of birth, sex, mortality during follow‐up, ARIA, and SEIFA. The cost ratio (CR) was calculated, and a ratio greater than 1 signifies a higher cost than the referent group.
Cost estimates were calculated in Australian dollars, adjusting for inflation to 2024 using the Consumer Price Index's healthcare component. Statistical significance was determined using a p‐value of less than 0.05. All statistical analyses were conducted using STATA software, version 16.
Results
3
The final sample size comprised 14,422 participants, representing 57% of the total study sample, as shown in Supporting Information S1: Figure 1.
Study Population Characteristics
3.1
Most participants were aged 24–39 years (75.3%) with a mean age of 28.9 years (SD:9.5) at diagnosis and born in Australia (84.9%). Slightly more participants were female (57.4%) and the majority lived in major cities (59.1%). Participants were followed up over a mean of 6.5 (SD:4.3) person‐years and 4.3% (n = 624) of participants died during the cohort period. SEIFA quintiles were similar in terms of study participant distribution, varying from 19.3% to 24.2%, except for the least disadvantaged group (quintile 1), which comprised 11.9% of participants. The most common childhood cancers were leukaemias (n = 507, 38.7%), lymphomas (n = 139, 10.6%), Central nervous system (CNS) cancers (n = 114, 8.7%), malignant epithelial neoplasms (n = 122, 9.3%), and neuroblastoma and other peripheral nervous cell tumours (n = 77, 5.9%). Among AYAs, the predominant cancers were melanoma (n = 4336, 33.1%), breast cancer (n = 1539, 11.7%), digestive cancers (n = 983, 7.5%), thyroid and other endocrine glands (n = 1287, 9.8%), and male (n = 1,075, 8.2%) and female (n = 877, 7.4%) genital organ cancers (Table 1).
Prevalence of Chronic Health Conditions
3.2
Approximately 16% of the survivors (n = 2286) presented with a chronic condition as a principal or other diagnosis at hospital admissions. These were most prevalent among those aged 25–39 years (n = 1733, 75.8%) compared with those aged 15–24 years (n = 275, 12.0%) and children 0–14 years old (n = 278, 12.2%) (Table 2).
Overall, the most common chronic conditions were hypertension (n = 675, 4.7%), depression (n = 463, 3.2%), arthritis and osteoarthritis (n = 350, 2.4%), asthma (n = 299, 2.1%), paralysis (n = 253, 1.7%), epilepsy (n = 196, 1.4%) and chronic heart failure (n = 162, 1.1%). Multi‐morbidity was not common in our study sample with and only occurred in 3.8% of participants (n = 557), mostly young adults aged 25 years and above having at least two chronic conditions (Table 2).
All‐Cause Health Service Use
3.3
Overall, our sample had one (SD = 4.5) inpatient admission and 2.5 (SD = 8.4) days of stay per person per year (Table 3). Those with a chronic condition had an annual mean of 3 (SD = 10) inpatient admissions and 6.4 (SD = 15.3) days of stay which was significantly higher than those without chronic conditions (mean 1, SD = 4 inpatient admission and mean 1.5, SD = 5.1 days of stay) per person per year (Table 3).
Healthcare Costs Among Long‐Term Cancer Survivors
3.4
The total healthcare costs for the sample during the survivorship period were AU121 million (Table [3](#pon70395-tbl-0003)). By type of health service, hospital admission costs were the highest (AU67.7 million), followed by costs incurred by the MBS (AU23.6 million) and emergency department (AU8778 (SD = AU2721 (IQR = AU6700) during the long‐term survivorship period. The costs were significantly higher for people with chronic conditions (mean AU36,957 and median AU3246–6,798, SD = AU2,294, IQR = AU2294) (Table 3). This pattern was observed for all health services. The highest costs per person per year were related to hospital admissions among those with (mean AU32,688 and median AU2178–5,569, SD = 1,849, IQR AU4400). Emergency department costs per person per year contributed the least cost for people with chronic condition (mean AU2691 and median AU200–407, SD = AU 210, IQR = AU430) (Table 3).
Healthcare Costs by Type of Chronic Health Condition
3.5
Annual costs were highest for people with chronic kidney disease (mean AU30,331 and median AU5651–22,835 SD = AU10,460, IQR = AU20,924) (Supporting Information S1: Table 1). These were followed by epilepsy (mean AU37,224 and median AU4749–22,051, SD = AU9,285, IQR = AU27,679) and chronic heart failure (mean AU38,763 and median AU2652–5.4 million and $4.3 million, respectively. Irrespective of the condition, hospitalisation was the biggest driver of the total healthcare costs (Figure 1) (Supporting Information S1: Table 1).
Mean annual healthcare costs by specific chronic condition and health service. MBS, medicare benefits schedule; PBS, pharmaceutical benefits scheme.
Factors Associated With High Healthcare Costs
3.6
Having a chronic health condition was associated with 2.3‐fold higher healthcare costs than those without a chronic condition, after accounting for patient and clinical factors (Table 4). Having chronic kidney disease and schizophrenia resulted in the highest costs, with a 3.5‐fold increase and 1.9‐fold increase compared to those without a chronic condition, respectively. The number of previously diagnosed cancers had a 2.2‐fold increase in healthcare costs. Females had 1.3 times higher costs than males. Age at diagnosis is less likely to affect healthcare costs; costs slightly decrease with a unit increase in the follow up person years (Cost ratio = 0.94, p < 0.001). Compared to people born in Australia, costs were slightly less for those born outside of Australia (Cost ratio = 0.88, p = 0.034). Healthcare costs for deceased participants were 3.7 times higher than for living participants. Geographic location and socioeconomic status had no significant association with healthcare costs.
Excluding the factors ‘death’ and ‘number of previous cancers’ did not change the relationship between healthcare costs, chronic disease, and other factors (Table 4). Due to the small sample size, being hospitalised with one chronic condition or more had a similar impact on the cost hence the multimorbidity factor was excluded in the final analysis.
Discussion
4
We found a notable proportion of long‐term childhood and AYA cancer survivors experienced hospital admissions with a chronic condition as either a primary or secondary diagnosis. Those with chronic conditions had more hospital admissions, longer stays, and higher healthcare costs than survivors without chronic conditions but whom also had hospital admissions. These findings affirm the high burden of chronic illnesses in childhood and AYA cancer survivors reported in previous international studies [9, 32, 33] and demonstrate the substantial health care demand and cost burden associated with cancer in the young population.
International studies, such as those conducted in US and UK [10, 17, 32] report a higher prevalence which likely reflect methodological differences in the studies. For instance, Ehrhardt et al. (2021) conducted a study on chronic conditions in AYA survivors of childhood cancer, using the cumulative burden approach that count multiple reports per condition. The study found an average of 22.3 and 40.3 conditions among those age 18 and 26 years, respectively [10]. Compared to this study's average of one chronic condition per person which was based on number of individual conditions, our method might have produced a conservative estimate of chronic condition prevalence. While multi‐morbidity is common in cancer survivors, few individuals in our cohort exhibited more than one chronic condition. The relatively young survivor population in this study may explain this as multi‐morbidity generally increases with age [34].
Despite our finding of overall annual healthcare costs being lower than those reported in the US and higher than those in France or Taiwan [35, 36] the findings are consistent with previous reports in adult and AYA cancer survivors, showing higher costs for those with chronic conditions [37]. The complex late effects of cancer treatment, combined with ongoing management of chronic conditions drives these costs higher through increased use of additional services like hospitalisations and specialist care [17].
Although conditions such as schizophrenia and chronic kidney disease were relatively uncommon, they were associated with disproportionately high per person costs likely due to the resource intensive hospital‐based treatment procedures such as, dialysis or prolonged psychiatric care. Previous research indicates that compared to other mental health disorders, schizophrenia imposes a disproportionately high economic burden with health care costs nearly twice those associated with effective psychosis [38]. Our study's findings, which are consistent with those previously published by Fitzgerald et al. (2007) further reinforce this impact on the healthcare system [39].Likewise, our cost estimates for chronic kidney disease align with stage‐based variations reported elsewhere [40]. In 2019, people with early‐stage CKD disease experienced costs between AU2,719, whereas those with stage 4–5 disease or end‐stage renal failure ranged from AU62,000 [40]. Our study's cost estimates fall within this range.
Hypertension and depression were the most common chronic condition in our study similar to reports based on other cohorts of long‐term childhood and AYA cancer survivors [41, 42] which report at least one in four AYA survivors to be affected with mental health disorders, such as depression and over 70% with hypertension [43]. While these conditions are associated with relatively low per person costs, their high prevalence increases the demand of relevant healthcare which cumulatively drives up healthcare costs. Previous studies conducted in New South Wales, Australia [44] and the US, show that cancer survivors had significantly increased use of mental health services, medication and psychotherapy 5 years after diagnosis compared to non‐cancer survivors [41]. Integrating health interventions like psychosocial support, lifestyle modification programs, and targeted mental health interventions in survivorship care may help to reduce the risk of conditions like hypertension and mental health conditions and consequently system‐level costs.
Typically, hospitalisations incur high expenditures compared with other healthcare services as evidenced by literature [35, 36, 45]. Australia's centralised model of paediatric and AYA cancer care, delivered through institutions such Queensland Children's Hospital and Queensland Youth Cancer Service may explain the high inpatient costs and the relatively minimal influence of socioeconomic status and geographic remoteness on healthcare cost variations.
While literature shows end‐of‐life healthcare costs for cancer survivors to be typically high [46], our study excluded the costs associated with the last year of life which implies that the observed high‐cost burden in those who died is likely due the burden of late effects and the chronic survivorship needs rather than terminal care [47].
Survivors with multiple primary cancer diagnoses also showed higher costs which is likely reflective of the cumulative burden of intensive therapies, associated adverse effects and the resulting need for coordinated multidisciplinary care and follow up [48].
Unlike previous studies [46], we did not find a strong relationship between age and healthcare costs. This may reflect our focus on long‐term survivorship (5 years post‐diagnosis) rather than the early post‐treatment period, when age‐related cost variation is more pronounced [46].
Study Limitations
4.1
Our study had several strengths and limitations. First, our inability to include services that were sought outside the public healthcare system, such as private hospital and other non‐institutionalised services, underestimated overall health service use and costs. Second, our restriction of the sample to survivors with hospital admissions and the lack of a control group limit direct comparisons with the general population. Lastly, our estimates reflect all‐cause health service use rather than condition specific care and therefore cannot definitively establish the role of specific primary healthcare services in managing chronic conditions.
Balanced against these study limitations, we used data from routinely collected electronic healthcare records, which are void of recall bias, commonly associated with self‐reported responses. In our assessment of chronic condition prevalence, we used simple counts of chronic conditions specified for the ICD‐10 a.m. This approach is supported by Farley et al. [49] who found simple count measures to be better predictors of expenditure when compared to pre‐existing universal comorbidity indices such as the Charlson Comorbidity index [50] and Elixhauser Comorbidity Measure (ECM) [51]. Also, current measures for chronic conditions and comorbidity, which are primarily used to predict mortality and morbidity, lack country‐specific weightings [52]. The large population‐based cohort of our study enhanced representativeness, reduced sampling bias and enabled detection of the less common conditions in the younger age groups. However, given that the last participants in our cohort were diagnosed in 2011, there is a need to update these estimates with more recent data. Since then, new developments in precision medicine and modern treatment guidelines that feature less toxic approaches have further enhanced survival outcomes and potentially reduced the burden of late effects [53]. Furthermore, recent events such as the Covid 19 epidemic could also have had an impact on the long‐term survivorship outcomes and consequently healthcare use patterns and cost trends hence the need for more recent investigations [54].
Clinical Implications
4.2
This research presents a unique chronic disease pattern in survivors of childhood and AYA cancer which provides evidence for the Australian National Chronic Condition Management Council and other stakeholders to use in risk evaluation and prevention promotion. In addition, this research supports the move towards value‐based healthcare with the use of payment models that cover full treatment cycles rather than individual services.
Through the optimal care pathways, Queensland cancer treatment and survivorship protocols align with Australian standards [55] which point to the wider implication of our findings beyond Queensland. Although differences in international health systems may limit the extent to which these findings are transferable, they are likely to be reasonably representative of cohorts of young cancer populations in similar high‐income settings.
Future studies need to include data from private hospitals and community‐based providers and indirect costs such as lost productivity to fully understand the economic and societal effects of chronic conditions in survivors of childhood and AYA cancer.
Conclusion
5
Our study demonstrates that a sizeable proportion of childhood and AYA cancer survivors are hospitalised due to chronic health conditions including psychological conditions, incurring significantly higher healthcare costs than those without chronic diseases. Implementing holistic survivorship care and preventative measures targeting chronic health conditions in childhood and AYA cancer survivors could optimize healthcare resource use and improve healthcare cost outcomes.
Author Contributions
Doreen Nabukalu: conceptualization, data curation, formal analysis, methodology, writing – original draft, writing – review and editing, project administration. Louisa G. Collins: conceptualization, formal analysis, methodology, supervision, validation, writing – review and editing. Daniel Lindsay: methodology, writing – review and editing. John Lowe: supervision, writing – review and editing. Katharina M. D. Merollini: conceptualization, formal analysis, methodology, supervision, validation, writing – review and editing.
Funding
The authors have nothing to report.
Conflicts of Interest
The authors declare no conflicts of interest.
Supporting information
Supporting Information S1
The reference list from the paper itself. Each links out to its DOI / PubMed record.
- 1Australian Institute of Health Welfare . Australia's Health 2022: In Brief (AIHW, 2022).
- 2Australian Institute of Health Welfare . Disease Expenditure in Australia 2019–20 (AIHW, 2022).
- 3Australian Institute of Health Welfare . The Ongoing Challenge of Chronic Conditions in Australia (AIHW, 2024).
- 4Australian Health Minister s' Advisory Council . National Strategic Framework for Chronic Conditions (Australian Government, 2017).
- 5Australian Bureau of Statistics . Health Conditions Prevalence. 2020‐21 9 October 2023, https://www.abs.gov.au/statistics/health/health‐conditions‐and‐risks/health‐conditions‐prevalence/latest‐release.
- 6Australian Institute of Health Welfare . Health of Children (AIHW, 2024).
- 7B. Osman , M. Sunderland , E. K. Devine , L. Thornton , F. Jacka , and M. Teesson , “Prevalence of Noncommunicable Diseases and Developmental Conditions in 5014 Australian Adolescents, and Their Correlations With Diet, Other Lifestyle Behaviours and Mental Health,” Australian & New Zealand Journal of Public Health 49, no. 2 (2025): 100225, 10.1016/j.anzjph.2025.100225.40175246 · doi ↗ · pubmed ↗
- 8Australian Institute of Health Welfare . Chronic Conditions and Multimorbidity (AIHW, 2023).