Triglyceride-glucose body mass index and risk of incident venous thromboembolism: a prospective cohort study from the UK Biobank
Shen-Shen Huang, Shuang-Ping Li, Chai-Yi Xie, Jia-Yong Qiu, Pei-Wen Wang, Jing Zhang, Chun-Yan Cheng, Chao-Wei Ding, Yue-Jiao Ma, Dong Ding, Wan-Qing Dong, Guo-Jie Ye, Jie-Xin Zhang, Yong-Mei Zhang, Yi-Min Mao

TL;DR
Higher levels of a metabolic marker called TyG-BMI are linked to a greater risk of developing blood clots in veins, especially in younger people and women.
Contribution
This study is the first to show that TyG-BMI is a strong predictor of venous thromboembolism risk, independent of other factors.
Findings
The highest TyG-BMI quartile had a 2.10 times higher risk of VTE compared to the lowest quartile.
Risk of VTE increased sharply beyond a TyG-BMI threshold of 231.9.
The population attributable fraction for VTE due to elevated TyG-BMI was 0.333.
Abstract
Triglyceride-glucose body mass index (TyG-BMI) is an emerging surrogate indicator of insulin resistance adiposity, which has been demonstrated as a risk factor for various cardiovascular diseases including hypertension, and myocardial infarction. However, association of TyG-BMI with incident VTE remains to be investigated. This study included 328,208 participants from the prospective UK Biobank cohort without baseline VTE. The primary outcome was incident VTE, and the second outcomes were incident pulmonary embolism (PE) and deep vein thrombosis (DVT). Multivariable-adjusted Cox proportional hazards regression and restricted cubic spline (RCS) analyses assessed the association between baseline TyG-BMI and incident VTE. Stratified analyses evaluated potential effect modification by age, sex, smoking, alcohol use, diabetes, hypertension, cancer, BMI, physical activity, and dietary…
Genes, proteins, chemicals, diseases, species, mutations and cell lines named across the full text — each resolved to its canonical identifier and authoritative record.
Click any figure to enlarge with its caption.
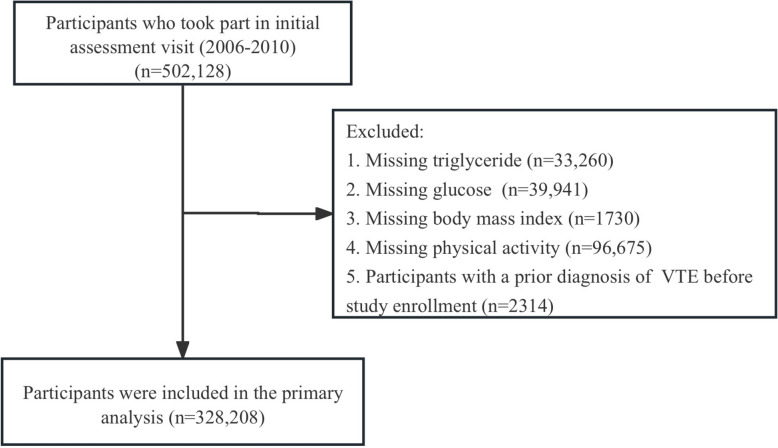 Figure 1
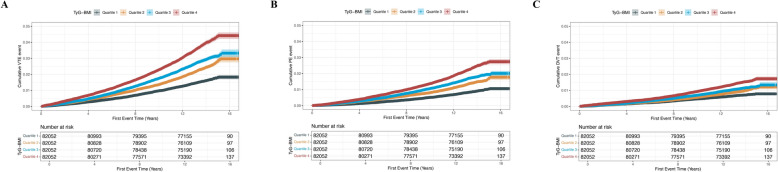 Figure 2
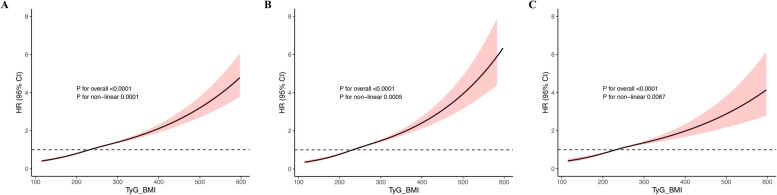 Figure 3
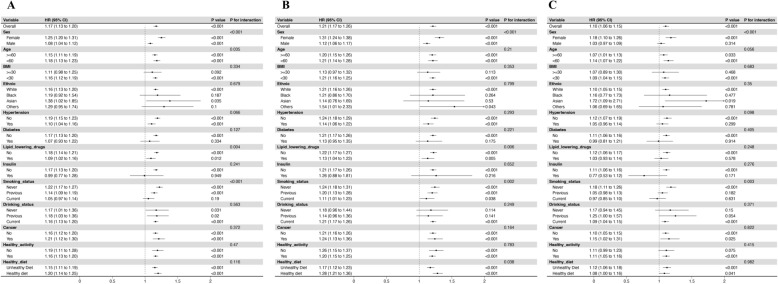 Figure 4
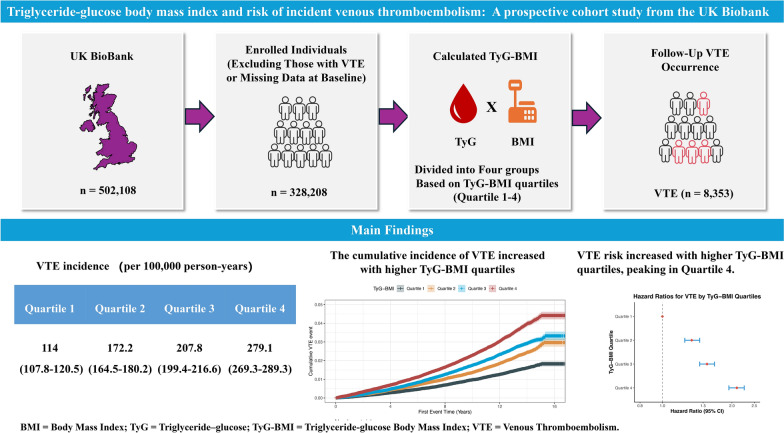 Figure 5
- —Nature Science Foundation of Henan Province
Peer Reviews
No public reviews on file for this paper yet. If you reviewed it on a platform where reviews are public (OpenReview, ICLR, NeurIPS, ICML), you can paste yours below so the community can read it here.
Videos
No videos yet. Explain this paper in a talk, walkthrough, or lecture? Add one.
Taxonomy
TopicsDiabetes, Cardiovascular Risks, and Lipoproteins · Cardiovascular Function and Risk Factors · Cardiovascular Disease and Adiposity
Introduction
Venous thromboembolism (VTE), including deep vein thrombosis (DVT) and pulmonary embolism (PE), is a major global cause of morbidity and mortality, particularly among hospitalized and elderly populations. In Western countries, its annual incidence is estimated at 1–2 cases per 1000 person-years [1, 2].In 2021, the United States reported approximately 1.22 million VTE events among hospitalized patients [3], while a nationwide study in China recorded 200,112 PE cases, with an incidence of 14.19 per 100,000 population (95% CI 14.13–14.26) [4]. VTE is now the third leading cause of vascular death, following myocardial infarction and ischemic stroke, underscoring its critical impact on cardiovascular health [1, 5, 6].
VTE is driven by both acute triggers—such as prolonged immobilization, major trauma, surgery, and active malignancy—and chronic risk factors like advanced age and inherited thrombophilias [7]. Obesity is a well-established contributor, doubling the risk compared to normal-weight individuals [8]. Prospective studies further demonstrate that elevated body mass index (BMI) and central (abdominal) adiposity exhibit stronger associations with VTE incidence than with coronary heart disease, underscoring the unique prothrombotic effect of visceral fat distribution [9]. These observations have spurred growing interest in metabolic contributions to VTE. Metabolic syndrome—defined by abdominal obesity, hypertension, hyperglycemia, hypertriglyceridemia, and low HDL cholesterol—creates a systemic proinflammatory and prothrombotic milieu [10]. In a landmark case–control study, 35% of patients with unprovoked recurrent VTE met criteria for metabolic syndrome, versus 20% of controls, suggesting a twofold increased risk [10]. Similarly, the Tromso Study reported a 65% higher VTE risk in those with metabolic syndrome, though only obesity remained an independent predictor after multivariable adjustment [11].
While metabolic syndrome and central obesity are linked to VTE, BMI alone may not fully capture metabolic risk. Around 17% of obese individuals are insulin sensitive—a phenotype known as metabolically healthy obesity—highlighting the limits of using weight-based measures alone [12]. Importantly, insulin resistance can promote thrombosis even without obesity, underscoring the need for better markers that reflect both metabolic and thrombotic risk [13].
The triglyceride-glucose (TyG) index, derived from fasting triglyceride and glucose levels, is a simple surrogate for insulin resistance [14]. When combined with BMI, the resulting TyG-BMI index more accurately reflects underlying metabolic dysfunction [15]. Previous studies have validated TyG-BMI as a reliable marker for insulin resistance in non-diabetic cohorts [16], showing strong associations with type 2 diabetes, hypertension, and cardiovascular disease [17–19]. By integrating markers of dysglycemia, dyslipidemia, and obesity, TyG-BMI serves as a comprehensive indicator of metabolic risk in population-based research.
Given its ability to capture both insulin resistance and adiposity, TyG-BMI may reflect a prothrombotic metabolic state. While its associations with cardiometabolic diseases are well established, [18, 19] whether TyG-BMI is linked to VTE remains unclear. Therefore, this study aims to evaluate the prospective relationship between baseline TyG-BMI and incident VTE, including DVT and PE, using data from the UK Biobank, which could enhance risk stratification algorithms and inform targeted prevention and management strategies for VTE in high-risk populations.
Methods
Study design and participants
The UK Biobank is a large, population-based, prospective cohort that recruited 502,218 volunteers aged 37–73 years throughout the United Kingdom between 2006 and 2010 by means of touchscreen questionnaires and nurse-led interviews. These baseline assessments captured extensive demographic, socioeconomic, lifestyle, and health-related information. Follow-up for health outcomes is ongoing; the data freeze used for the present analysis included events recorded up to 31 March 2023. UK Biobank received ethical approval from the North West Multi-centre Research Ethics Committee (reference 11/NW/03820), and all participants provided written informed consent. Access to the resource is available to bona fide researchers via the online Access Management System (AMS). The present study was performed under application number 663576.
Case definition of venous thromboembolism
First-ever hospital admissions coded for VTE were identified through linkage to national inpatient records. VTE diagnoses were defined with the 10th revision of the International Classification of Diseases (ICD-10) using the following codes: I82.4, I82.5, I80.1, I80.2, I80.3, I80.9, I82.8, and I82.9 for DVT, and I26.0 and I26.9 for PE [20]. Participants with any record of VTE before baseline assessment were excluded. Additional exclusions were individuals missing baseline measurements of triglycerides (TG), fasting blood glucose (FBG), BMI, or physical activity. After applying the exclusion criteria, 328,208 eligible participants remained in the analytic cohort. The TyG-BMI index was calculated for each individual at baseline and the cohort was categorized into quartiles of this index for subsequent analyses (Fig. 1).Fig. 1. Flowchart of participant selection. VTE, Venous thromboembolism
Measures
From the core UK Biobank database, we extracted sociodemographic data (age, sex, ethnicity, and Townsend Deprivation Index [TDI]), lifestyle factors (smoking status, alcohol consumption, diet, physical activity, and BMI), physician-diagnosed comorbidities (diabetes and hypertension), and information on medication use (lipid-lowering agents and insulin). The TDI is a composite area-based measure of material deprivation derived from UK census output areas prior to participant recruitment, combining four census variables: unemployment, household overcrowding, non-car ownership, and non-owner-occupied households, linked to each participant by postcode (UK Biobank Data-Field 189). Ethnicity was defined using self-reported “Ethnic background” at baseline (UK Biobank Data-Field 21,000), with major categories such as White, Black or Black British, Asian or Asian British, and Other or Mixed as per UK Biobank coding. Anthropometry (height and weight), resting systolic blood pressure (SBP) and diastolic blood pressure (DBP), and laboratory assays, such as Hemoglobin A1c (HbA1c), fasting blood glucose (FBG), triglycerides (TG), total cholesterol (TC), high-density lipoprotein cholesterol (HDL-C), and low-density lipoprotein cholesterol (LDL-C), were obtained at baseline assessment. Smoking status was classified as never, previous or current in accordance with UK Biobank field 20116, whereas alcohol intake status was also coded as never, previous or current. “Healthy activity” was defined as meeting the World Health Organization’s aerobic guidelines—namely, at least 2.5 h per week of moderate-intensity activity, at least 1.25 h per week of vigorous-intensity activity, or an equivalent combination of the two [21]. “Healthy diet” was defined by adherence to at least five of nine cardiovascular-health dietary targets: increased consumption of fruits, vegetables, whole grains, fish or shellfish, dairy products, and vegetable oils, and reduced (or no) consumption of refined grains, processed or unprocessed meats, and sugar-sweetened beverages [22].
Outcome definition
The primary endpoint was incident VTE; secondary endpoints were PE and DVT, analyzed separately. The date of first hospital admission bearing a qualifying ICD-10 code was taken as the event date (I26.0, I26.9 for PE; I80.1, I80.2, I80.3, I80.9, I82.4, I82.5, I82.8, I82.9 for DVT) [20]. Person-time accrued from baseline until the earliest of VTE diagnosis, death, loss to follow-up, or 31 May 2024.
Exposure calculation: TyG-BMI index
The triglyceride-glucose (TyG) index was computed as ln [FBG (mg・dl⁻^1^) × TG (mg・dl⁻^1^)/2] [14]. Body mass index (BMI) was calculated as weight (kg) divided by height squared (m^2^). The composite TyG-BMI index was defined as TyG × BMI, following prior literature [18].
Statistical analyses
Missing values were < 10% for all covariates. Categorical variables with missingness were imputed using mode substitution, whereas continuous variables (HbA1c, BMI, SBP, DBP, TC, HDL-C, LDL-C) were replaced with mean values. Participants were stratified into quartiles of baseline TyG-BMI. Normality of continuous variables was assessed with the Anderson–Darling test. Age, SBP, DBP, FBG, and TG are reported as mean (interquartile range) and compared across quartiles using the Kruskal–Wallis test. Approximately normally distributed variables (such as HbA1c, BMI, TC, HDL-C, LDL-C, RC, and TyG-BMI) are summarized as mean ± standard deviation and compared with one-way ANOVA. Categorical variables are presented as number (percentage) and evaluated with Pearson’s χ^2^ test.
Incidence rates of VTE, PE, and DVT were estimated using Poisson regression and are reported per 100 000 person-years with 95% confidence intervals (CIs). Cumulative incidence functions were visualized with Kaplan–Meier curves and compared by log-rank testing [20]. Hazard ratios (HRs) and 95% CIs across TyG-BMI quartiles were estimated using Cox proportional-hazards regression. Model 1 adjusted for age and sex; model 2 further adjusted for smoking and alcohol status; model 3 additionally controlled for ethnicity, Townsend deprivation index, diabetes, apolipoprotein A (ApoA), systolic blood pressure (SBP), HbA1c, healthy diet, hypertension, LDL-C, C-reactive protein (CRP), use of lipid-lowering drugs, insulin use, healthy physical activity, and RC. In addition, TyG-BMI was z-standardized and modeled as a continuous predictor; per-1 SD hazard ratios were estimated from a Cox model adjusted for the same covariates as Model 3. Potential non-linearity was explored with restricted cubic splines fitted in model 3 [23].
To mitigate reverse causation and protopathic bias inherent to single-baseline cohort designs, we conducted three prespecified landmark sensitivity analyses that excluded incident VTE occurring within the first 1, 3, and 5 years of follow-up. Excluding early follow-up is a standard approach in cardiovascular epidemiology to reduce bias from occult disease processes and short-term precipitants clustered near baseline [24]. We modeled the relationship between continuous TyG-BMI and incident VTE using restricted cubic splines (RCS) in Cox proportional hazards models. We used 3 knots, placed at the 10th, 50th, and 90th percentiles of the TyG-BMI distribution, following Harrell’s recommended default placements. We tested for non-linearity via likelihood ratio test comparing spline vs. linear term. CIs around the spline curve were plotted. We calculated sensitivity, specificity, positive predictive value (PPV), and negative predictive value (NPV) of administrative-code–based VTE ascertainment stratified by TyG-BMI quartiles, using Quartile 1 as reference. These metrics were computed based on 2 × 2 classification (event vs. non-event) across follow-up, with true status defined by administrative records and “test positive” defined by being in a higher TyG-BMI quartile. Effect modification was prespecified and assessed both by testing multiplicative interaction terms and by conducting stratified analyses across the following subgroups: age (< 60 vs. ≥ 60 years), sex (male vs. female), ethnicity (White/Black/Asian vs. other), smoking status (never/former vs. current), alcohol consumption (non-drinkers vs. drinkers), diabetes (absent vs. present), hypertension (absent vs. present), cancer (absent vs. present), BMI (< 30 vs. ≥ 30 kg/m^2^), heathy activity (no vs. yes), and diet quality (healthy diet vs. unhealthy diet).
We estimated population attributable fractions (PAFs) for TyG-BMI overall and in key subgroups using adjusted hazard ratios (HRs) from Cox models and subgroup-specific exposure prevalence across TyG-BMI quartiles (Quartile 1–Quartile 4), with Quartile 1 as the counterfactual reference. For multi-category exposure, PAF was computed as \documentclass[12pt]{minimal} \usepackage{amsmath} \usepackage{wasysym} \usepackage{amsfonts} \usepackage{amssymb} \usepackage{amsbsy} \usepackage{mathrsfs} \usepackage{upgreek} \setlength{\oddsidemargin}{-69pt} \begin{document}$${\mathrm{PAF}}=\frac{{\sum }_{i=2}^{4}{p}_{i}\hspace{0.17em}\left(H{R}_{i}-1\right)}{1+{\sum }_{i=2}^{4}{p}_{i}\hspace{0.17em}\left(H{R}_{i}-1\right)}$$\end{document} , 95% CIs were obtained via non-parametric bootstrap (1,000 resamples), re-fitting the Cox model and re-estimating the within-sample p_i_ at each iteration [25]. Subgroup PAFs were estimated within each stratum (e.g., sex, age, ethnicity, lipid-lowering therapy use), using the same covariate set excluding the stratifying variable to avoid overadjustment. These PAFs should be interpreted as population burden measures that depend on both association strength (HR) and exposure prevalence, rather than as effects of subgroup membership or treatment efficacy. All analyses were performed using R, version 4.4.3. Two-sided p-values < 0.05 were considered statistically significant.
Results
Baseline characteristic
Table 1 summarizes baseline characteristics of the 323,208 eligible participants (mean age 57 years). Those in the highest TyG-BMI quartile were significantly older and more likely to be male (P < 0.001). Higher TyG-BMI was associated with adverse cardiometabolic profiles, including higher levels of HbA1c, BMI, SBP, DBP, FBG, TG, TC, and LDL-C, and lower levels of HDL-C (all P < 0.001). They were also more likely to be former or current smokers, never or former drinkers, to have physician-diagnosed diabetes or hypertension, and to be receiving lipid-lowering agents or insulin (all P < 0.001).Table 1. Baseline characteristics of participantsCharacteristicTotal (n = 328,208)TyG-BMIP-valueQuartile 1 < 203.6 (n = 82,052)Quartile 2 203.6–231.9 (n = 82,052)Quartile 3 231.9–265.2 (n = 82,052)Quartile 4 ≥ 265.2 (n = 82,052)Age, years57.0 (50.0, 63.0)55.0 (47.0, 62.0)58.0 (50.0, 63.0)59.0 (51.0, 64.0)58.0 (51.0, 63.0) < 0.001Male, n (%)158,957(48.4)25,589 (31.2)39,974 (48.7)47,657 (58.1)45,737 (55.7) < 0.001Ethnicity, n (%) White312,599 (95.2)78,329 (95.5)78,219 (95.3)77,961 (95)78,107 (95.2) < 0.001 Black4591 (1.4)878 (1.1)1044 (1.3)1281 (1.6)1393 (1.7) Asian6496 (2.0)1644 (2.0)1708 (2.1)1752 (2.1)1379 (1.7) Other4522 (1.4)1201 (1.5)1081 (1.3)1058 (1.3)1173 (1.4) TDI− 2.3 (− 3.7, 0.3)− 2.3 (− 3.8, 0.1)− 2.4 (− 3.8, − 0.1)− 2.3 (− 3.7, 0.2)− 1.9 (− 3.5, 0.9) < 0.001 BMI, kg/m^2^26.6 (24.1, 29.7)22.5 (21.3, 23.6)25.4 (24.5, 26.4)27.9 (26.9, 29.1)32.3 (30.5, 35.0) < 0.001 SBP, mmHg138 (125, 151)130 (118, 144)137 (125, 150)140 (129, 154)143 (131, 156) < 0.001 DBP, mmHg82 (75, 89)77 (71, 84)81 (74, 88)83 (77, 90)86 (79, 93) < 0.001Smoking status, n (%) Never179,894 (54.8)49,870 (60.8)46,330 (56.5)43,096 (52.5)40,576 (49.5) < 0.001 Previous115,217 (35.1)23,952 (29.2)27,712 (33.8)30,575 (37.3)32,989 (40.2) Current33,097 (10.1)8230 (10.0)8010 (9.8)8381 (10.2)8487 (10.3)Drinking status, n (%) Never12,402 (3.8)2879 (3.5)2825 (3.4)2959 (3.6)3750 (4.6) < 0.001 Previous11,011 (3.4)2556 (3.1)2342 (2.9)2653 (3.2)3465 (4.2) Current304,795 (92.9)76,617 (93.4)76,885 (93.7)76,440 (93.2)74,837 (91.2) Diabetes, n (%)16,170 (4.9)1082 (1.3)1911 (2.3)3381 (4.1)9798 (11.9) < 0.001 Hypertension, n (%)91,440 (27.9)11,105 (13.5)18,489 (22.5)25,329 (30.9)36,512 (44.5) < 0.001 Cancer, n (%)28,744 (8.8)7419 (9.0)7248 (8.8)7133 (8.7)6944 (8.5) < 0.001 Insulin3318 (1.0)431 (0.5)502 (0.6)634 (0.8)1753 (2.1) < 0.001 Lipid-lowering drugs, n (%)55,115 (16.8)6028 (7.3)11,016 (13.4)15,775 (19.2)22,291 (27.2) < 0.001 Healthy diet124,802 (38.0)36,414 (44.4)32,580 (39.7)29,243 (35.6)26,535 (32.3) < 0.001 Healthy activity268,525 (81.8)70,744 (86.2)69,153 (84.3)67,037 (81.7)61,591 (75.1) < 0.001 TG, mmol/L1.5 (1.0, 2.1)1.0 (0.8, 1.2)1.3 (1.0, 1.8)1.7 (1.3, 2.3)2.2 (1.6, 3.1) < 0.001 FBG, mmol/L4.9 (4.6, 5.3)4.8 (4.5, 5.1)4.9 (4.6, 5.2)5.0 (4.6, 5.3)5.1 (4.7, 5.6) < 0.001 HDL-C, mmol/L1.4 (1.2, 1.7)1.7 (1.4, 1.9)1.5 (1.3, 1.7)1.3 (1.1, 1.5)1.2 (1.0, 1.4) < 0.001 LDL-C, mmol/L3.5 (2.9, 4.1)3.3 (2.8, 3.8)3.6 (3.0, 4.1)3.7 (3.1, 4.3)3.6 (3.0, 4.2) < 0.001 TC, mmol/L5.6 (4.9, 6.4)5.5 (4.8, 6.2)5.7 (5.0, 6.4)5.8 (5.0, 6.5)5.7 (4.8, 6.5) < 0.001 ApoB, g/L1.0 (0.9, 1.2)0.9 (0.8, 1.1)1.0 (0.9, 1.2)1.1 (0.9, 1.2)1.1 (0.9, 1.2) < 0.001 ApoA, g/L1.5 (1.3, 1.7)1.6 (1.5, 1.8)1.5 (1.4, 1.7)1.5 (1.3, 1.6)1.4 (1.3, 1.6) < 0.001 CRP, mg/L1.3 (0.6, 2.6)0.7 (0.4, 1.3)1.1 (0.6, 2.0)1.5 (0.8, 2.7)2.4 (1.3, 4.5) < 0.001 HbA1c, mmol/mol35.1 (32.6, 37.7)34.1 (31.9, 36.3)34.6 (32.3, 37.0)35.2 (32.9, 37.8)36.7 (34.0, 40.1) < 0.001 RC, mmol/L0.6 (0.5, 0.8)0.5 (0.4, 0.6)0.6 (0.5, 0.8)0.7 (0.6, 0.9)0.8 (0.6, 1.0) < 0.001 TyG8.7 (8.3, 9.1)8.2 (8.0, 8.5)8.6 (8.3, 8.8)8.8 (8.6, 9.1)9.1 (8.8, 9.5) < 0.001 TyG-BMI231.9 (203.6, 265.2)186.7 (174.7, 195.8)217.9 (211.0, 224.8)247.0 (239.2, 255.4)293.0 (277.2, 319.3) < 0.001TDI Townsend Deprivation Index, BMI Body Mass Index, SBP Systolic Blood Pressure, DBP Diastolic Blood Pressure, TyG Triglyceride-glucose index, TyG-BMI Triglyceride-glucose index multiplied by BMI, RC Remnant Cholesterol, TG Triglycerides, FBG Fasting Blood Glucose, HDL-C High-Density Lipoprotein Cholesterol, LDL-C Low-Density Lipoprotein Cholesterol, TC Total Cholesterol, ApoB Apolipoprotein B, ApoA Apolipoprotein A, CRP C-reactive protein, HbA1c Hemoglobin A1c, Insulin Use of insulin, Lipid-lowering drugs, Use of lipid-lowering medications
Association between TyG-BMI and incident VTE
During a median follow-up of 13.64 years (interquartile range 12.87–14.31 years), 8353 first VTE events were documented, including 5026 PE and 3327 DVT cases. Cumulative incidence of VTE increased progressively with higher TyG-BMI quartiles (Fig. 2). Restricted cubic spline analysis revealed a significant non-linear association between TyG-BMI and thrombotic risk, with risk rising gradually beyond a TyG-BMI value of 231.9 (P for non-linearity < 0.001) (Fig. 3), suggesting a potential inflection point beyond which prothrombotic risk accelerates. VTE incidence rose progressively across TyG-BMI quartiles, from 114.0 (107.8–120.5) to 279.1 (269.3–289.3) per 100,000 person-years. Similar trends were observed for PE (63.5 to 171.9) and DVT (50.7 to 108.8). In unadjusted analyses, the highest quartile had over twice the risk of VTE (HR 2.47), PE (HR 2.73), and DVT (HR 2.15) versus the lowest. After full adjustment for age, sex, smoking, drinking status, ethnicity, Townsend deprivation index, diabetes, ApoA, SBP, HbA1c, healthy diet, hypertension, LDL-C, CRP, lipid-lowering drugs, insulin, healthy physical activity, and RC (Model 3), risks remained significantly elevated: VTE (HR 2.10), PE (HR 2.28), and DVT (HR 1.88).Fig. 2. Kaplan–Meier curves of cumulative incidence. A VTE, B PE, C DVT. TyG-BMI index quartile 1 was used as the reference group. TyG-BMI triglyceride-glucose body mass index, DVT deep vein thrombosis, PE pulmonary embolism, VTE venous thromboembolismFig. 3Non-linear relationship between TyG-BMI index and incident risk of outcomes. A TyG-BMI index in VTE, B TyG-BMI index in PE, C TyG-BMI index in DVT. The relationship was evaluated by RCS after adjustment for age, sex, smoking status, drinking status, ethnicity, Townsend deprivation index, diabetes, ApoA, SBP, HbA1c, healthy diet, hypertension, LDL-C, CRP, lipid-lowering drugs, insulin use, healthy physical activity, and RC (model 3). Solid lines in the figure represent the HRs, and the shaded regions represent the 95% CIs. TyG-BMI triglyceride-glucose body mass index, DVT deep vein thrombosis, PE pulmonary embolism, VTE venous thromboembolism
A clear dose–response was observed (P for trend < 0.001). When analyzed continuously, each standard-deviation (SD) increase in TyG-BMI conferred HRs of 1.31 (1.28–1.34) for VTE, 1.34 (1.30–1.39) for PE, and 1.27 (1.22–1.32) for DVT. In the sensitivity analyses, we performed three separate analyses by excluding all incident VTEs occurring within the first 1 year, first 3 years, and first 5 years of follow-up, respectively; the associations remained consistent (Fig. S1-3). The sensitivity analyses excluding early events (within 1, 3, or 5 years) confirmed the robustness of significant trend by TyG-BMI quartile (P < 0.001) (Table 2).Table 2. Baseline TyG-BMI index and incident risks of VTETyG-BMIP for trendPer SDP-valueQuartile 1Quartile 2Quartile 3Quartile 4Outcome: VTE Number of events1247187122482987 Persons82,05282,05282,05282,052 Person-years1,094,3231,086,6851,081,7441,070,103 Incidence114.0 (107.8–120.5)172.2 (164.5–180.2)207.8 (199.4–216.6)279.1 (269.3–289.3) Unadjusted modelReference1.51 (1.41–1.63)1.83 (1.71–1.96)2.47 (2.31–2.63) < 0.0011.34 (1.31–1.36) < 0.001 Model 1Reference1.31 (1.22–1.40)1.51 (1.41–1.62)2.11 (1.97–2.25) < 0.0011.32 (1.29–1.34) < 0.001 Model 2Reference1.30 (1.21–1.40)1.50 (1.40–1.61)2.07 (1.93–2.21) < 0.0011.31 (1.28–1.33) < 0.001 Model 3Reference1.34 (1.25–1.45)1.56 (1.45–1.68)2.10 (1.94–2.26) < 0.0011.31 (1.28–1.34) < 0.001 Sensitivity analysis 1Reference1.33 (1.23–1.43)1.55 (1.44–1.67)2.07 (1.91–2.24) < 0.0011.31 (1.27–1.34) < 0.001 Sensitivity analysis 2Reference1.34 (1.24–1.45)1.57 (1.45–1.70)2.08 (1.92–2.27) < 0.0011.30 (1.27–1.34) < 0.001 Sensitivity analysis 3Reference1.35 (1.24–1.47)1.59 (1.46–1.73)2.10 (1.92–2.30) < 0.0011.30 (1.27–1.34) < 0.001Outcome: PE Number of events695111913731839 Persons82,05282,05282,05282,052 Person-years1,094,3231,086,6851,081,7441,070,103 Incidence63.5 (59.0–68.4)103.0 (97.1–109.2)126.9 (120.4–133.8)171.9 (164.2–179.9) Unadjusted modelReference1.63 (1.48–1.79)2.01 (1.83–2.20)2.73 (2.50–2.97) < 0.0011.37 (1.33–1.40) < 0.001 Model 1Reference1.40 (1.27–1.54)1.66 (1.51–1.82)2.33 (2.14–2.55) < 0.0011.35 (1.32–1.38) < 0.001 Model 2Reference1.40 (1.27–1.54)1.65 (1.50–1.81)2.30 (2.10–2.51) < 0.0011.34 (1.31–1.38) < 0.001 Model 3Reference1.42 (1.29–1.57)1.68 (1.53–1.86)2.28 (2.06–2.52) < 0.0011.34 (1.30–1.39) < 0.001 Sensitivity analysis 1Reference1.41 (1.28–1.55)1.68 (1.52–1.86)2.27 (2.05–2.52) < 0.0011.34 (1.30–1.38) < 0.001 Sensitivity analysis 2Reference1.38 (1.25–1.53)1.65 (1.49–1.83)2.24 (2.01–2.49) < 0.0011.33 (1.29–1.38) < 0.001 Sensitivity analysis 3Reference1.37 (1.23–1.531.65 (1.48–1.85)2.20 (1.96–2.46) < 0.0011.32 (1.28–1.37) < 0.001Outcome: DVT Number of events55285810751408 Persons82,05282,05282,05282,052 Person-years1,094,3231,086,6851,081,7441,070,103 Incidence50.7 (46.7–55.1)69.8 (65.0–75.0)81.7 (76.5–87.3)108.8 (102.7–115.3) Unadjusted modelReference1.38 (1.23–1.54)1.62 (1.45–1.80)2.15 (1.95–2.38) < 0.0011.30 (1.30–1.34) < 0.001 Model 1Reference1.19 (1.07–1.33)1.33 (1.19–1.48)1.83 (1.65–2.03) < 0.0011.27 (1.23–1.31) < 0.001 Model 2Reference1.19 (1.06–1.33)1.32 (1.18–1.47)1.80 (1.62–1.99) < 0.0011.26 (1.22–1.30) < 0.001 Model 3Reference1.25 (1.11–1.39)1.41 (1.26–1.59)1.88 (1.66–2.12) < 0.0011.27 (1.22–1.32) < 0.001 Sensitivity analysis 1Reference1.23 (1.09–1.38)1.39 (1.24–1.57)1.83 (1.61–2.07) < 0.0011.26 (1.21–1.31) < 0.001 Sensitivity analysis 2Reference1.29 (1.14–1.46)1.46 (1.29–1.66)1.89 (1.66–2.16) < 0.0011.26 (1.21–1.32 < 0.001 Sensitivity analysis 3Reference1.32 (1.16–1.51)1.50 (1.31–1.72)1.99 (1.73–2.30) < 0.0011.28 (1.22–1.34) < 0.001The incidence rates are reported per 100,000 person-years with 95% CIsModel 1: adjusted for age, sexModel 2: adjusted for age, sex, smoking status, drinking statusModel 3: adjusted for age, sex, smoking status, drinking status, ethnicity, Townsend deprivation index, diabetes, ApoA, SBP, HbA1c, healthy diet, hypertension, LDL-C, CRP, lipid-lowering drugs, insulin, healthy physical activity, and RCSensitivity analysis 1: excluded follow-up time less than 1 years, remaining 327,889 participants with 8034 VTE cases, 4833 with PE cases, and 3157 with DVT casesSensitivity analysis 2: excluded follow-up time less than 3 years, remaining 327,135 participants with 7208 VTE cases, 4444 with PE cases, and 2826 with DVT casesSensitivity analysis 3: excluded follow-up time less than 5 years, remaining 326,209 participants with 6354 VTE cases, 3893 with PE cases, and 2461 with DVT casesHRs with the corresponding 95% CIs were reportedPer SD: risk per unit increment in TyG-BMI index
Table S1 displays sensitivity, specificity, PPV, and NPV for VTE, PE, and DVT across TyG-BMI quartiles (Quartile 2, Quartile 3, Quartile 4 compared to Quartile 1). For VTE, sensitivity improved from 0.600 (95% CI 0.583–0.617) in Quartile 2 vs. Quartile 1 up to 0.705 (95% CI 0.691–0.719) in Quartile 4 vs. Quartile 1, while specificity remained around 0.502–0.505. The PPV was low across all comparisons (e.g., 0.023 in Quartile 2, 0.036 in Quartile 4), reflecting the low absolute incidence of VTE, whereas NPV was high (0.985). For PE, sensitivity ranged from 0.617 to 0.726, specificity 0.501–0.504, PPV 0.014 to 0.022, and NPV around 0.992. For DVT, sensitivity ranged from 0.577 to 0.675, specificity 0.501–0.503, PPV 0.009 to 0.014, and NPV nearly 0.993.
Subgroup analyses
Subgroup analyses revealed stronger associations between TyG-BMI and VTE in women (HR 1.25, 95% CI 1.20–1.35) than men (HR 1.08, 95% CI 1.08–1.14; interaction P < 0.001). The association was also slightly stronger in participants under 60 years (HR 1.18, 95% CI 1.13–1.23) compared to those 60 and older (HR 1.15, 95% CI 1.11–1.19; P = 0.035). Lipid-lowering medication modified the association (interaction P = 0.004), with higher risk among non-users (HR 1.18, 95% CI 1.14–1.21) than users (HR 1.09, 95% CI 1.02–1.16). Smoking status demonstrated a graded interaction (P < 0.001); HRs were 1.22 (1.17–1.27) in never-smokers, 1.14 (1.09–1.19) in former smokers, and 1.05 (0.97–1.14) in current smokers. No significant effect modification was detected for BMI, ethnicity, hypertension, diabetes, cancer, insulin therapy, healthy activity, healthy diet, or alcohol consumption (all interaction P > 0.05). (Fig. 4A).Fig. 4. Subgroup analyses of the association between TyG-BMI index and incident outcomes. A TyG-BMI index in VTE, B TyG-BMI index in PE, C TyG-BMI index in DVT. The adjusted model 3 (age, sex, smoking status, drinking status, ethnicity, Townsend deprivation index, diabetes, ApoA, SBP, HbA1c, healthy diet, hypertension, LDL-C, CRP, lipid-lowering drugs, insulin use, healthy physical activity, and RC) was used in this analysis. TyG-BMI triglyceride-glucose body mass index
Stratified analyses for PE and DVT broadly replicated the primary findings (Fig. 4B–C). For PE, higher TyG-BMI remained deleterious across most strata, with a stronger effect seen in those with a healthy diet. No age interaction was observed (Fig. 4B). For DVT, the association was stronger in women and never-smokers, with no significant differences across the remaining subgroups (Fig. 4C).
Population attributable fractions (PAFs) of TyG-BMI for VTE, PE, and DVT
Table S2 displays PAF estimates and 95% confidence intervals for TyG-BMI (above Quartile 1) in the overall cohort and in stratified subgroups. In the full cohort, the PAF for VTE was 0.333 (95% CI 0.295–0.371), for PE 0.376 (95% CI: 0.328–0.419), and for DVT 0.276 (95% CI: 0.212–0.341).
Among men, the PAF was 0.261 (0.198–0.326) for VTE, 0.308 (0.225–0.387)for PE, and 0.204 (0.090–0.302) for DVT; among women, PAFs were 0.365 (0.316–0.409), 0.409 (0.352–0.468), and 0.300 (0.219–0.379), respectively.
By age group, participants ≥ 60 years had PAFs of 0.333 (0.281–0.384) for VTE, 0.402 (0.337–0.462) for PE, and 0.226 (0.136–0.322) for DVT; those < 60 years had PAFs of 0.338 (0.279–0.395), 0.341 (0.263–0.412), and 0.339 (0.253–0.423). In ethnic subgroups, PAFs varied widely (e.g., for Black participants PAF 0.579 [0.327–0.819] for VTE; for White participants 0.327 [0.289–0.364]). Additional stratified PAFs by hypertension, diabetes, LLT use, smoking, and cancer status are also shown in Table S2. These subgroup patterns suggest that the proportional burden of VTE attributable to TyG-BMI differs across demographic and clinical strata.
Discussion
In this large prospective UK Biobank cohort, a higher baseline TyG-BMI index was independently linked to a 2.10-fold greater risk of venous thromboembolism, encompassing 2.38-fold and 1.88-fold increases in PE and DVT, respectively, over a median 13.6-year follow-up. To our knowledge, this is the first study to evaluate TyG-BMI in relation to VTE risk in a general population, extending prior evidence linking metabolic syndrome to VTE [11, 13]. Our analysis suggests that TyG-BMI, a composite of BMI and the TyG index, reflects the impact of adiposity-related insulin resistance on VTE risk. Supporting this interpretation, elevated HOMA-IR, a direct measure of insulin resistance, has been independently linked to a higher incidence of VTE [13]. The TyG index alone has also been associated with thrombotic events, showing a 60% higher risk in atrial fibrillation patients and predicting in-hospital acute lower-limb DVT in intracerebral hemorrhage patients [26, 27]. The consistent observations across diverse populations strengthens the credibility of our findings and underscores the role of metabolic dysregulation, characterized by IR and obesity, in promoting thrombotic risk in both venous and arterial circulations. Prospective cohorts and meta-analyses show that individuals with obesity experience a 1.5- to twofold higher VTE risk than those of normal weight, while smaller clinical series have linked surrogate measures of IR, such as HOMA-IR, EDITH, to thrombotic events [13, 28, 29]. The TyG index—an accessible marker of IR—has been associated with cardiovascular morbidity [30, 31]. By integrating the TyG index with BMI, the TyG-BMI metric captures the combined metabolic and adiposity burden more comprehensively than either component alone [15]; nevertheless, its relation to VTE had not been examined previously. Our findings therefore extend current knowledge, demonstrating that the metabolic-obesity synergy embodied by a high TyG-BMI can predict thrombotic events many years before they become clinically manifest.
Multiple, interconnected metabolic-inflammatory pathways plausibly link an elevated TyG-BMI index with heightened VTE risk. Concomitant hyper-triglyceridemia, hyper-glycemia, and visceral adiposity drive chronic low-grade inflammation—reflected by increased interleukin-6 and tumor-necrosis-factor-α—which stimulates hepatic synthesis of fibrinogen and other coagulation factors and thereby lowers the threshold for clot formation [32–34]. In IR states, compensatory hyperinsulinemia up-regulates plasminogen-activator inhibitor-1, impairs fibrinolysis, and consolidates a hypercoagulable milieu [35, 36]. Endothelial dysfunction further skews hemostasis toward thrombosis: oxidative stress and attenuated PI3K/Akt-mediated nitric oxide signaling enhance platelet reactivity and raise circulating factor VIII activity [10, 27, 37]. The pulmonary vascular bed, densely lined with metabolically active endothelium, may be especially susceptible to these insults, offering a mechanistic basis for the stronger association we observed with pulmonary embolism than with deep-vein thrombosis [38]. Collectively, these processes explain how TyG-BMI functions as an integrated biomarker identifying individuals in whom excess adiposity and metabolic dysregulation converge to promote thrombogenesis and consequent VTE.
Restricted cubic-spline regression revealed a significant non-linear relationship between TyG-BMI and the risk of VTE (overall P < 0.0001; non-linearity* P* < 0.0001). The spline curve for VTE rises continuously until a TyG-BMI of 231.9, beyond which the hazard ratio still increases gradually. Notably, the increase is not abrupt. The steepness of the curve intensifies in the upper range, giving it a concave-upward shape, while the confidence bands widen substantially at extreme TyG-BMI values due to fewer observations.
A similar non-linear curvature is detected for PE (non-linearity P = 0.0005), and it is somewhat steeper than that for VTE. DVT exhibits a more modest non-linear pattern (non-linearity P = 0.0059). Biologically, this trend aligns with a “buffering” hypothesis: mild to moderate metabolic dysregulation may be offset by homeostatic mechanisms (e.g., insulin sensitivity reserve, vascular repair). But beyond some cumulative stress threshold, the effects of insulin resistance, endothelial dysfunction, low-grade inflammation, and impaired fibrinolysis may begin to accelerate more rapidly [39]. However, given the wide confidence intervals at the high tail and relatively few data points in that range, we refrain from interpreting 231.9 as a rigid threshold. Instead, we treat it as the point at which risk escalation becomes more apparent within our sample. Future work should externally validate whether a similar inflection point exists in other populations. It should also explore whether interventions that lower TyG-BMI could shift individuals back toward a safer, compensated range before overt thrombosis develops.
Notably, our results reveal several nuanced differences compared with existing studies, offering new insights. One prior cohort investigation reported that metabolic syndrome was significantly associated with VTE only in men and not in women [40], whereas another study—consistent with our findings—observed a higher proportion of women among obese VTE patients [8]. In our study, we found that elevated TyG-BMI was associated with increased VTE risk in both men and women, and although the formal sex × TyG-BMI interaction test was not significant, there was a tendency toward a somewhat greater relative risk in women compared with men. This discrepancy may stem from variations in study design and statistical power, or it may reflect the greater sensitivity of TyG-BMI as a continuous composite marker compared to the binary classification of metabolic syndrome. Our data reinforce the importance of adiposity, yet by incorporating both triglyceride and glucose concentrations, TyG-BMI additionally captures underlying insulin resistance and hyperglycemia—pathophysiological factors that anthropometric measurements alone cannot directly detect.
Interestingly, we also observed effect modification by smoking status. The association between TyG-BMI and VTE was strongest among never-smokers and attenuated in former and current smokers, which was different from a prior meta‐analysis, suggesting active smoking confer only a modest excess risk for VTE after adjustment for BMI [41]. This somewhat paradoxical trend may stem from residual confounding by sex, as women—who exhibited higher VTE risk overall—were more prevalent in the never-smoker group. These findings align with a recent Mendelian randomization analysis that identified no causal link between either current or past smoking and VTE, DVT, or PE [42]. Future research should elucidate the dose–response relationship between smoking duration and intensity and the risk of VTE.
In addition, we observed that the association between TyG-BMI and VTE appeared somewhat attenuated among participants using lipid-lowering therapy (LLT) compared to non-users. While we do not report data on the independent effects of LLT, this pattern suggests that LLT might modify—or buffer—the prothrombotic impact of adverse metabolic profiles. Supporting this notion, a recent network meta-analysis of over 45 randomized trials evaluating statins, ezetimibe, and PCSK9 inhibitors found a gradual, dose-related reduction in VTE with more intensive or combined lipid-lowering regimens [43]. While our subgroup findings are exploratory, they hint that in individuals with elevated TyG-BMI, LLT may partially mitigate excess thrombotic risk. Future studies are warranted to test whether lowering TyG-BMI or combining metabolic and lipid‐targeted therapies can reduce VTE incidence in high-risk populations.
Biologically, this observation is plausible: statins and other LLTs have known pleiotropic properties beyond lipid lowering, such as reducing systemic inflammation, downregulating PAI-1, improving endothelial function, and modulating coagulation and fibrinolysis pathways. For example, prior studies have shown that statins can reduce IL-6, CRP, and PAI-1 levels and enhance nitric oxide bioavailability, which may counteract metabolic dysfunction–driven thrombogenesis [44]. However, given that we did not present the main effects of LLT in our models, these subgroup results should be interpreted with caution. They are hypothesis-generating, indicating that in populations with high TyG-BMI, the risk conferred by metabolic dysfunction may be modifiable through therapies targeting lipid and inflammatory pathways. Future prospective or interventional studies should examine whether LLT can attenuate the incremental risk of high TyG-BMI for VTE and whether these effects differ by baseline metabolic state.
In prior population studies, the attributable fraction of VTE due to overweight and obesity was estimated at ~ 24.6% in a Norwegian cohort, providing a useful benchmark for our TyG-BMI PAFs (~ 33%) and underscoring the incremental value of integrating metabolism beyond simple adiposity [45]. Mechanistically, recent reviews posit a “metabolism-thrombosis axis,” in which dysregulated glucose and lipid metabolism, insulin resistance, oxidative stress, and endothelial dysfunction interact to promote hypercoagulability and impair fibrinolysis [46]. Thus, our PAF estimates for TyG-BMI capture the metabolic burden on VTE risk, potentially exceeding that from adiposity alone, while aligning with established dose–response data linking BMI and VTE. Similar to subgroup analyses, the attributable burden of TyG-BMI is higher among women (e.g., VTE PAF 0.365) than among men (0.261), and somewhat higher PE PAF is seen in older adults compared to younger (Table S2). Notably, in the LLT stratum, PAFs remain substantial (e.g., VTE PAF ~ 0.346 in LLT users vs. ~ 0.325 in non-users), suggesting that even among treated individuals, elevated TyG-BMI still contributes meaningfully to thrombotic risk.
Strengths and limitations
This study represents the initial exploration of the association between TyG-BMI index and VTE, providing evidence-based support for the potential role of insulin resistance in VTE. A large sample size, a prospective research design, and a long follow-up time are the advantages of our study. Our findings were stable after excluding VTE events within the first 1, 3, and 5 years. If the TyG-BMI–VTE association were driven primarily by reverse causation or early transient triggers (e.g., surgery, hospitalization, new cancer), we would expect substantial attenuation of effect sizes with longer exclusion windows. Instead, hazard ratios changed little, the quartile dose–response persisted, and only a modest attenuation for PE at 5 years was observed—consistent with the removal of peri-operative or cancer-related PEs that peak early after diagnosis or major surgery. These observations, together with prior population-based evidence linking adiposity more strongly to PE than DVT, support a long-term metabolic–thrombotic pathway underlying the TyG-BMI association with VTE.
However, several limitations should be noted. Firstly, the observational design precludes causal inference; future Mendelian randomization studies leveraging TyG-BMI genetic instruments could address this limitation. Secondly, TyG-BMI was measured only at baseline, so regression-dilution may have attenuated the true association. Thirdly, our VTE outcome was identified using administrative ICD-10, which may lead to misclassification (false positives or false negatives). Previous validation studies report only moderate positive predictive value (≈ 72%) when using diagnosis codes alone, and improved but still imperfect accuracy even when combined with treatment or imaging codes [47, 48]. Therefore, incidence and risk estimates in our study might be biased; caution is warranted when interpreting the results, and future work with adjudicated VTE diagnoses is desirable. Finally, the cohort is predominantly White British, and replication in more ethnically diverse populations is required to establish generalizability. Future research should (i) track longitudinal changes in TyG-BMI to determine whether dynamic shifts parallel VTE risk; (ii) elucidate the biological mechanisms by which insulin resistance and obesity promote VTE; and (iii) evaluate whether targeted interventions—lifestyle modification or pharmacotherapy—can attenuate VTE risk in individuals with elevated TyG-BMI.
Conclusion
Elevated TyG-BMI confers a substantially higher risk of first-ever VTE in the general population. These findings highlight the intertwined roles of metabolic dysfunction and obesity in venous thrombogenesis and support incorporating TyG-BMI into prevention strategies for VTE.
Supplementary Information
Supplementary material 1. Fig. S1 Kaplan–Meier curves showing the cumulative incidence of VTE after exclusion of participants who experienced VTE within the first year of follow-up. A VTE, B PE, C DVT. TyG-BMI index quartile 1 was used as the reference group. TyG-BMI triglyceride-glucose body mass index, DVT deep vein thrombosis, PE pulmonary embolism, VTE venous thromboembolism.Supplementary material 2. Fig. S2 Kaplan–Meier curves showing the cumulative incidence of VTE after exclusion of participants who experienced VTE within the first three years of follow-up. A VTE, B PE, C DVT. TyG-BMI index quartile 1 was used as the reference group. TyG-BMI triglyceride-glucose body mass index, DVT deep vein thrombosis, PE pulmonary embolism, VTE venous thromboembolism.Supplementary material 3. Fig. S3 Kaplan–Meier curves showing the cumulative incidence of VTE after exclusion of participants who experienced VTE within the first five years of follow-up. A VTE, B PE, C DVT. TyG-BMI index quartile 1 was used as the reference group. TyG-BMI triglyceride-glucose body mass index, DVT deep vein thrombosis, PE pulmonary embolism, VTE venous thromboembolism.Supplementary material 4.