Visual Acuity Provides a More Meaningful Measure of Vision-Related Functioning Than Mesopic Microperimetry in Age-Related Macular Degeneration Patients: A Cross-Sectional Study
Francesco Cinque, Jeroen A. A. H. Pas, Anita de Breuk, Tom Heesterbeek, Caroline C. W. Klaver, Carel B. Hoyng, Yara T. E. Lechanteur, Caroline M. van Heugten

TL;DR
This study finds that visual acuity is a better measure of vision-related functioning than mesopic microperimetry in patients with age-related macular degeneration.
Contribution
The study demonstrates that visual acuity provides a more meaningful estimation of vision-related functioning than mesopic microperimetry.
Findings
Visual acuity explained 38% of the variance in vision-related functioning.
Mesopic microperimetry metrics contributed significantly but less than visual acuity.
The combined model of visual acuity and MS cd log explained 46% of the variance.
Abstract
Mesopic microperimetry is a promising tool to evaluate retinal function in clinical trials. Although visual function (VF), the ability to perform vision-related tasks, relates strongly to visual acuity (VA) in patients with age-related macular degeneration, the relationship between mesopic microperimetry and VF remains unclear. A cross-sectional study in patients with age-related macular degeneration was performed. VF was measured by questionnaire using a subset of the National Eye Institute 25-Item Visual Function Questionnaire. The macular integrity assessment microperimeter, was used with a 4–2 staircase strategy with a 10° diameter circular grid containing 37 loci. Three interpretations of the retinal sensitivity data were calculated: the mean of the 37 thresholds (mean sensitivity [MS]), the percent-reduced threshold (PRT), and the log-transformed candela mean (MS cd log). MS,…
Genes, proteins, chemicals, diseases, species, mutations and cell lines named across the full text — each resolved to its canonical identifier and authoritative record.
Click any figure to enlarge with its caption.
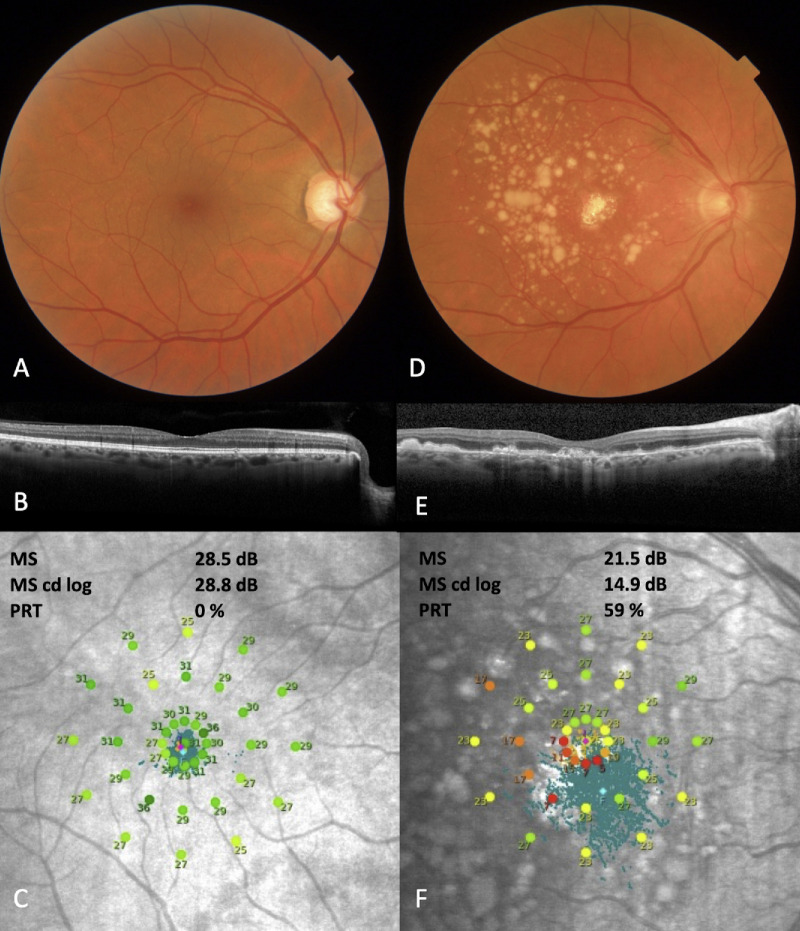 Figure 1
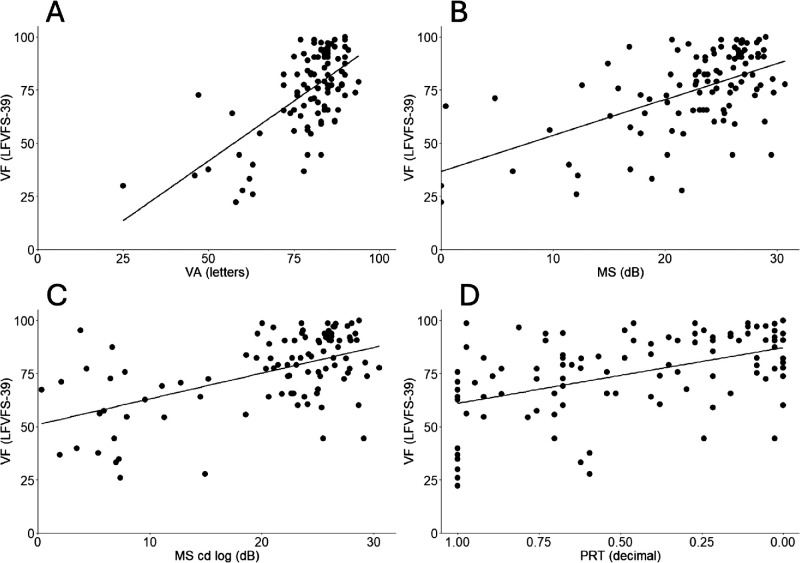 Figure 2
| Characteristics | Best-Seeing Eye ( | Worse-Seeing Eye ( |
|---|---|---|
| Age, years | 71.8 ± 11.2 | 71.5 ± 11.5 |
| Female, | 64 (60.7) | 51 (61) |
| VA, letters | 79.6 ± 10.9 | 63.5 ± 20.7 |
| Stage | ||
| RS stage 0 | 3 (2.9) | 0 (0) |
| RS stage 1 | 0 (0) | 0 (0) |
| RS stage 2 | 29 (28.4) | 10 (12) |
| RS stage 3 | 30 (29.4) | 13 (15) |
| RS stage 4 | 40 (39.2) | 61 (73) |
| Patient stage | ||
| RS stage 0 | 0 (0) | 0 (0) |
| RS stage 1 | 0 (0) | 0 (0) |
| RS stage 2 | 9 (8.8) | 10 (10) |
| RS stage 3 | 9 (8.8) | 9 (11) |
| RS stage 4 | 84 (82.4) | 67 (80) |
| RS stage 4 patient | ||
| Neovascular | 14 (13.7) | 22 (26) |
| Atrophic | 21 (20.6) | 8 (10) |
| Combined | 5 (4.9) | 31 (37) |
|
| ||
|---|---|---|
| Variables | Best-Seeing Eye ( | Worse-Seeing Eye ( |
| VA (letters) | 0.41 | 0.06 |
| MS (dB) | 0.32 | 0.07 |
| MS cd log (dB) | 0.36 | 0.09 |
| PRT (decimal) | 0.23 | 0.07 |
| BCEA-63 (°) ln | 0.10 | 0.04 |
| BCEA-95 (°) ln | 0.09 | 0.04 |
| P1 (%) | 0.16 | 0.05 |
| P2 (%) reflect | 0.07 | 0.02 |
| β ( | |||
|---|---|---|---|
| Independent Variables | MS (dB) | MS cd log (dB) | PRT (Decimal Value) |
| Intercept | −18.1 | −5.7 | 1.0 |
| VA, letters | 1.0 (<0.001) | 0.9 (<0.001) | 1.1 (<0.001) |
| Retinal sensitivity | 0.9 (<0.001) | 0.7 (<0.001) | −10.6 (0.02) |
| Sex | −8.3 (0.001) | −9.1 (0.001) | −9.0 (0.001) |
| Variance | |||
| Partial adjusted | 0.45 | 0.46 | 0.40 |
| Total adjusted | 0.49 | 0.50 | 0.45 |
| Stepwise Δ | |||
| Δ | 0.38 (<0.001) | 0.38 (<0.001) | 0.39 (<0.001) |
| Δ | 0.07 (<0.001) | 0.08 (<0.001) | 0.03 (0.03) |
| Δ | 0.05 (0.001) | 0.06 (0.001) | 0.06 (0.001) |
Peer Reviews
No public reviews on file for this paper yet. If you reviewed it on a platform where reviews are public (OpenReview, ICLR, NeurIPS, ICML), you can paste yours below so the community can read it here.
Videos
No videos yet. Explain this paper in a talk, walkthrough, or lecture? Add one.
Taxonomy
TopicsOphthalmology and Visual Impairment Studies · Visual perception and processing mechanisms · Spatial Neglect and Hemispheric Dysfunction
Introduction
Age-related macular degeneration (AMD) is a progressive retinal disease that is currently the leading cause of irreversible vision loss in the world for elderly people.1 In early AMD, patients may suffer mild visual disturbances but the disease can progress to late-stage AMD, characterized by geographic atrophy (GA) or choroidal neovascularization, significantly reducing quality of life (QOL).2^,^3
Current trials in AMD use best-corrected visual acuity (BCVA) as a functional end point.4 However, BCVA, whether primary or secondary, has limitations in AMD.5 BCVA shows little change over the course of most trial durations because it is inadequately sensitive to changes in early, intermediate AMD, and extrafoveal GA; and may fail to sufficiently discriminate in late AMD with foveal involvement.5^,^6 For instance, BCVA cannot measure relevant extrafoveal improvement in (exudative) AMD.7 In GA, the slow development of foveal involvement might exceed the standard duration of most clinical trials.8^,^9 These shortcomings may negatively impact the measurability of a potential therapeutic
Mesopic microperimetry (MMP) is a promising psychophysical functional test that has already been implemented as a secondary outcome measure in GA clinical trials.10^–^14 MMP entails controlled retinal sensitivity mapping of the macula and simultaneous measurement of fixation stability.6 Patients are presented light stimuli of varying intensity in candela/m^2^, usually expressed in decibel (dB). The threshold, or retinal sensitivity, at which the patient can perceive this stimulus is then determined. BCVA is the ability to distinguish separate points at a distance over a high-contrast background, in a high luminance environment, exclusively reflecting foveal function, while MMP measures retinal function beyond the fovea.15^,^16 MMP might be used in future trials because of its discriminatory ability in earlier stages of AMD.17^,^18
An important argument to justify use of MMP as a primary end point would be to show that MMP is related to vision-dependent tasks or visual function (VF).19 VF is a measure of everyday vision-dependent tasks such as reading and perceiving facial expressions.20 Although VF relates strongly to VA in AMD patients, the relationship between MMP and VF remains unclear.21
This study investigates how much VF is explained by MMP and VA. The output of the MMP can be interpreted using various methods, including the geometric mean, which is the average of all thresholds in dB, a percentage score of loci scoring below threshold, and the novel approach of averaging the candela/m^2^ scores before log transformation. Because MMP output yields different variables, we aimed to explore these three distinct interpretations of retinal sensitivity in addition to fixation metrics in this study.
Methods
Study Design and Participants
This secondary baseline analysis was performed with data collected from January 2018 through April 2019 at the Radboud University Medical Centre in Nijmegen (the Netherlands) as part of the European Genetic Database (EUGENDA). All patients had at least one eye with macular drusen secondary to AMD. The exclusion criterion was incorrect alignment of the microperimetry grid on the fovea to ensure valid measurement. Two cohorts were defined based on VA: the best-seeing eye cohort and the worse-seeing eye cohort. This study was conducted in accordance with the tenets of the Declaration of Helsinki and was approved by the local ethics committee (2027–3535). All participants provided written informed consent before participating.
Study Protocol
Presenting VA was measured using the Early Treatment Diabetic Retinopathy fast method.22^–^24 A printout of the Dutch consensus translation of the National Eye Institute 25-Item Visual Function Questionnaire (NEI-VFQ25)25 was handed out on site and completed using both eyes and reading glasses if necessary. MMP was performed with the macular integrity assessment microperimeter (CentreVue, Padova, Italy) using a 4–2 staircase strategy with a grid of 10° diameter containing 37 radially oriented points centered on the fovea. Trained personnel explained the procedure and performed a mock examination before actual examination at baseline to prevent a learning curve effect. MMP was not performed in mydriasis because the macular integrity assessment microperimeter is able to operate with a pupil diameter of 2.5 mm.6^,^26 The following imaging modalities were performed: color fundus photography (DRI Triton; Topcon, Tokyo, Japan), spectral-domain optical coherence tomography, and fundus autofluorescence (Spectralis HRA+OCT; Heidelberg Engineering, Heidelberg, Germany). All imaging was done in mydriasis. Ophthalmic history and medical history was assessed through questionnaires.
Main Outcome: VF
The Long-Form Visual Functioning Scale (LFVFS-39) measuring VF was used.27 A LFVS-39 score of 100 indicates no difficulty in performing activities owing to vision, and 0 indicates a complete inability to perform activities owing to vision.27 The LFVFS-39 averages the recoded responses to items 2, 5, 6, 7, 8, 9, 10, 12, 14, A3, A4, A5, A6, A7, and, A8 from the NEI-VFQ. Despite the LFVFS-39 still retaining differential item functioning, that is, some items measure differently for sex,27 its primary advantage is its better precision over the LFVFS-25, which is comparatively smaller scale using solely the NEI-VFQ25. Application of this Rasch-based revision has since been manyfold.21^,^28
VF can be derived from the NEI-VFQ, the most used vision-related QOL (VRQoL) questionnaire in ophthalmology.29 Psychometric evaluation of the NEI-VFQ via Rasch analysis has shown that the NEI-VFQ violates unidimensionality; that is, it does not measure a single construct, which is not uncommon in QOL measurements.27 This can be resolved by segregating a subset of the original questions into two distinct measures of VRQoL: VF and socioemotional functioning.27 VRQoL is a multifaceted (ie, multidimensional) construct that includes extra domains such as emotional well-being, social participation, and economic considerations.20 VF and VRQoL are similar in that they can be measured through psychometric instruments.20^,^29^,^30 Although VRQoL is a valuable measure, its multidimensionality renders it more challenging to interpret because it cannot be represented by a single scale.20^,^29
MMP Variables
Retinal sensitivity is measured at each of the 37 loci on a 0 to 36 dB scale such that 0 dB corresponds with the brightest stimulus at 318 cd/m^2^.6 Retinal sensitivity data can be analyzed differently.5^,^6 We explored three different strategies:
- 1)Mean sensitivity (MS); this is the average of all 37 thresholds in dB.
- 2)MS candela log (MS cd log). MS cd log is calculated by first converting each threshold into its corresponding candela/m^2^ value.6 Next, all thresholds in candela/m^2^ are averaged. Subsequently, all values are transformed back to a dB value.
- 3)Percent-reduced threshold (PRT); the number of thresholds below 25 dB divided by 37, expressed as a decimal value5^,^6 (Fig. 1).
Fixation metrics are provided in the form of P1, P2, BCEA-63, and BCEA-95.31 In brief, P1 and P2 describe the percentage of fixation points within 1° and 2° radii circles. BCEA-63 and BCEA-95, or bivariate contour ellipse area, describes the area in degrees (°) which contain 63% or 95% of fixation points.31
Grading
Grading of color fundus photography, spectral-domain optical coherence tomography, and fundus autofluorescence was performed by experienced graders of the Eye-NED Reading Center using the modified version of the Wisconsin Age-Related Maculopathy Grading System.32 This was then reclassified into the Rotterdam Study (RS) classification.33 Patient stage is defined by the highest staged eye.
Statistical Analysis
Exploratory simple linear regression of VF (LFVFS-39) was performed with the following variables measured in the best-seeing eye and worse-seeing eye respectively; MS (dB), MS cd log (dB), PRT (decimal value), P1 (%), P2 (%), BCEA-63 (°), and BCEA-95 (°). The coefficient of determination (R^2^) of VF (LFVFS-39) and VA of the best-seeing eye (letters) and VF (LFVFS-39) and VA of the worse-seeing eye (letters) served as benchmarks. Next, a three stepwise hierarchical multiple linear regression models was constructed with VF (LFVFS-39) as dependent variable. In each model, a different retinal sensitivity measure—MS, MS cd log, or PRT—served as retinal function measure. Candidate independent variables were limited to those variables with a statistically significant F-test score from the previous analysis and the following potential confounding variables based on the literature: AMD stage,6 sex,21^,^27 and age.34 This process was iterated three times, yielding nine different regression models. The first series of three models (MS, MS cd log, and PRT resp.) were constructed using variables measured in the best-seeing eye; the second series were based on the worse-seeing eye (worse-seeing eye cohort); the third series included both eyes. For all nine models, the following assumptions were visually checked: (1) linearity, (2) multivariate normality, (3) absence of homoscedasticity, and (4) absence of multicollinearity (variance inflation factor of <10). The α was 5%. All statistical analyses were performed using IBM SPSS Statistics for Windows, version 24 (IBM Corp., Armonk, NY).
Results
Cohort Description
In the best-seeing eye cohort, four patients had missing data and additionally the grid was misaligned in two additional patients. This resulted in 102 patients (64 females [61%]; mean age, 71.8 ± 11.2 years) (Table 1). The mean VA was 79.6 ± 10.9 letters. In total, 40 eyes were graded as RS stage 4, of which 14 were neovascular, 21 atrophic, and 5 showed a combination. The patient stage was RS stage 4 in 84 patients.
The median of LFVFS-39 scores were 77.6 (interquartile range, 25.4; range, 22–100). Scores were affected by sex; the mean scores for males 79.9 ± 16.7 and females 72.0 ± 20.0 differed (Supplementary Fig. S1)).
A subset of 102 patients contributed data of the worse-seeing eye. Of the 18 missings, 10 patients did not perform MMP. The median VA was 20 letters (interquartile range, 47 letters) for these 10 eyes and all VA were lower than 56 letters, except for one patient. Additionally, in eight patients the grid was misaligned. The VA in the worse-seeing eye for these eight patients did not exceed 52 letters.
The worse-seeing eye cohort featured 84 patients. The mean VA was 63.5 ± 20.7 letters. Sixty-one eyes (73%) were graded as RS stage 4 (Table 1). The median LFVFS-39 scores were 82 (interquartile range, 24; range, 28–100).
Exploratory Analysis
A simple linear regression with each candidate variable was performed. In the best-seeing eye cohort, all F-test scores were statistically significant. VA performed best (R^2^ = 0.41). The retinal sensitivities were ranked MS cd log (dB) (R^2^ = 0.36), MS (dB) (R^2^ = 0.32), and PRT (decimal) (R^2^ = 0.23) best to worse (Table 2; Fig. 2).
Of the fixation metrics, P1 (%) performed best (R^2^ = 0.16) (Table 2; Supplementary Fig. S2). In the worse-seeing eye, the R^2^ of MS cd log (dB) was 0.09. All other variables performed worse (Table 2; Supplementary Fig. S3). F-scores for BCEA-63 (°), BCEA-95 (°), and P2 (%) were not statistically significant (Table 2; Supplementary Fig. S4). Of note, the BCEA-63 (°), BCEA-95 (°), and P2 (%) were transformed before all analyses. Untransformed fixation metrics in the best-seeing eye cohort are visualized in Supplementary Figure S5.
Results
In the best seeing-cohort, VA consistently accounted for the largest portion of variance explained in LFVFS-39 (MS; R^2^ = 0.38, MS cd log; R^2^ = 0.38, PRT; R^2^ = 0.39) (Table 3). All retinal sensitivities significantly contributed to the proportion of total variance explained (MS; ΔR^2^ = 0.07, MS cd log; ΔR^2^ = 0.08, PRT; ΔR^2^ =0.03).
For all three models, all assumptions were met. The variance inflation factor did not exceed 1.5. None of the other candidate variables P1 (%), P2 inv. Ln (%), BCEA-63 Ln (°), age, or RS stage were forward selected in any model. BCEA-63 Ln and BCEA-95 ln were statistically the same (R^2^ = 0.99); therefore, the list of candidate variables was limited to BCEA-63. Sex accounted for approximately 5% of variance in each model. Of note, RS stages 1 and 0 were collapsed to account for power.
The MS cd log model accounted for the greatest proportion of variance explained (total adjusted R^2^ = 0.52). The combined contribution of variance explained by VA and MS cd log was 46% (partial adjusted R^2^ = 0.46). The estimated βs were 0.9 (P < 0.001) per letter and 0.7 (P < 0.001) per decibel in this model (Table 2).
In the worse-seeing eye cohort (Supplementary Table S1), VA was not forward selected in the models. Only sex and retinal sensitivity were included. Total variance explained ranged from 9% to 14% (total adjusted R^2^) (Supplementary Table S2). All retinal sensitivities significantly contributed to the proportion of total variance explained (MS; ΔR^2^ = 0.07, MS cd log; ΔR^2^ = 0.09, PRT; ΔR^2^ = 0.07). All assumptions were met. None of the other candidate variables P1 (%), RS stage 4, RS stage 3, or age were included.
In the final series including both eyes, VA of the best-seeing eye was included in each model (Supplementary Table S2) PRT, regardless of best or worse-seeing eye, was not selected (Supplementary Table S3). The VA of the best-seeing eye accounted for the greatest proportion of the variance explained (MS; ΔR^2^ = 0.30, MS cd log; ΔR^2^ = 0.30, PRT; ΔR^2^ = 0.30). In the PRT model, the initial candidate variable list were subject to multicollinearity regarding BCEA-63 and P2 (variance inflation factor = 11.4). This model was rerun, leaving out BCEA-63. In the final models, all assumptions were met.
Discussion
In this secondary analysis of 102 AMD patients, VA of the best-seeing eye is more strongly related to daily vision-dependent tasks (VF and LFVFS-3) than retinal sensitivity (MS, MS cd log, and PRT) or fixation metrics (BCEA-63, BCEA-95, P1, and P2) as measured via MMP. In the best-seeing eye cohort, combining VA and the best performing MMP retinal sensitivity (MS cd log) increases the proportion of variance explained from 38% (VA alone) to 46% (VA and MS cd log) (P < 0.001), suggesting limited added benefit of retinal sensitivity. The proportion of variance explained is important in the context of end point selection in clinical trials. Although uniocular variables cannot fully capture VF,35 these findings suggest that, in cases where proportional gains or losses in VA (letters) and MMP (dB) occur, VA's higher proportion of variance explained inspires greater confidence in predicting an equivalent change in VF. These findings are in line with previous work, which underscores the relative weakness of MMP compared with VA-based measures.36^,^37
MMP's relative underperformance might be explained in two ways. First, although VA and MMP measure overlapping anatomical regions—VA measures foveal function and MMP measures macular function—both are linearly associated with VF. Therefore, there might be shared variance between MMP and VA, which is absorbed by VA. Second, it could be that foveal function is more important for VF than the extrafoveal macula, reflecting cone density used for photopic vision in the human eye.38 Therefore, if foveal function is overall more important, and VA is a more accurate estimate of foveal function than MMP, this would explain the outperformance of VA.
Analyses with both eyes confirm the main finding that VA of the better eye outperforms MMP in the better eye. However, overall model performance was worse because MMP could not be performed in a substantial number of eyes with poor vision, resulting in fewer patients overall (n = 84) and a reduced range of VF scores (R^2^ was 39% for the best model in this series). Analyses with the worse-seeing eyes, although confounded by the absence of the strongest predictor (R^2^ was 14% for the best model in this series), still provides an indication of the relative predictive strengths of each MMP metric, because PRT failed to be forward selected and consistently underperformed in other analyses as well (Supplementary Tables S2 and S3).
Some notes on the different analyses of retinal sensitivity are warranted. There is ongoing experimentation with alternative analysis strategies.5^,^39^,^40 To our best knowledge, we are the first to perform the MS cd log transformation. In brief, according to the Weber–Fechner law, when light intensity increases exponentially, this is perceived linearly by humans.6 We attempted to use this to our advantage. If candela/m^2^ values are averaged before log transformation, this produces the effect of sensitizing the retinal sensitivity to scotoma formation (Fig. 12). There are theoretical limits to its applicability however; in the case of extensive scotoma, this logarithmic property likely masks the presence of areas with relatively good functionality. Among retinal sensitivity parameters (MS, MS cd log, and PRT), MS cd log and MS performed comparably and PRT performed worse. Considering MS cd log's sensitivity to scotoma formation while retaining a strong relationship with VF, further confirmatory research into its utility is warranted. These suggestions likewise apply to scotopic microperimetry and may benefit ongoing studies such as MACUSTAR (Development of Novel Clinical Endpoints in Intermediate AMD), which aims to explore structure–function relationships in intermediate patients.41
Example of retinal sensitivity values for early AMD Eye (left) and late AMD Eye (right). (A) Color fundus photography (CFP) of eye with early AMD. (B) Corresponding spectral-domain optical coherence tomography (SD-OCT) B-scan showing small drusen. (C) Corresponding retinal sensitivity. (D) Eye with advanced AMD. (E) Corresponding SD-OCT with hypertransmission and large drusen. (F) Corresponding retinal sensitivity. In (C) and (F), we show the MS, MS cd log, and PRT values. This figure demonstrates how different calculations of retinal sensitivity diverge in patients with varying stages of AMD.
VF and retinal function measures of best-seeing eye. (A) Visual function (LFVFS-39) and visual acuity (letters). (B) Visual function (LFVFS-39) and mesopic microperimetry (MS). (C) Visual function (LFVFS-39) and mesopic microperimetry (MS cd log). (D) Visual function (LFVFS-39) mesopic microperimetry (PRT). LFVFS-39, long form visual function score; VA, visual acuity; MS, mean sensitivity; MS cd log, mean sensitivity candela log; PRT, percent reduced threshold.
Strengths and Weaknesses
Although the study has strengths, including a systematic investigation of many MMP-derived variables, it also has limitations. An important limitation is the use of uniocular instead of binocular variables. In fact, in all three retinal sensitivity models of the best-seeing eye cohort, 50% of the variance remains unexplained. This factor is in part explained by the aforementioned limitation in addition to unmeasured social, cognitive, and psychological factors.42 Although assuredly preferable for a more accurate estimate of VF, statistical modelling on binocular vision presents power, interpretability, and feasibility challenges. To accommodate the complex interplay of both eyes, model complexity would increase, limiting overall interpretability of findings in relation to the research question. In addition, appropriate power for all relevant interactions, was, considering our sample size, not feasible.
Similarly reflecting a pragmatic solution to a complex problem, stepwise hierarchical linear regression allows for systematic and interpretable evaluation of variances in relation to overall model performance; however, it does not allow for potentially relevant interaction effects such as two eyes with highly advanced disease.43 Last, the NEI-VFQ–derived LFVFS-39 retains shortcomings, thus potentially contributing measurement error.27 In addition, VF might be intrinsically noisy. Future efforts might benefit from computer-adapted testing of VF, such as the rigorously validated EyeQ.44
Conclusions
MMP is associated with daily vision-dependent tasks, but VA provides a more meaningful estimation of this same construct. These results suggest that VA provides stronger evidence of potential clinical efficacy in trials than MMP. Replications of further studies are necessary to confirm these findings.
Supplementary Material
Supplement 1
The reference list from the paper itself. Each links out to its DOI / PubMed record.
- 1Colijn JM, Buitendijk GHS, Prokofyeva E, et al. Prevalence of age-related macular degeneration in Europe: the past and the future. Ophthalmology. 2017; 124: 1753–1763.28712657 10.1016/j.ophtha.2017.05.035PMC 5755466 · doi ↗ · pubmed ↗
- 2Pondorfer SG, Terheyden JH, Heinemann M, Wintergerst MWM, Holz FG, Finger RP. Association of vision-related quality of life with visual function in age-related macular degeneration. Sci Rep. 2019; 9: 15326.31653904 10.1038/s 41598-019-51769-7PMC 6814705 · doi ↗ · pubmed ↗
- 3Brody BL, Gamst AC, Williams RA, et al. Depression, visual acuity, comorbidity, and disability associated with age-related macular degeneration. Ophthalmology. 2001; 108: 1893–1900; discussion 1900–1891.11581068 10.1016/s 0161-6420(01)00754-0 · doi ↗ · pubmed ↗
- 4Csaky K, Ferris FIII, Chew EY, Nair P, Cheetham JK, Duncan JL. Report from the NEI/FDA endpoints workshop on age-related macular degeneration and inherited retinal diseases. Invest Ophthalmol Vis Sci. 2017; 58: 3456–3463.28702674 10.1167/iovs.17-22339 PMC 5961066 · doi ↗ · pubmed ↗
- 5Yang Y, Dunbar H. Clinical perspectives and trends: microperimetry as a trial endpoint in retinal disease. Ophthalmologica. 2021; 244: 418–450.33567434 10.1159/000515148 PMC 8686703 · doi ↗ · pubmed ↗
- 6Pfau M, Jolly JK, Wu Z, et al. Fundus-controlled perimetry (microperimetry): application as outcome measure in clinical trials. Prog Retin Eye Res. 2021; 82: 100907.33022378 10.1016/j.preteyeres.2020.100907 PMC 12872260 · doi ↗ · pubmed ↗
- 7von der Emde L, Pfau M, Thiele S, et al. Mesopic and dark-adapted two-color fundus-controlled perimetry in choroidal neovascularization secondary to age-related macular degeneration. Transl Vis Sci Technol. 2019; 8: 7.10.1167/tvst.8.1.7PMC 632734830637177 · doi ↗ · pubmed ↗
- 8Lindner M, Nadal J, Mauschitz MM, et al. Combined fundus autofluorescence and near infrared reflectance as prognostic biomarkers for visual acuity in foveal-sparing geographic atrophy. Invest Ophthalmol Vis Sci. 2017; 58: Bio 61–bio 67.28475704 10.1167/iovs.16-21210 · doi ↗ · pubmed ↗