Optimal Dietary Dunaliella salina Supplementation Enhances Growth, Antioxidant Capacity, Immune Response, Stress Tolerance, and Carotenoid‐Based Pigmentation in Juvenile Red Swamp Crayfish (Procambarus clarkii)
Chen Qian, Jinghao Li, Yawen Zhang, Yongxu Cheng, Jiayao Li

TL;DR
Adding Dunaliella salina to crayfish diets improves growth, immunity, stress tolerance, and coloration, with optimal benefits at specific inclusion levels.
Contribution
This study identifies optimal dietary levels of Dunaliella salina for enhancing crayfish health and pigmentation through empirical testing.
Findings
A 2.00% D. salina inclusion maximized weight gain and growth rates in juvenile crayfish.
A 0.67% inclusion level significantly enhanced antioxidant capacity and immune response.
Dietary D. salina was efficiently converted to astaxanthin, improving tissue pigmentation in a dose-dependent manner.
Abstract
To meet the growing market demand for high‐quality red swamp crayfish (Procambarus clarkii), nutritional strategies are needed to improve both health and visual traits. The microalga Dunaliella salina, renowned for its rich natural β‐carotene content, presents a promising solution. This study investigated the effects of dietary supplementation with D. salina powder at five graded levels (0%, 0.34%, 0.67%, 1.34%, and 2.00%) on juvenile crayfish over a 60‐day feeding trial. Results demonstrated that weight gain rate (WGR) and specific growth rate (SGR) were highest in the 2.00% supplementation group. Notably, a low inclusion level of 0.34% significantly promoted ovarian development, as evidenced by the highest gonadosomatic index (GSI) and digestive enzyme activities. Antioxidant capacity (AOC, total superoxide dismutase [T‐SOD], total AOC [T‐AOC]) and nonspecific immunity (alkaline…
Genes, proteins, chemicals, diseases, species, mutations and cell lines named across the full text — each resolved to its canonical identifier and authoritative record.
Click any figure to enlarge with its caption.
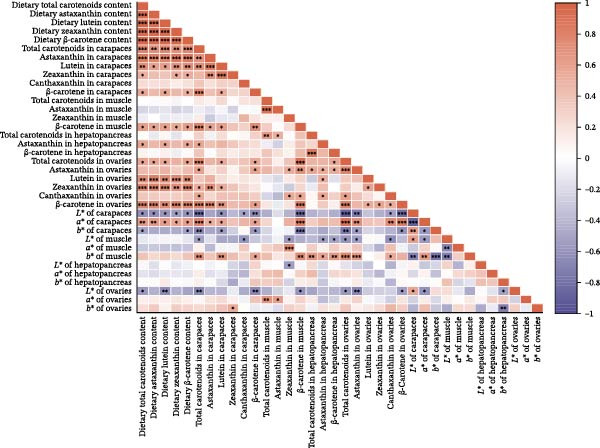 Figure 8
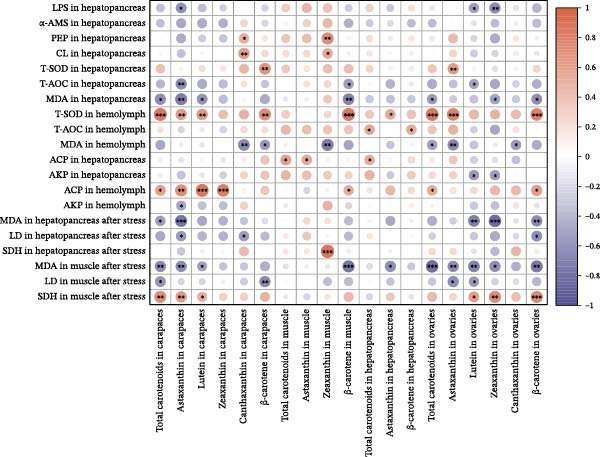 Figure 9
| Items | D0 | D0.34 | D0.67 | D1.34 | D2.00 |
|---|---|---|---|---|---|
| Ingredients (%) | |||||
|
| 0.00 | 0.34 | 0.67 | 1.34 | 2.00 |
| Wheat flour | 14.2 | 13.86 | 13.53 | 12.86 | 12.20 |
| Other ingredients1 | 85.8 | 85.8 | 85.8 | 85.8 | 85.8 |
| Total | 100 | 100 | 100 | 100 | 100 |
| Composition (% dry diet)2 | |||||
| Moisture | 10.92 | 9.02 | 9.31 | 10.01 | 9.63 |
| Crude protein | 38.90 | 39.90 | 39.76 | 39.64 | 39.85 |
| Crude lipid | 7.29 | 7.37 | 7.72 | 7.20 | 7.37 |
| Ash | 11.26 | 11.19 | 11.60 | 11.61 | 12.29 |
| Carotenoid content (mg kg −1 dry diet)3 | |||||
| Total carotenoids | 4.21 ± 1.09d | 65.98 ± 2.45c | 162.96 ± 0.73b | 259.41 ± 16.71b | 402.78 ± 22.44a |
| Astaxanthin | 0.97 ± 0.07c | 4.96 ± 0.07b | 5.37 ± 0.54 bb | 10.68 ± 0.50a | 15.36 ± 1.10a |
| Lutein | 1.54 ± 0.06e | 2.79 ± 0.04d | 5.55 ± 0.07c | 6.35 ± 0.16b | 10.89 ± 0.12a |
| Zeaxanthin | 0.35 ± 0.03d | 5.48 ± 0.10c | 8.78 ± 0.22b | 23.77 ± 5.27a,b,c,d | 33.34 ± 0.26a |
| β‐Carotene | 1.32 ± 0.29d | 48.01 ± 0.40c | 104.36 ± 1.04b | 206.90 ± 16.76a,b | 299.00 ± 7.59a |
| Items | D0 | D0.34 | D0.67 | D1.34 | D2.00 | Linear | Quadratic | ||
|---|---|---|---|---|---|---|---|---|---|
|
|
|
|
| ||||||
| IBW (g) | 5.99 ± 0.25 | 6.62 ± 0.20 | 6.48 ± 0.09 | 6.23 ± 0.32 | 6.10 ± 0.22 | 0.637 | 0.018 | 0.333 | 0.167 |
| FBW (g) | 12.30 ± 0.74 | 10.83 ± 0.68 | 12.42 ± 1.43 | 13.54 ± 1.07 | 14.03 ± 0.98 | 0.066 | 0.524 | 0.372 | 0.490 |
| CF (%) | 6.58 ± 0.17 | 6.54 ± 0.07 | 6.57 ± 0.21 | 6.56 ± 0.05 | 6.38 ± 0.13 | 0.310 | 0.079 | 0.499 | 0.109 |
| WGR (%) | 106.69 ± 15.35a,b | 71.19 ± 13.41b | 108.49 ± 15.84a,b | 124.48 ± 17.89a | 134.43 ± 9.06a | 0.027 | 0.178 | 0.215 | 0.178 |
| SGR (%/d) | 1.19 ± 0.13a,b | 0.87 ± 0.12b | 1.20 ± 0.13a,b | 1.32 ± 0.14a | 1.41 ± 0.06a | 0.027 | 0.148 | 0.191 | 0.155 |
| HSI (%) | 6.90 ± 0.34 | 7.00 ± 0.18 | 7.07 ± 0.16 | 6.94 ± 0.47 | 7.57 ± 0.21 | 0.145 | 0.156 | 0.264 | 0.199 |
| GSI (%) | 2.57 ± 0.19b,c | 4.04 ± 0.56a | 3.39 ± 0.30a,b | 2.13 ± 0.28c | 2.35 ± 0.23b,c | 0.093 | 0.201 | 0.181 | 0.248 |
| MY (%) | 13.72 ± 0.35 | 14.14 ± 0.13 | 12.87 ± 0.38 | 13.59 ± 0.44 | 13.18 ± 0.53 | 0.300 | 0.082 | 0.560 | 0.092 |
| Items | D0 | D0.34 | D0.67 | D1.34 | D2.00 | Linear | Quadratic | |||
|---|---|---|---|---|---|---|---|---|---|---|
|
|
|
|
| |||||||
|
| Carapaces | 54.84 ± 0.34a | 48.23 ± 0.86b | 46.16 ± 0.50b | 45.30 ± 0.76b | 47.17 ± 0.51b | 0.012 | 0.395 | 0.000 | 0.880 |
|
| Carapaces | 20.82 ± 1.29b | 28.73 ± 0.89a | 30.51 ± 0.73a | 31.10 ± 0.37a | 30.14 ± 0.59a | 0.009 | 0.418 | 0.000 | 0.814 |
|
| Carapaces | 24.53 ± 0.57a | 24.23 ± 0.40a,b | 22.99 ± 0.31b,c | 22.30 ± 0.42c | 23.46 ± 0.18a,b,c | 0.055 | 0.255 | 0.004 | 0.595 |
|
| Muscle | 91.92 ± 0.32a | 90.23 ± 0.11c | 90.43 ± 0.27b,c | 90.10 ± 0.35c | 91.36 ± 0.49a,b | 0.727 | 0.010 | 0.005 | 0.592 |
|
| Muscle | 2.70 ± 0.17b | 4.06 ± 0.19a | 3.49 ± 0.33a,b | 3.18 ± 0.13a,b | 2.63 ± 0.16b | 0.218 | 0.114 | 0.036 | 0.425 |
|
| Muscle | 5.97 ± 0.21b | 6.79 ± 0.02a,b | 8.47 ± 0.34a | 8.40 ± 0.70a,b | 6.99 ± 0.32a,b | 0.215 | 0.116 | 0.001 | 0.703 |
|
| Hepatopancreas | 34.66 ± 0.39a | 30.07 ± 1.54b | 34.53 ± 1.85a | 32.92 ± 0.79a,b | 32.69 ± 0.64a,b | 0.809 | 0.005 | 0.946 | 0.009 |
|
| Hepatopancreas | 8.42 ± 0.89 | 7.93 ± 1.17 | 10.34 ± 0.60 | 8.96 ± 0.78 | 7.37 ± 0.81 | 0.510 | 0.034 | 0.187 | 0.244 |
|
| Hepatopancreas | 12.42 ± 0.44a,b,c | 11.52 ± 0.54b,c | 14.78 ± 1.06a | 10.09 ± 1.37c | 13.27 ± 0.80a,b | 0.952 | 0.000 | 0.926 | 0.013 |
|
| Ovaries | 55.05 ± 0.34a | 52.83± 0.49a,b | 48.81 ± 0.54c | 53.44 ± 0.41a | 49.74 ± 0.57b,c | 0.060 | 0.246 | 0.117 | 0.301 |
|
| Ovaries | 24.88 ± 0.14 | 25.12 ± 0.20 | 25.30 ± 0.68 | 25.17 ± 0.27 | 25.13 ± 0.32 | 0.704 | 0.011 | 0.744 | 0.048 |
|
| Ovaries | 19.10 ± 0.32b | 20.52 ± 0.12a,b | 18.95 ± 0.61a,b | 22.18 ± 0.27a | 19.71 ± 0.33b | 0.267 | 0.094 | 0.143 | 0.277 |
| Items | D0 | D0.34 | D0.67 | D1.34 | D2.00 | Linear | Quadratic | |||
|---|---|---|---|---|---|---|---|---|---|---|
|
|
|
|
| |||||||
| Total carotenoids | Carapaces | 49.87 ± 5.48b | 79.22 ± 8.63a,b | 110.65 ± 4.99a | 111.54 ± 5.97a | 112.65 ± 10.09a | 0.001 | 0.559 | 0.000 | 0.803 |
| Astaxanthin | Carapaces | 24.22 ± 1.61b | 24.67 ± 2.92b | 29.45 ± 0.82b | 39.28 ± 2.89a | 40.60 ± 4.06a | 0.000 | 0.716 | 0.000 | 0.724 |
| Lutein | Carapaces | 3.98 ± 0.51c | 4.40 ± 0.37b,c | 5.29 ± 0.44a,b,c | 6.68 ± 0.28a | 5.90 ± 0.68a,b | 0.004 | 0.479 | 0.003 | 0.620 |
| Zeaxanthin | Carapaces | 0.50 ± 0.09a,b | 0.53 ± 0.08a,b | 0.53 ± 0.04b | 0.76 ± 0.02a | 0.62 ± 0.08a,b | 0.054 | 0.257 | 0.088 | 0.333 |
| Canthaxanthin | Carapaces | 9.07 ± 0.04b | 9.21 ± 0.04a | 9.17 ± 0.02a,b | 9.14 ± 0.02a,b | 9.17 ± 0.04a,b | 0.446 | 0.045 | 0.451 | 0.124 |
| β‐carotene | Carapaces | 11.67 ± 0.21c | 12.28 ± 0.22b,c | 13.49 ± 0.53a | 12.85 ± 0.21a,b | 13.05 ± 0.38a,b | 0.057 | 0.251 | 0.027 | 0.452 |
| Total carotenoids | Muscle | 14.85 ± 1.13 | 19.67 ± 2.30 | 26.08 ± 7.47 | 19.45 ± 1.16 | 17.54 ± 3.92 | 0.953 | 0.000 | 0.280 | 0.191 |
| Astaxanthin | Muscle | 9.79 ± 0.20 | 10.40 ± 0.06 | 10.78 ± 1.12 | 9.66 ± 0.13 | 9.66 ± 0.77 | 0.460 | 0.043 | 0.535 | 0.099 |
| Zeaxanthin | Muscle | 0.40 ± 0.03b,c | 0.71 ± 0.02a | 0.56 ± 0.01b | 0.54 ± 0.02b | 0.49 ± 0.06a,b | 0.769 | 0.007 | 0.173 | 0.254 |
| β‐carotene | Muscle | 9.89 ± 0.07c | 10.29 ± 0.11b,c | 10.96 ± 0.10a | 10.92 ± 0.11a,b | 10.66 ± 0.06a,b | 0.017 | 0.366 | 0.000 | 0.841 |
| Total carotenoids | Hepatopancreas | 27.62 ± 5.42 | 24.57 ± 1.99 | 153.31 ± 41.74 | 67.04 ± 34.95 | 31.60 ± 6.39 | 0.993 | 0.000 | 0.101 | 0.317 |
| Astaxanthin | Hepatopancreas | 9.55 ± 0.12 | 9.70 ± 0.07 | 9.78 ± 0.18 | 9.85 ± 0.16 | 9.95 ± 0.14 | 0.037 | 0.294 | 0.106 | 0.312 |
| β‐carotene | Hepatopancreas | 15.69 ± 1.15 | 20.82 ± 0.65 | 100.60 ± 35.66 | 58.52 ± 28.89 | 23.51 ± 2.56 | 0.833 | 0.004 | 0.077 | 0.348 |
| Total carotenoids | Ovaries | 1119.36 ± 134.77a,b | 1606.68 ± 51.34b | 1966.45 ± 50.40a | 1974.44 ± 23.95a | 1750.54 ± 56.93a,b | 0.024 | 0.335 | 0.000 | 0.868 |
| Astaxanthin | Ovaries | 507.64 ± 35.70b | 659.84 ± 24.55a | 737.02 ± 32.68a | 650.96 ± 23.32a | 678.14 ± 38.30a | 0.116 | 0.179 | 0.022 | 0.471 |
| Lutein | Ovaries | 12.82 ± 1.39a,b | 14.98 ± 0.59a,b | 13.30 ± 0.78b | 15.19 ± 0.78a,b | 19.23 ± 0.87a | 0.001 | 0.578 | 0.002 | 0.654 |
| Zeaxanthin | Ovaries | 3.50 ± 0.18c | 3.80 ± 0.10b,c | 3.73 ± 0.09b,c | 5.44 ± 0.83a,b | 7.08 ± 0.95a | 0.000 | 0.691 | 0.000 | 0.729 |
| Canthaxanthin | Ovaries | 19.89 ± 0.06b | 20.08 ± 0.02a,b | 20.05 ± 0.08a,b | 20.12 ± 0.06a | 20.04 ± 0.06a,b | 0.209 | 0.118 | 0.048 | 0.396 |
| β‐carotene | Ovaries | 89.73 ± 33.45b | 328.02 ± 70.43a,b | 425.25 ± 64.36a,b | 554.68 ± 56.07a | 538.27 ± 50.45a | 0.000 | 0.624 | 0.000 | 0.809 |
- —Ministry of Agriculture of the People's Republic of China10.13039/501100004573
- —National Natural Science Foundation of China10.13039/501100001809
- —Ministry of Agriculture and Rural Affairs of the People's Republic of China10.13039/501100011798
Peer Reviews
No public reviews on file for this paper yet. If you reviewed it on a platform where reviews are public (OpenReview, ICLR, NeurIPS, ICML), you can paste yours below so the community can read it here.
Videos
No videos yet. Explain this paper in a talk, walkthrough, or lecture? Add one.
Taxonomy
TopicsCrustacean biology and ecology · Aquaculture Nutrition and Growth · Invertebrate Immune Response Mechanisms
1. Introduction
The red swamp crayfish (Procambarus clarkii) is one of the primary freshwater crustaceans in China, characterized by the highest yield and significant economic value [1]. However, as consumer expectations evolve, the market now demands higher standards in terms of product safety, nutritional value, and visual appeal, particularly a desirable reddish pigmentation. This shift is driving the industry from “quantity‐driven expansion” toward “quality and efficiency improvement” [2], thereby necessitating the development of novel, multifunctional feeds that not only support basic growth but also enhance health, improve product quality, and are sustainable and cost‐effective. Dietary supplementation of carotenoids represents a viable strategy for improving the physiological condition of premium red swamp crayfish, especially in terms of stress resistance and desirable commercial attributes during the farming process [3].
Carotenoid additives in aquatic feed have garnered widespread attention, such as astaxanthin, β‐carotene, canthaxanthin, lutein, and zeaxanthin. Compared to the more expensive astaxanthin, β‐carotene offers a more cost‐effective alternative. Numerous studies have demonstrated that the incorporation of β‐carotene into feed formulas of crustaceans significantly improves antioxidant capacity (AOC), immune function, stress resistance, and pigmentation, as evidenced in Pacific white shrimp (Litopenaeus vannamei), swimming crab (Portunus trituberculatus), and Chinese mitten crab (Eriocheir sinensis) [4–6]. However, the efficacy of synthetic carotenoids in improving antioxidant function remains inferior to that of natural pigments [7]. Microalgae, as ideal functional feed additives, combine the comprehensive advantages of natural origin, high efficacy, and low environmental impact [8, 9]. They not only grow rapidly with high yields but are also regarded as strategic resources for carotenoid production [10], exhibiting high bioactivity and absorption efficiency [11]. Furthermore, they provide proteins, lipids, polysaccharides, and other micronutrients, offering potential synergistic benefits beyond pigment supply. For instance, Arthrospira platensis is more effective than lutein in enhancing the AOC and disease resistance of aquatic animals [12]. Compared to synthetic astaxanthin, Haematococcus pluvialis powder is more efficient in enhancing the growth and AOC of L. vannamei [13].
Dunaliella salina, a halophilic green microalga, stands out as one of the richest natural sources of β‐carotene, comprising 8%–14% of its dry weight [14]. D. salina exhibits tolerance to extreme salinity, which not only reduces the risk of contamination during cultivation but also enables efficient utilization of seawater, salt lake water, and even industrial wastewater [15]. Its growth process can sequester carbon dioxide and produce high‐value natural β‐carotene [16]. Therefore, compared to the stringent cultivation conditions of H. pluvialis, D. salina offers a more cost‐effective and environmentally friendly alternative. Liu et al. [17] revealed through comparative transcriptomics that both astaxanthin from H. pluvialis and β‐carotene from D. salina improve the AOC and immunity of E. sinensis. Thus, D. salina can be considered a highly promising feed additive. Studies on D. salina in L. vannamei have confirmed its ability to significantly enhance immunity and AOC [18]. In addition, in black tiger shrimp (Penaeus monodon) and red claw crayfish (Cherax quadricarinatus), supplementation with D. salina powder has been shown to significantly improve body pigmentation [19, 20].
While the potential of D. salina is evident, critical knowledge gaps remain regarding its application in the farming of red swamp crayfish. First, the optimal dietary supplementation level required to effectively enhance antioxidant and immune functions in P. clarkii has not been systematically determined. Second, the quantitative relationship between dietary D. salina, carotenoid deposition, and body color parameters remains unclear. Most existing studies report qualitative improvements but lack the precise data needed for feed formulation. Third, it is still uncertain whether supplementation with D. salina can confer additional, previously unexplored benefits to P. clarkii, such as the promotion of ovarian development or enhanced stress tolerance as reported in prior studies [21, 22]. To address these gaps, this study systematically evaluated the effects of graded levels of D. salina powder on the growth performance, digestive enzyme activity, nonspecific immunity, AOC, air‐exposure stress resilience, tissue pigmentation, and carotenoid deposition in juvenile red swamp crayfish. The objectives were as follows: (1) to determine the optimal supplementation level for growth, health, and pigmentation; (2) to elucidate the correlations between carotenoid deposition and body color performance; and (3) to explore its potential novel benefits. The findings are expected to provide a scientific basis for the precise, value‐added use of D. salina in crayfish feeds, thereby supporting the sustainable and high‐quality development of the industry.
2. Materials and Methods
2.1. Feed Preparation Procedures
The feed formula was based on the balanced nutritional structure, and the proportion of D. salina powder was gradually increased to explore its suitable dosage in crayfish feed. Experimental diets were formulated by supplementing a basal formulation with D. salina powder at graded levels of 0.00%, 0.34%, 0.67%, 1.34%, and 2.00%, designated as D0, D0.34, D0.67, D1.34, and D2.00, respectively (Table 1). The basal diet composition and preparation process followed our previous study [3]. All solid feed ingredients were crushed using a high‐speed grinder and sieved through a 0.25 mm mesh to ensure homogeneity. The ingredients were then precisely weighed, thoroughly blended, and moistened with 20% distilled water to facilitate pelleting. Diets were extruded through a pelletizer to produce pellets measuring 2 mm in diameter and 10 mm in length. The formulated diets were subsequently air‐dried, vacuum‐sealed, and stored at −20°C in darkness to prevent nutrient degradation until use.
2.2. Experimental Design
This study comprised a 60‐day feeding trial with different D. salina powder‐supplemented diets and a 24 h air‐exposure stress test. Juvenile red swamp crayfish were collected from the Chongming Aquaculture Demonstration Base affiliated with Shanghai Ocean University. Before the formal experiment, all crayfish were subjected to a 7‐day acclimation period. Two hundred forty juvenile crayfish (initial average weight 6.28 g, sex ratio = 1 : 1) that were similar in size, vigorous, and morphologically intact were selected and randomly stocked into five dietary groups, each with three recirculating aquaculture tank replicates. The tanks were 224 mm in length, 140 mm in width, and 330 mm in height, with a water level maintained at 200 mm, and were partitioned using plastic dividers. Sixteen juvenile crayfish were evenly distributed in each tank. Daily rations (3%–5% of the total body weight) were dispensed at 18 : 00, residues and feces were siphoned off at 08 : 00 to safeguard water quality. If any crayfish died during the experiment, the dead individuals were immediately removed to prevent water contamination. Crayfish were exposed to a 12L:12D cycle for the entire study, and water quality parameters were kept within the optimal range. At the termination of the feeding trial, four crayfish per replicate were retained for the subsequent air‐exposure challenge. The body weight and length of the crayfish were measured using a digital balance and a vernier caliper. The weights of the tail muscles, hepatopancreas, and ovaries were also recorded. Subsequently, the following indices were calculated as follows:
where N represents the number of surviving crayfish in each group at the end of the experiment, Wo, W, and L denote the initial body weight, final body weight, and body length, respectively, while H, M, and O are the hepatopancreas, muscle, and ovary tissue weights, respectively.
The remaining crayfish were individually transferred to clean plastic containers (115 mm × 85 mm × 60 mm) and subjected to a 24‐h air exposure stress test. Throughout the test period, environmental conditions were strictly controlled, with temperature maintained at 20 ± 1°C and relative humidity at 50 ± 5%.
2.3. Sample Collection and Determination of Enzyme Activities
After trials were completed, the crayfish were anesthetized with ice water, measured and weighed, then dissected for sampling. The hemolymph and hepatopancreas samples from the feeding trial, as well as the hepatopancreas and muscle tissues from the stress test, were immediately stored in nine volumes of ice‐cold physiological saline solution, homogenized, centrifuged, and the supernatant was obtained for subsequent analysis. All enzyme activity determinations were strictly carried out in accordance with the kits provided by the manufacturer (Jiancheng Bioengineering Institute, Nanjing, China). Four digestive enzymes, including lipase (LPS), α‐amylase (α‐AMS), pepsin (PEP), and cellulase (CL), as well as immune and antioxidant indices such as acid phosphatase (ACP), alkaline phosphatase (AKP), total superoxide dismutase (T‐SOD), total AOC (T‐AOC), and malondialdehyde (MDA), were determined. In addition, respiratory metabolism‐related indicators, including MDA, lactate (LD), and succinate dehydrogenase (SDH) after air exposure stress, were evaluated [25].
2.4. Color Parameters Determination
The surface color of freeze–dried carapace, muscle, hepatopancreas, and ovary samples was measured using a CR‐400 colorimeter (Konica Minolta, Marunouchi, Tokyo, Japan), which provided L ^∗^ (lightness), a ^∗^ (red–green), and b ^∗^ (yellow–blue) values [26]. Six random measurements were taken per sample and averaged for data analysis.
2.5. Carotenoid Composition Assessment
Total carotenoid content in diets and tissues was extracted with acetone and quantified spectrophotometrically at 470 nm. Individual carotenoids (astaxanthin, lutein, zeaxanthin, canthaxanthin, and β‐carotene) were identified and quantified using high‐performance liquid chromatography (HPLC) following established methods [3, 27]. The actual β‐carotene content in feeds was 1.32, 48.01, 104.36, 206.90, and 299.00 mg kg^−1^, respectively. The dietary carotenoid content was linearly correlated with the supplementation level of D. salina powder (Figure 1).
Figure 1. Dose–response linearity between D. salina powder inclusion and dietary carotenoid concentration. (a) Total carotenoids; (b) astaxanthin; (c) lutein; (d) zeaxanthin; (e) β‐carotene. Each point is the mean ± SE of three independent tanks.(a)(b)(c)(d)(e)
2.6. Statistical Analysis
The Shapiro–Wilk test was applied to confirm normal distribution, and equality of variances was checked with Levene’s test. For data meeting both assumptions, differences among groups were assessed by one‐way ANOVA followed by Duncan’s post hoc comparisons; otherwise, Welch’s test and the Games–Howell comparison test were applied. Regression analysis was conducted to evaluate potential linear or quadratic relationships between the dietary D. salina powder supplementation levels and the corresponding response variables. Relationships among carotenoid content in the diets and crayfish tissues, color parameters, and physiological indicators were explored using Pearson correlation analysis. The optimal dietary supplementation level of D. salina powder was determined based on carotenoid deposition in crayfish tissues. Analyses were performed with IBM SPSS Statistics v22.0, bar plots were generated in GraphPad Prism 9, and correlation heatmaps were constructed with Origin 2023.
3. Results
3.1. Survival and Growth Indices
After the D. salina powder supplemented diets feeding trial, except for the D0 group (95.24%) and D0.34 group (97.62%), survival in all other treatment groups reached 100%. Growth performance parameters of crayfish fed diets containing different amounts of D. salina powder are presented in Table 2. Both weight gain rate (WGR) and specific growth rate (SGR) exhibited a nonlinear response to dietary D. salina inclusion, declining to their lowest values in the D0.34 group before increasing to a maximum in the D2.00 group. Gonadosomatic index (GSI) in D0.34 exceeded that in all other groups (p < 0.05). Furthermore, no differences were detected in FBW, CF, MY, and HSI among the treatment groups (p > 0.05).
3.2. Digestive Enzymes
Figure 2 depicts the digestive enzyme profile of juvenile crayfish. All four digestive enzymes exhibited a single‐peak pattern, with activities highest in the D0.34 group. Specifically, α‐AMS, PEP, and CL activities in D0.34 exceeded those of D0, D1.34, and D2.00 (p < 0.05), whereas LPS displayed a significant quadratic relationship with dietary D. salina level (p < 0.05).
Figure 2. Digestive response parameters to dietary D. salina powder levels of crayfish. Results are presented as mean ± SE (n = 3), within five treatments, bars topped by different letters differ significantly (p < 0.05): (a) Lipase; (b) α‐amylase; (c) Pepsin; (d) Cellulase.(a)(b)(c)(d)
3.3. Nonspecific Immune Enzymes
As shown in Figure 3, in the hepatopancreas, AKP activity demonstrated a significant quadratic relationship with the level of D. salina powder (p < 0.05), peaking in the D0.67 group, surpassing all other treatments (p < 0.05). However, ACP activity remained comparable among groups (p > 0.05). In the hemolymph, AKP activity was the highest in the D0.34 group (p < 0.05). With rising D. salina inclusion, ACP activity gradually rose, peaking in the D1.34 group, then declined, and exhibited a significant quadratic correlation with the D. salina powder levels.
Figure 3. Nonspecific immune response parameters to dietary D. salina powder levels of crayfish. (a, c) AKP, alkaline phosphatase; (b, d) ACP, acid phosphatase. Results are presented as mean ± SE (n = 3), within five treatments, bars topped by different letters differ significantly (p < 0.05): (a) AKP, alkaline phosphatase in the hepatopancreas; (b) ACP, acid phosphatase in the hepatopancreas; (c) AKP, alkaline phosphatase in the hemolymph; (d) ACP, acid phosphatase in the hemolymph.(a)(b)(c)(d)
3.4. Antioxidative Response
The antioxidative response‐related parameters are presented in Figure 4. T‐SOD activity in the hepatopancreas and hemolymph, as well as T‐AOC in the hemolymph, first increased and then declined with rising D. salina powder amounts, reaching its peak in the D0.67 group, remarkably exceeding the D0 level (p < 0.05). However, no significant differences emerged in T‐AOC in the hemolymph between the control group and other D. salina supplemented groups (p > 0.05). Hepatopancreatic and hemolymph MDA levels of D. salina powder‐supplemented groups fell significantly below D0 values (p < 0.05), reaching their lowest values in the D2.00 and D0.34 groups, respectively. Moreover, regression analysis indicated that hepatopancreatic MDA and T‐AOC, along with hemolymph T‐SOD activity, showed significant quadratic correlations with the level of D. salina powder (p < 0.05).
Figure 4. Antioxidant response parameters to dietary D. salina powder levels of crayfish. (a) T‐SOD, total superoxide dismutase; (b) T‐AOC, total antioxidant capacity; (c) MDA, malondialdehyde. Results are shown as mean ± SE (n = 3), bars topped by different letters differ among the five treatments (p < 0.05).(a)(b)(c)
3.5. Air Exposure Stress Tolerance
After 24 h exposure to air stress, stress tolerance‐related parameters are shown in Figure 5. Hepatopancreatic and muscle MDA levels of crayfish decreased with the increase of the level of D. salina powder, reaching its lowest value in the D2.00 group, which exhibited a quadratic relationship with dietary D. salina amounts (p < 0.05). Muscle LD content dropped steadily, and the lowest value also appeared in the D2.00 group, falling below D0 group (p < 0.05), whereas hepatopancreatic LD remained uniform across groups (p > 0.05). The activity of SDH in the hepatopancreas initially increased and then decreased, reaching the peak in the D0.34 group (p < 0.05). In contrast, SDH activity in the muscles rose continuously to a maximum in D2.00 group, considerably correlated with the level of D. salina supplementation (p < 0.05).
Figure 5. Air‐exposure stress response parameters to dietary D. salina powder levels of crayfish. (a) MDA, malondialdehyde; (b) LD, lactic acid; (c) SDH, succinate dehydrogenase. Results are shown as mean ± SE (n = 3), bars topped by different letters differ among the five treatments (p < 0.05).(a)(b)(c)
3.6. Coloration Parameters
Table 3 presents the color values of different tissues (carapaces, muscles, hepatopancreas, and ovaries). The L ^∗^ and a ^∗^ values in the carapaces of crayfish fed with D. salina powder supplemented diets were pronouncedly lower/higher than those of the D0 group (p < 0.05), with extreme values observed in the D1.34 group, with a significant quadratic relationship with the levels of D. salina powder (p < 0.05). The b ^∗^ value of the carapaces exhibited a quadratic response to dietary D. salina powder (p < 0.05), initially declining and then rising, with the minimum recorded in the D0.67 group. The L ^∗^ and a ^∗^ values in the muscles were consistent with the trend in the carapaces, while the b ^∗^ value showed the opposite trend, and both showed significant quadratic changes (p < 0.05). Similarly, hepatopancreatic and ovarian L ^∗^ values continuously decreased, with the lowest values occurring in the D0.34 and D0.67 groups, respectively, and the b ^∗^ value in the ovaries showed the opposite trend, peaking in the D1.34 group, and all differed markedly from the control (p < 0.05). No significant effects of D. salina powder were detected on hepatopancreatic a ^∗^ or b ^∗^, or on ovarian a ^∗^, relative to the D0 group (p > 0.05). β‐Carotene from D. salina produced tissue‐dependent color shifts in crayfish.
3.7. Carotenoid Composition
The accumulation contents of carotenoids are presented in Table 4. In the carapaces, the contents of total carotenoids, astaxanthin, and lutein showed a general increasing trend with dietary D. salina level, attaining their highest concentrations in the D1.34 and D2.00 groups. Zeaxanthin and β‐carotene peaked in the D0.34 and D0.67 groups, respectively, and were significantly higher than in the control group (p < 0.05). In the muscles, zeaxanthin content was the highest in the D0.34 group, and β‐carotene content was the highest in the D0.67 group, both significantly higher than the control group (p < 0.05). In the ovaries, zeaxanthin and β‐carotene continuously increased with the supplementation level of D. salina powder, reaching their maximum values in the D1.34 group (p < 0.05). Similarly, astaxanthin and zeaxanthin contents also increased and reached their peaks in the D0.67 and D2.00 groups, respectively, and both were significantly higher than the control group (p < 0.05). However, although total carotenoids in the D1.34 group and lutein in the D2.00 group were numerically highest, neither differed significantly from the control (p > 0.05). Additionally, the contents of other measured carotenoids did not show significant differences among the groups (p > 0.05). Notably, astaxanthin content in the carapaces, as well as lutein and zeaxanthin contents in the ovaries, exhibited a significant linear increase in relation to the dietary D. salina powder content (p < 0.05) (Figure 6). Based on quadratic regression models, it was determined that supplementing the diet with 1.23%–1.53% D. salina powder resulted in the highest levels of total carotenoids and lutein in the carapaces, as well as total carotenoids and β‐carotene in the ovaries (Figure 7).
Figure 6. Linear relationship of carotenoid contents in tissues to D. salina powder supplementation levels. (a) Astaxanthin in carapaces; (b) lutein in ovaries; (c) zeaxanthin in ovaries. Each point is the mean ± SE of three independent tanks.(a)(b)(c)
Figure 7. Regression analysis of dietary D. salina powder supplementation levels based on carotenoid accumulation in tissues of red swamp crayfish. (a) Total carotenoids in carapaces; (b) lutein in carapaces; (c) total carotenoids in ovaries; (d) β‐carotene in ovaries. Each point is the mean ± SE of three independent tanks.(a)(b)(c)(d)
3.8. Correlation Analysis of Carotenoid Content With Tissue Color Parameters
The correlations between carotenoid contents and color parameters are illustrated in Figure 8. A highly significant correlation was observed among various carotenoids in the feed (p < 0.001). Carapace total carotenoids and astaxanthin, together with ovarian lutein, zeaxanthin, and β‐carotene content, all positively with dietary carotenoid level (p < 0.01). Furthermore, a significant positive correlation was observed among the various carotenoids within the carapaces and ovaries, respectively. More importantly, carotenoid accumulation was significantly correlated with shifts in tissue color parameters. To be specific, the L ^∗^, b ^∗^,and a ^∗^ values in the carapaces are significantly positively/negatively correlated with the total carotenoid content in the carapaces (p < 0.01). In the ovaries, the L ^∗^ value was significantly negatively correlated with total carotenoids, astaxanthin, and β‐carotene contents (p < 0.05). Additionally, the L ^∗^ value fell sharply with a rising a ^∗^ value in the carapaces (p < 0.001), while a significant positive correlation was observed between the L ^∗^ and b ^∗^ values (p < 0.01). In the muscle tissue, the L ^∗^ value was significantly negatively correlated with both the a ^∗^ and b ^∗^ values (p < 0.01), whereas the correlations in the hepatopancreas and ovaries were less pronounced.
The heatmap of the relationships among dietary carotenoid content, color parameters, and carotenoid contents in different tissues of red swamp crayfish using the Pearson correlation analysis. Red bars are positive, purple bars are negative, and ∗, ∗∗, and ∗∗∗ mark significance at p < 0.05, p < 0.01, and p < 0.001, respectively.
3.9. Correlation Analysis of Carotenoid Content With Physiological Indicators
As shown in Figure 9, the digestive enzymes in the hepatopancreas show relatively weak correlations with the carotenoid content in tissues. The T‐SOD activity in the hemolymph was highly significant and strongly positively correlated with the total carotenoids in the carapaces, the β‐carotene in the muscles, and the total carotenoids, astaxanthin, and β‐carotene in the ovaries (p < 0.001). The ACP activity in the hemolymph was also highly significant and positively correlated with the lutein and zeaxanthin in the carapaces (p < 0.001). After air exposure stress, the MDA content in the hepatopancreas was significantly negatively correlated with the astaxanthin in the carapaces and the lutein and zeaxanthin in the ovaries (p < 0.01). Additionally, the SDH activity in the muscles was significantly positively correlated with the astaxanthin in the carapaces and the zeaxanthin in the ovaries (p < 0.01). Tissue pigment accumulation reflected differences in AOC, immunity, and resistance to air exposure stress of crayfish.
A heatmap illustrates the correlations between carotenoid levels in various tissues and the physiological indices of red swamp crayfish. Red bars are positive, purple bars are negative, and ∗, ∗∗, and ∗∗∗ mark significance at p < 0.05, p < 0.01, and p < 0.001, respectively.
4. Discussion
4.1. Growth Performance, Ovary Development, and Digestive Capacity
D. salina ranks among the richest natural β‐carotene producers [28]. In this study, although the highest WGR and SGR were observed in the 2.00% group, the lack of significant differences among treatments suggests that D. salina may not function primarily as a direct growth promoter. This aligns with findings in P. monodon [19], where β‐carotene supplementation improved health and pigmentation without consistently enhancing growth. The significant decline in growth performance in the D0.34 group, coupled with a markedly higher GSI compared to D0, D1.34, and D2.00 groups, suggests that 0.34% D. salina powder (48.01 mg kg^−1^ dry diet) significantly enhances ovarian development in red swamp crayfish, consistent with findings in red claw crayfish C. quadricarinatus [29]. We propose two nonexclusive mechanisms to explain this phenomenon: First, β‐carotene may directly protect oocytes from oxidative damage [30]. In crustaceans, both β‐carotene and astaxanthin steadily increase during ovarian maturation [31]. Deficiencies in carotenoids and retinol may lead to reduced reproductive capacity [32]. Second, within crustaceans, β‐carotene can be cleaved into retinal by β‐carotene oxygenase 1. Retinal is then reduced to retinol (vitamin A) by retinaldehyde reductase [33], a classic promoter of ovarian development in crustaceans [34, 35]. Recent studies indicate that vitamin A can promote vitellogenesis and subsequently advance ovarian development in P. clarkii by upregulating the mRNA expression of Vg and activating the ECR/RXR signaling pathway, while insufficient or excessive supplementation impedes ovarian maturation [36]. Higher D. salina inclusion levels reduced the stimulatory effect on gonad development, and more energy appeared to be allocated toward somatic growth, as evidenced by WGR.
D. salina has been demonstrated to play a significant role in promoting ovarian development and improving production performance in animals [21, 37]. The limited efficacy of high‐dose D. salina powder in promoting sustained ovarian development may be attributed to two potential mechanisms, though these require further validation. First, an appropriate amount of β‐carotene can be converted to astaxanthin, which is known to promote ovarian development [38, 39]. However, excessive intake may exceed metabolic capacity, and the accumulation of unused astaxanthin in the ovaries could potentially induce oxidative stress [3], thereby inhibiting the maturation process. Second, β‐carotene is metabolized to retinol [40]. An appropriate level of vitamin A promotes ovarian and reproductive development in crustaceans [41, 42], but excess may trigger lipid peroxidation, leading to increased MDA concentrations and hindering vitellogenin deposition [43]. Additionally, hepatopancreatic digestive enzyme activities increased initially and then declined with higher D. salina inclusion, peaking in the D0.34 group. These enzymatic changes correlated with elevated GSI, suggesting that 0.34% D. salina powder enhanced ovarian development by stimulating digestive enzyme activity, improving nutrient absorption, and activating retinol metabolism. This study reveals the potential promoting effect of low‐dose D. salina powder supplementation on ovarian development in P. clarkii, although the mechanisms involved remain hypothetical. Future studies employing transcriptomic or metabolomic approaches are necessary to directly track the metabolism of dietary β‐carotene from D. salina in red swamp crayfish, quantify intermediate products such as retinal and retinol, and elucidate the expression of key genes involved in carotenoid cleavage and retinoid signaling pathways.
4.2. Nonspecific Immunity, Antioxidant Status, and Air Exposure Stress Tolerance
In recent years, the declining immune performance of red swamp crayfish has increased their susceptibility to stress‐induced mortality, threatening the sustainability of the crayfish industry [44]. Algae, known for their rich content of bioactive compounds, play a crucial role in promoting animal health and immunity [45]. D. salina can be used as an immunostimulant, significantly improving the immune function of crustaceans. This effect has been experimentally confirmed in the shrimp P. monodon [46] and L. vannamei [47]. In this study, crayfish fed with a diet supplemented with 1.34% D. salina powder exhibited a significant increase in AKP activity in the hepatopancreas and ACP activity in the hemolymph, indicating enhanced immune status. Moreover, dietary β‐carotene derived from D. salina represents a practical strategy for improving AOC of aquatic animals [18], consistent with findings in the crab E. sinensis [17]. In this experiment, the addition of 0.67% D. salina powder resulted in a significant increase in T‐SOD activity and T‐AOC, coupled with markedly reduced hepatopancreatic and hemolymph MDA levels. However, excessive supplementation (1.34% and 2.00%) decreased T‐AOC in the hepatopancreas and an increased MDA in the hemolymph. Moderate supplementation with D. salina powder significantly enhanced AOC, primarily attributed to the activation of the antioxidant defense system by antioxidant components such as β‐carotene [17]. However, excessive intake of β‐carotene may inhibit the synthesis or activity of antioxidant enzymes. This could be due to sufficient antioxidant accumulation, leading to a feedback mechanism that downregulates endogenous antioxidant enzyme activity to maintain redox balance [48]. Alternatively, high‐dose supplementation may increase metabolic burden, thereby reducing antioxidant activity and immune function [22]. Therefore, appropriate supplementation with D. salina can significantly improve the immune function and AOC of red swamp crayfish, while excessive supplementation may diminish these benefits.
It is noteworthy that the limited tolerance of red swamp crayfish to transportation poses a significant constraint on the cross‐regional transfer of breeding stock and commercial market sales, hindering the sustainable expansion of crayfish farming. MDA serves as an indicator to evaluate the recovery from air exposure stress of red swamp crayfish [49]. In this study, the dietary supplementation of 2.00% D. salina powder significantly reduced MDA content in hepatopancreas and muscle tissues, an indication that oxidative stress imposed by air exposure was alleviated. Furthermore, muscle from the D2.00 group displayed substantially lower LD content and the highest SDH activity, reinforcing the conclusion that 2.00% D. salina supplementation can significantly enhance the air exposure tolerance and transportation resilience of crayfish. The intake of a high dosage of D. salina (2%) promoted greater deposition of carotenoids in the tissues, particularly astaxanthin in the carapaces and lutein/zeaxanthin in the ovaries (Figure 6), during stress (such as air exposure), the system may not rely solely on the endogenous antioxidant enzyme system. Instead, the antioxidants stored in the tissues may directly neutralize ROS, manifesting as higher stress tolerance. As reported in relevant studies on crustaceans, pigment accumulation may serve as a protective mechanism against adverse environmental conditions [50].
4.3. Correlation Between Carotenoid Content and Pigmentation Parameters, as Well as Physiological Indicators
Carotenoids from D. salina, which are known for high bioavailability, were effectively absorbed and utilized by red swamp crayfish, as evidenced by strong correlations between dietary levels and tissue accumulation in the carapaces and ovaries. The current result was consistent with the established pattern of carotenoid deposition observed in crustaceans [51, 52]. Among them, astaxanthin in the carapaces, lutein, and zeaxanthin in the ovaries all showed a linear accumulation trend in relation to dietary D. salina supplementation, while lutein in the carapaces and β‐carotene in the ovaries demonstrated a quadratic relationship, suggesting that there is a certain deposition threshold for carotenoids in the crayfish tissues. The dynamic changes in ovarian β‐carotene levels may explain the limited sustained promotion of ovarian development by D. salina supplementation. Crustacean pigmentation is closely linked to the absorption, transport, and metabolic transformation of carotenoids [53]. Dietary D. salina supplementation significantly increased the a ^∗^ value of the carapaces while decreasing the L ^∗^ and b ^∗^ values, indicating enhanced the external coloration driven by β‐carotene, likely via its metabolic conversion to astaxanthin. In this study, the a ^∗^, L ^∗^, and b ^∗^ color parameters of the carapaces correlated significantly with the total carotenoid content, consistent with findings in E. sinensis [54] and Macrobrachium rosenbergii [55]. Previous researches have shown that in the crab E. sinensis, the ovarian a ^∗^ value was positively correlated with astaxanthin content, whereas the L ^∗^ and b ^∗^ values declined linearly with rising astaxanthin and β‐carotene [56, 57]. Similarly, the ovarian L ^∗^ value also dropped sharply as astaxanthin increased. These results indicate that D. salina powder, when used as a feed additive for crayfish, has the potential to modulated carotenoid metabolism and thereby enhance marketable coloration cost‐effectively and sustainably.
Our findings corroborate the paradigm that optimal pigmentation is not merely a cosmetic trait but a tangible indicator of physiological health in farmed crustaceans [58]. The strong correlations between tissue carotenoid levels and key immune and antioxidant parameters (Figures 8 and 9) provide direct evidence for this link. This is attributed to the essential roles that carotenoids play in modulating the immune responses and antioxidant defense mechanisms [59]. In this study, hemolymph ACP activity tightly tracked carapace lutein and zeaxanthin contents, consistent with the positive relationship between carotenoid concentration and proPO system activity in Gammarus pulex [60]. Furthermore, T‐SOD activity in the hemolymph was significantly positively correlated with total carotenoids in the carapaces, β‐carotene in the muscles, and total carotenoids, astaxanthin, and β‐carotene in the ovaries. Similarly, Wei et al. [61] reported blue‐strain red‐claw crayfish, containing less astaxanthin and β‐carotene, displayed diminished SOD activity under high‐temperature stress relative to blue–green strain crayfish. These findings strongly suggest that carotenoids play a specific and significant role in augmenting the SOD‐mediated antioxidant defense system [62]. The precise pathways through which carotenoids modulate SOD activity; however, remain to be elucidated and represent a promising avenue for future research. In summary, the strong correlations between tissue carotenoid accumulation and key immune and antioxidant parameters indicate a close relationship between pigmentation and health status. Regression optimization pinpointed 1.23%–1.53% dietary D. salina as the range maximizing carapace total carotenoids and lutein, as well as ovarian total carotenoids and β‐carotene, significantly enhancing immune function and AOC of the crayfish, suggesting an optimal health condition. Furthermore, linear accumulation of pigments related to respiratory metabolic indicators demonstrated that the strongest resistance to air exposure was achieved at a D. salina supplementation level of 2.00%.
4.4. Industrial Implications
Natural astaxanthin is characterized by its high bioactivity but also high cost, which has driven extensive research focus toward the more cost‐effective synthetic astaxanthin [63]. Recent studies suggest that synthetic β‐carotene holds potential as a substitute for synthetic astaxanthin in some aquatic species. For instance, in L. vannamei, dietary supplementation with synthetic β‐carotene can achieve production performance comparable to that of synthetic astaxanthin [4]. In P. monodon, both also yield similar growth‐promoting effects [19]. Compared to synthetic β‐carotene, D. salina powder, as a premium natural source, is superior due to the comprehensive health benefits observed in this study, including enhanced growth, ovarian development, and improved stress resistance. Although this study did not include a direct comparison with synthetic pigments, the data indicate that D. salina‐derived β‐carotene can be efficiently converted to astaxanthin in crayfish tissues (Table 4), supporting its potential as an effective precursor from a metabolic perspective. More importantly, D. salina is a renewable and sustainable biological resource with relatively simple cultivation requirements, making it promising for commercial‐scale production.
This study provides guidance for the application of D. salina in crustacean aquaculture. First, we systematically quantified, for the first time, the dose–response relationship between D. salina supplementation and carotenoid deposition in the carapaces and ovaries of red swamp crayfish, establishing a precise optimal inclusion range (1.23%–1.53%) for improving coloration and health status. Second, this study revealed that a low dosage (0.34%) significantly promotes ovarian development, while higher dosages favor somatic growth. Notably, we are the first to demonstrate that D. salina can significantly enhance the tolerance of crayfish to air‐exposure stress. These findings offer practical and actionable strategies to support the transition of the crayfish industry toward high‐quality and sustainable production. A precision nutrition strategy based on natural and sustainable microalgal resources holds promise for enhancing the overall profitability of the red swamp crayfish farming industry.
5. Conclusion
This study shows that dietary D. salina powder provides dose‐dependent and multifaceted benefits in juvenile red swamp crayfish. Regression analysis identified an optimal inclusion range of 1.23%–1.53% for the concurrent enhancement of carotenoid deposition, immune function, and AOC, representing a holistic approach to improving crayfish health and market traits. Beyond this core optimum, specific inclusion levels were found to target distinct physiological outcomes: a lower dose of 0.34% preferentially stimulated ovarian development, whereas a higher dose of 2.00% maximized resilience to air exposure stress. Consequently, the strategic application of D. salina in functional feed formulations can be precisely calibrated to farming priorities, whether for superior product coloration, broodstock development, or transport survival. These data‐driven insights facilitate a strategic shift from quantity‐focused to quality‐ and value‐driven aquaculture practices, underpinning the sustainable and profitable development of the crayfish industry.
Acknowledgments
The authors affirm that no AI tools were employed in the composition of this manuscript.
Funding
This work was supported by the Special Fund of the Chinese Agriculture Research System from the Ministry of Agriculture of China (Grant CARS‐48), the key project of the NSFC‐Shandong Province Joint Fund from the Natural Science Foundation of China (Grant U1706209), and the Key R&D Program from the Ministry of Agriculture and Rural Affairs of China (Grant 2023YFD2402000).
Disclosure
All contributors have examined the final draft and consented to its submission for publication.
Ethics Statement
All experimental procedures were approved by the Shanghai Ocean University Animal Ethics Committee.
Conflicts of Interest
The authors declare no conflicts of interest.
The reference list from the paper itself. Each links out to its DOI / PubMed record.
- 1Bureau of Fisheries and Management , China Fisheries Statistical Yearbook (2025), 2025, China Agriculture Press.
- 2China Fish , Development Report of Crayfish Industry in China, 2025, 2025, 7, National Fisheries Technology Extension Center, 10–16, (in Chinese).
- 3Zhang Y. , Qian C. , and Huang J. , et al.Suitable Natural Astaxanthin Supplementation With Haematococcus pluvialis Improves the Physiological Function and Stress Response to Air Exposure of Juvenile Red Swamp Crayfish (Procambarus clarkii), Aquaculture. (2023) 573, 10.1016/j.aquaculture.2023.739577, 739577. · doi ↗
- 4Fawzy S. , Wang W. L. , and Zhou Y. , et al.Can Dietary β-Carotene Supplementation Provide an Alternative to Astaxanthin on the Performance of Growth, Pigmentation, Biochemical, and Immuno-Physiological Parameters of Litopenaeus vannamei ?, Aquaculture Reports. (2022) 23, 10.1016/j.aqrep.2022.101054, 101054. · doi ↗
- 5Jiang X. , Zhu S. , Zhang G. , Gong Y. , and Wu X. , Effect of Dietary β-Carotene Supplementation on Growth and Antioxidant Capability of Pre–Adult Male Chinese Mitten Crab, Eriocheir sinensis , Aquaculture Reports. (2024) 35, 10.1016/j.aqrep.2024.101968, 101968. · doi ↗
- 6Ma T. , He J. , Jiang X. , and Hu Q. , Effect of Dietary β-Carotene Supplementation on Growth and Antioxidant Capability of Female Swimming Crab Portunus trituberculatus , Journal of the World Aquaculture Society. (2024) 55, no. 4, 10.1111/jwas.13073. · doi ↗
- 7Xue Y. , Wang Z. , Liu M. , Yi G. , Huang X. , and Wang W. , From Indicator Evaluation to Optimization Decision: Effects of Synthetic vs. Natural Astaxanthin on Pigmentation, Growth, and Health in Penaeus vannamei , Aquaculture. (2025) 609, 10.1016/j.aquaculture.2025.742782, 742782. · doi ↗
- 8Abdel-Latif H. M. R. , El-Ashram S. , and Sayed A. E.-D. H. , et al.Elucidating the Ameliorative Effects of the Cyanobacterium Spirulina (Arthrospira platensis) and Several Microalgal Species Against the Negative Impacts of Contaminants in Freshwater Fish: A Review, Aquaculture. (2022) 554, 10.1016/j.aquaculture.2022.738155, 738155. · doi ↗