Computed tomography−based prediction of commissural positions facilitates valve-sparing aortic root replacement
Haruo Yamauchi, Masahiko Ando, Kenji Ino, Hiroyuki Tsukihara, Gakuto Aoyama, Ichiro Sakuma, Minoru Ono

TL;DR
Using CT scans and deep learning to plan aortic root surgery improves accuracy and reduces intraoperative adjustments compared to traditional methods.
Contribution
A deep-learning algorithm accurately predicts commissural positions for valve-sparing aortic root replacement using CT scans.
Findings
CT-based planning reduced aortic crossclamp time and intraoperative adjustments compared to conventional methods.
Algorithm-based CT measurements showed excellent agreement with expert measurements for key surgical parameters.
CT planning led to fewer cusp repairs and more accurate commissural positioning during surgery.
Abstract
This study aimed to compare aortic root reimplantation planning using computed tomography (CT) with conventional methods and to assess the accuracy of automated CT measurements using a deep-learning algorithm. Twenty patients underwent David reimplantation at our hospital with CT-based planning to determine graft sizes from virtual basal ring dimensions and predict commissural positions using electrocardiogram-gated CT. In the controls (n = 20), preoperative transesophageal echocardiography determined virtual basal ring sizing, whereas surgeons intraoperatively assessed commissural positions. We also analyzed correlations between CT measurements obtained manually by experts and automatically by our deep-learning-based algorithm using 50 cases indicated for David reimplantation. The CT group had a shorter aortic crossclamp time (P = .001). Horizontal shifting of commissures (80% vs…
Genes, proteins, chemicals, diseases, species, mutations and cell lines named across the full text — each resolved to its canonical identifier and authoritative record.
Click any figure to enlarge with its caption.
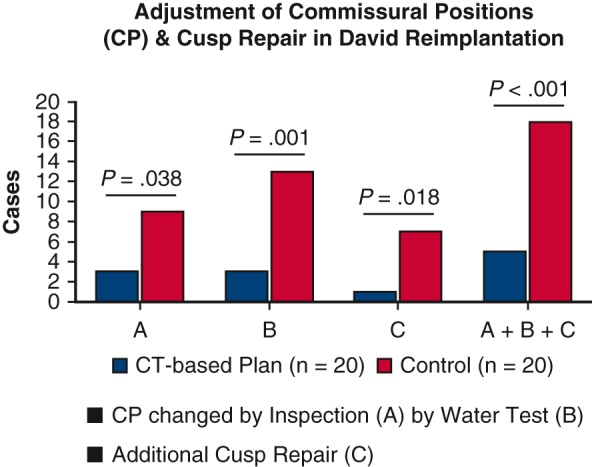 Figure 1
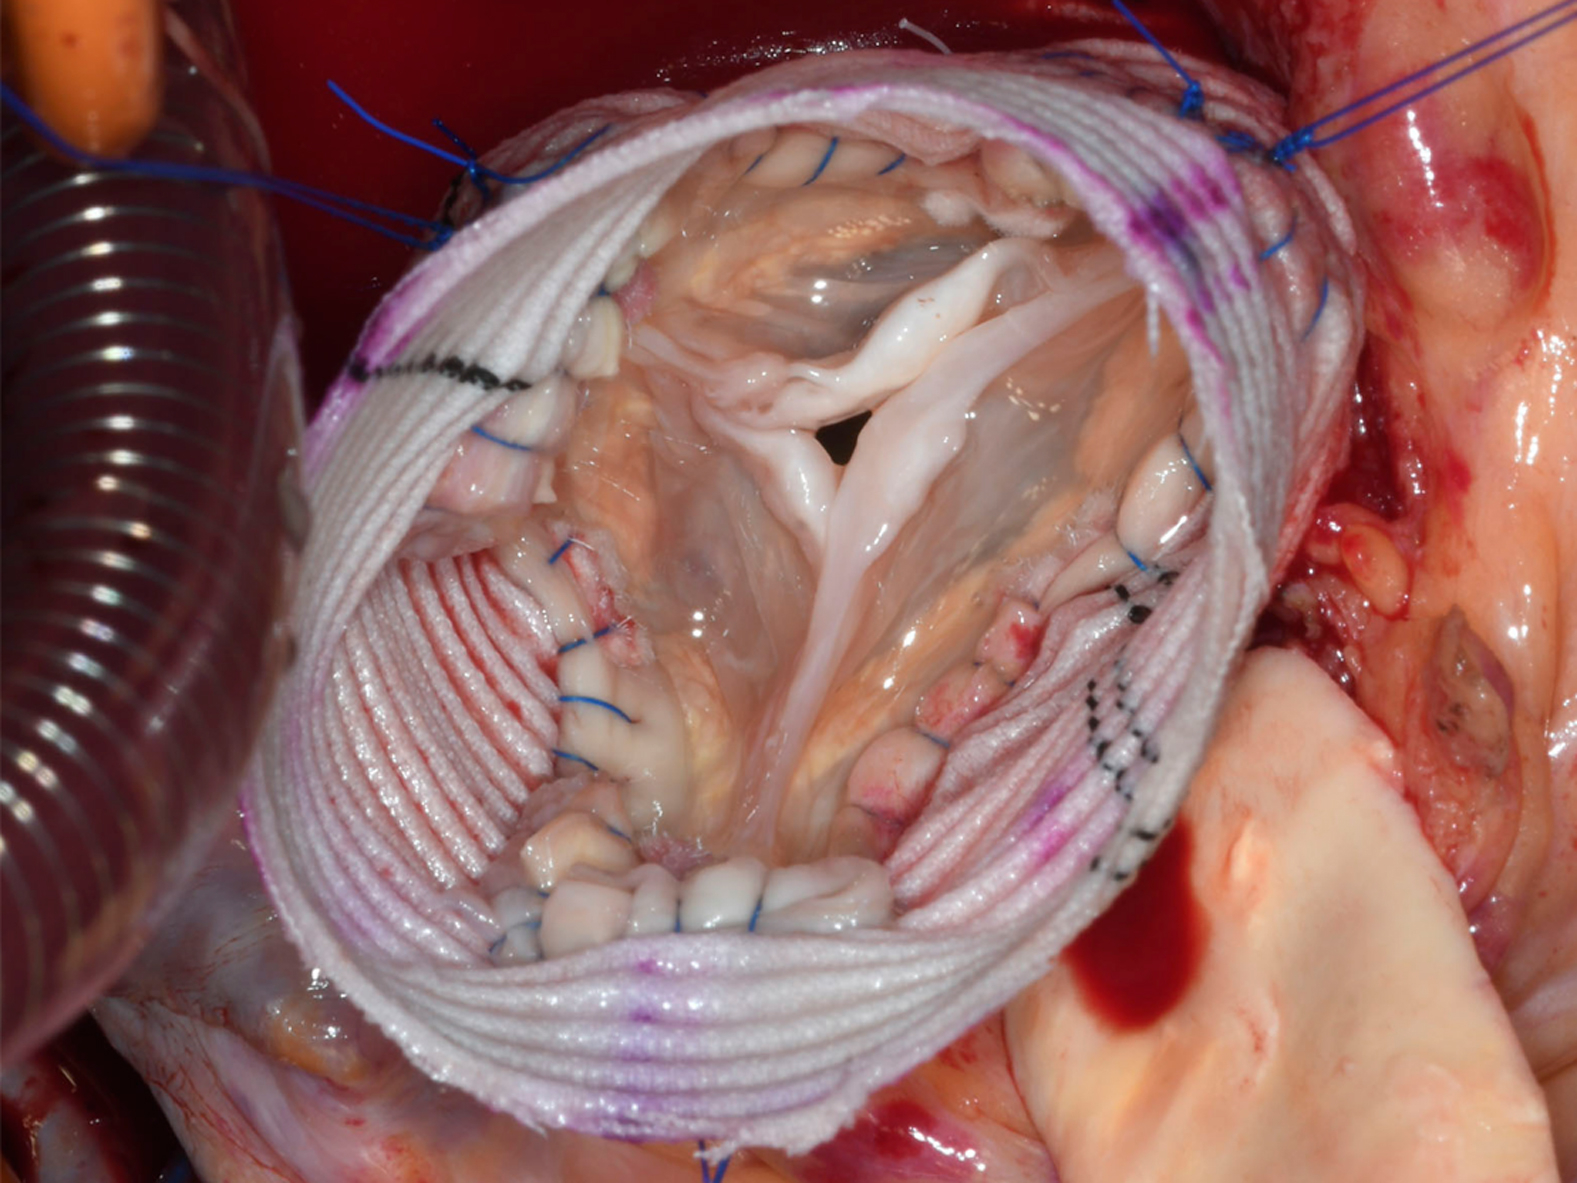 Figure 2
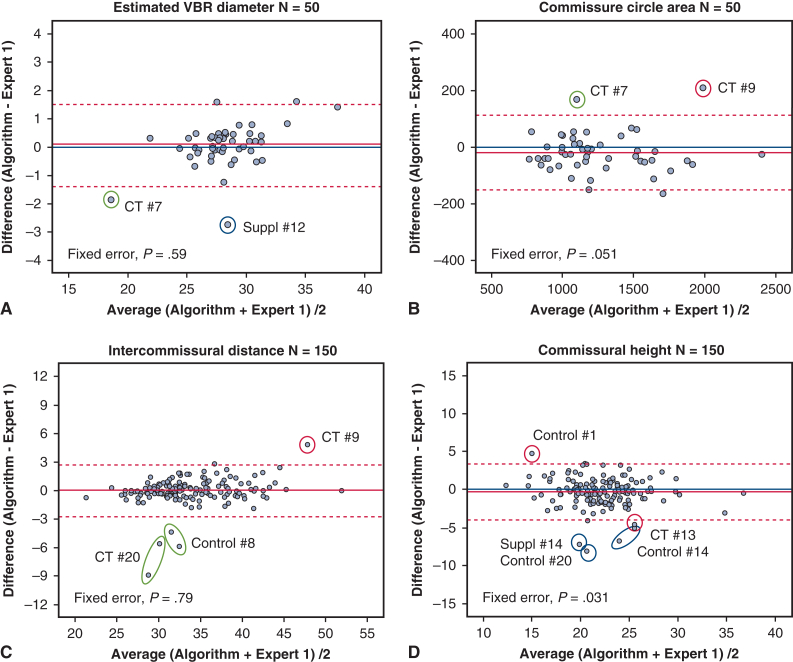 Figure 3
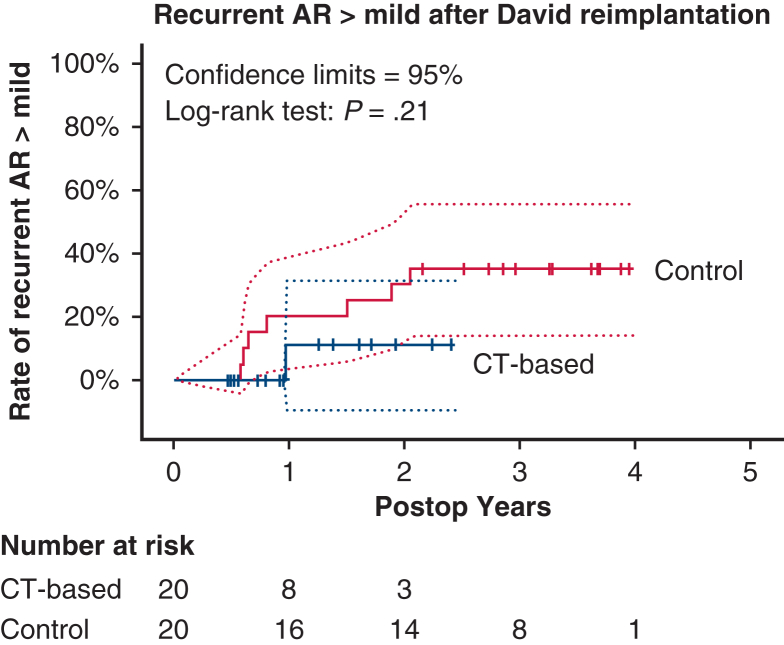 Figure 4
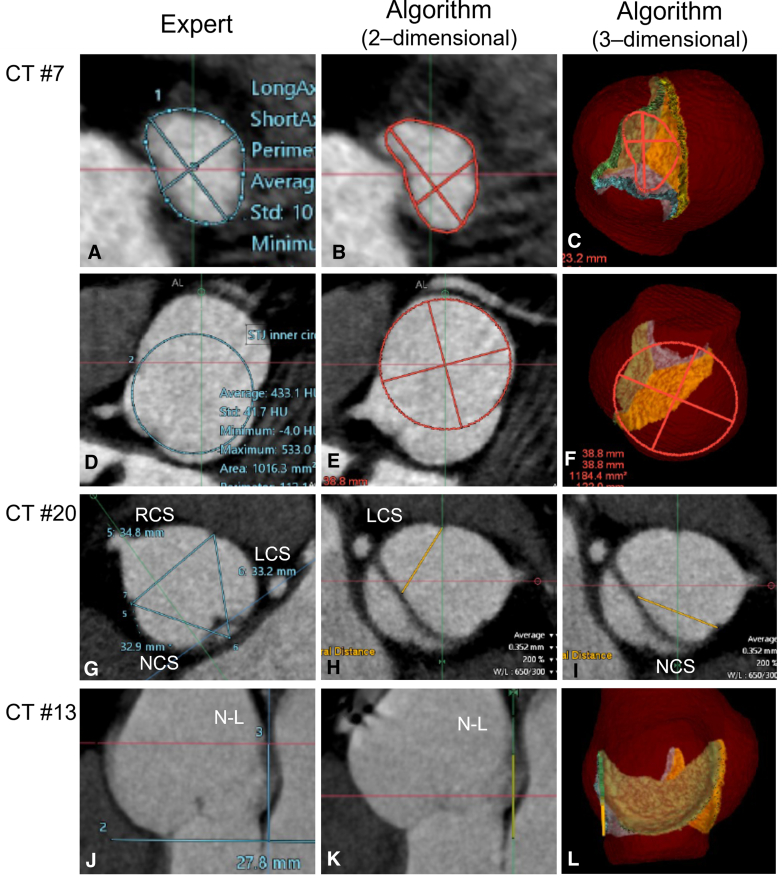 Figure 5
 Figure 6
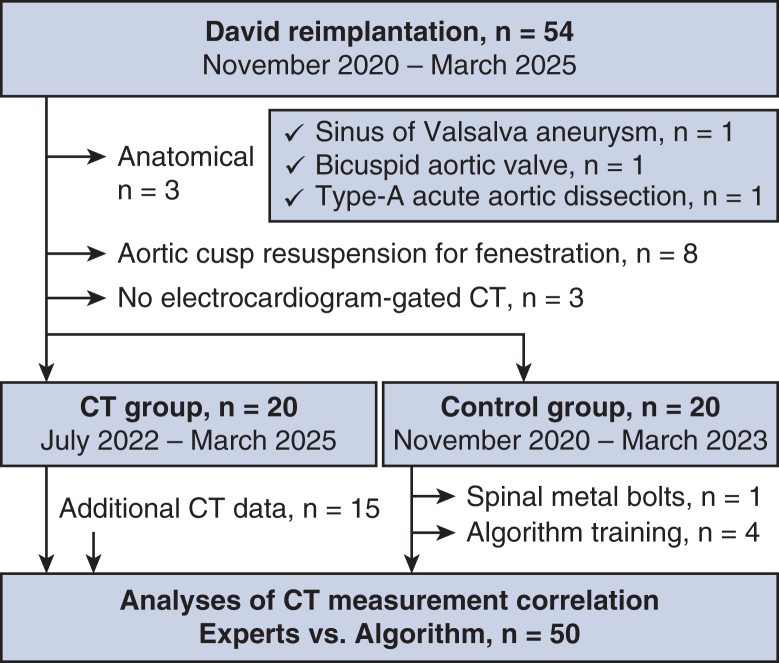 Figure 7
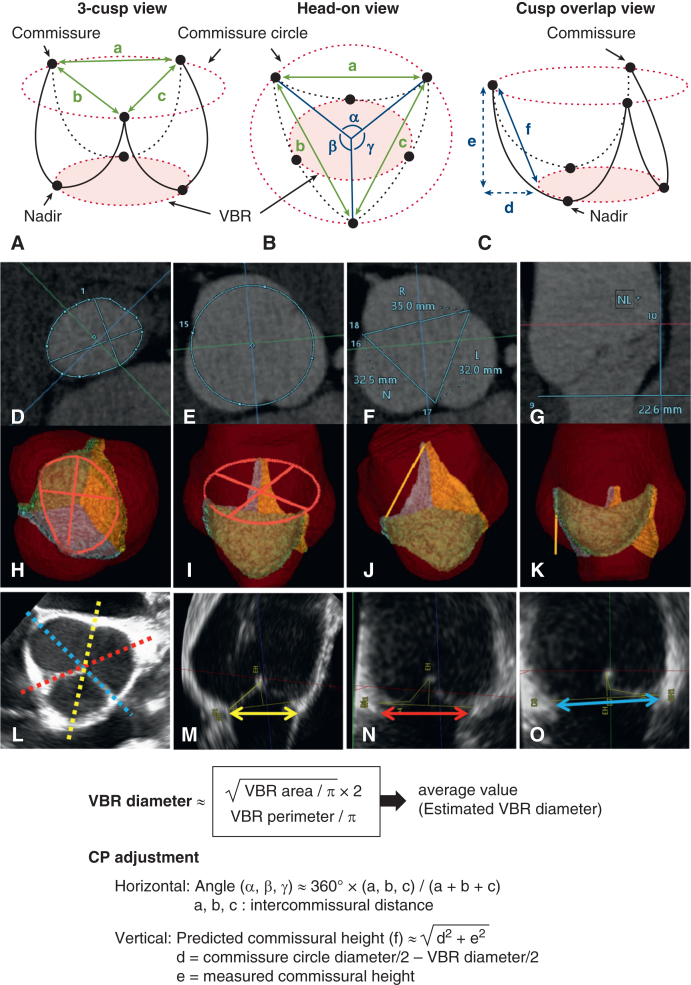 Figure 8
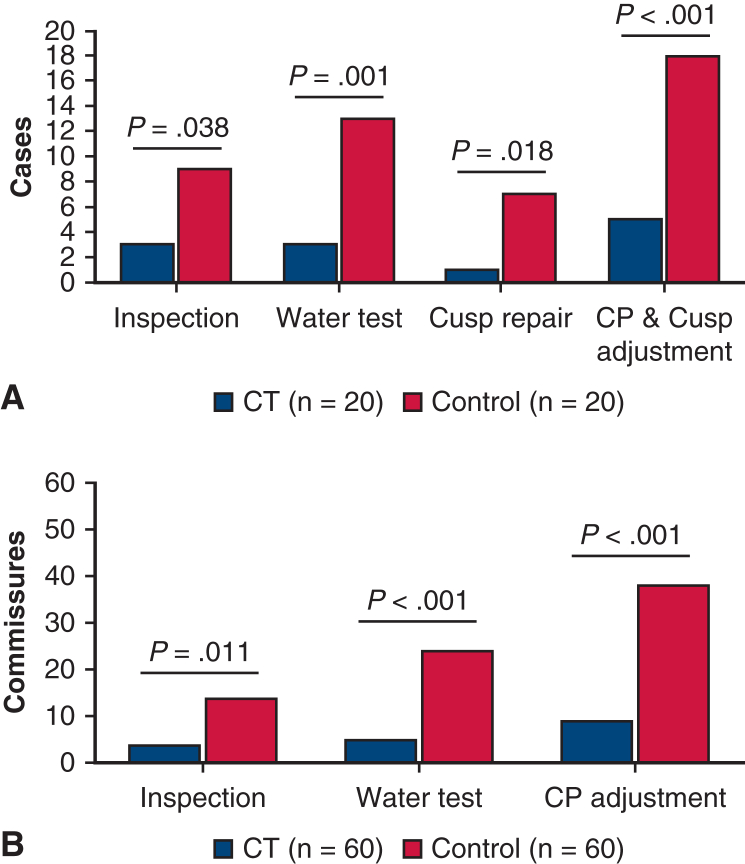 Figure 9
Peer Reviews
No public reviews on file for this paper yet. If you reviewed it on a platform where reviews are public (OpenReview, ICLR, NeurIPS, ICML), you can paste yours below so the community can read it here.
Videos
No videos yet. Explain this paper in a talk, walkthrough, or lecture? Add one.
Taxonomy
TopicsAortic Disease and Treatment Approaches · Cardiac Valve Diseases and Treatments · Congenital Heart Disease Studies
Predicting commissural positions by computed tomography facilitates David reimplantation. Central MessagePredicted commissural positions (CP) by computed tomography (CT) simplify David reimplantation by reducing the CP adjustment and cusp repair. Our deep learning−based algorithm helps CT-based planning. PerspectiveComputed tomography (CT)-based prediction of virtual basal ring sizes and commissural positions (CP) facilitates David reimplantation more effectively than conventional methods. The CT-based planning reduced the need for CP adjustment and additional cusp repair, leading to shortened cardiac arrest times. Our deep learning−based algorithm demonstrated excellent correlations with expert measurements.
Valve-sparing root replacement (VSRR) is becoming the standard option for aortic root dilatation, with evidence of favorable long-term outcomes in high-volume centers.1^,^2 Successful VSRR requires a thorough understanding of root anatomy, including the virtual basal ring (VBR), the sinus of Valsalva (SOV), and the sinotubular junction (STJ).
High-resolution computed tomography (CT) has been used for aortic root assessment3, 4, 5, 6 and revealed disproportionate normal aortic valves with larger noncoronary sinuses and greater commissural heights (CHs) between the right and noncoronary sinuses than the others. The dimensions of aortic cusps, such as the geometric height (gH), correlate with the root sizes.4 Restoration of the VBR and commissural positions (CPs) that preserve the intercusp dimensional relationship is a complex but necessary process for VSRR. If the effective heights (eHs) of the cusps are insufficient as a result of prolapse, cusp repairs are necessary. However, a recent study reported that additional cusp repair adversely impacts the recurrent aortic regurgitation (AR) after VSRR.7 Therefore, durable VSRR depends on the experience of the surgeon and the institution.2^,^8
Standardized operative techniques with a CT-based objective aortic valve assessment are beneficial, although few studies have reported on the clinical outcomes of this approach.6 One of the most technically demanding elements of VSRR is the intraoperative determination of CPs. Our group recently started using electrocardiogram-gated CT images for measuring VBR and CPs in VSRR (David reimplantation) planning. To facilitate this, we developed a deep learning−based algorithm for fully automated aortic valve and root measurement.9^,^10
This study had a dual purpose. First, we aimed to compare patient outcomes after CT-based planning of David reimplantation with those of controls after conventional strategies, which included preoperative transesophageal echocardiographic (TEE) measurement of VBR and the surgeon's intraoperative judgment to determine CPs. Second, we aimed to compare our algorithm's automated CT measurements with the experts' manual measurements for exploring the potential role of artificial intelligence in surgical planning.
Methods
Data Collection
This was a retrospective observational study. Figure 1 shows the participant eligibility criteria. In total, 54 consecutive patients who underwent David reimplantation at our institution between November 2020 and March 2025 were reviewed. Of these, 14 were excluded as the result of anatomical variations (n = 3), aortic cusp fenestration necessitating preventive leaflet resuspension (n = 8), or no available electrocardiogram-gated CT data (n = 3). Twenty patients underwent David reimplantation between July 2022 and March 2025 after CT-based planning. The remaining 20 patients formed the control group. One patient diagnosed with chronic type A dissection was included in each group (Table 1). This study was conducted in accordance with the tenets of the 1964 Declaration of Helsinki and its later revisions. It was approved by the Research Ethics Committee of the Faculty of Medicine, The University of Tokyo, on January 27, 2017 (approval no. 11330). The requirement for written informed consent from participants was waived by the institutional review board because patient data were retrospectively collected and anonymized, and de-identified before use.Figure 1. Study eligibility criteria. CT, Computed tomography.Table 1. Demographics and preoperative echocardiography dataDemographicsCT groupControl groupP value(n = 20)(n = 20)Age, y39.1 ± 16.028.4 ± 10.7.019∗male, n (%)16 (80%)12 (60%).17Body surface area, m21.8 ± 0.21.8 ± 0.3.72Connective tissue disease, n (%)18 (90%)17 (85%).63History of cardiac surgery, n (%)1 (5%)2 (10%).55 Mitral valve repair12Indication for root replacement, n (%)1.00 Annuloaortic ectasia19 (95%)19 (95%) Chronic type A aortic dissection1 (5%)1 (5%)TTE**(n = 20)(n = 20)LV dimension in diastole, mm50.5 ± 6.550.7 ± 5.3.94Ejection fraction, %61.8 ± 6.864.3 ± 8.3.31Aortic valve peak velocity, m/s1.1 ± 0.31.0 ± 0.2.81Aortic regurgitation.28 No-trivial, n (%)11 (55%)13 (65%) Mild, n (%)5 (25%)1 (5%) Moderate, n (%)3 (15%)3 (15%) Severe, n (%)1 (5%)3 (15%)VBR diameter, mm24.6 ± 3.325.9 ± 3.5.28SOV diameter, mm48.6 ± 8.442.9 ± 3.8.010∗TEE(n = 14)(n = 20)**VBR diameter, mm28.2 ± 3.528.3 ± 3.9.92SOV diameter, mm Left coronary sinus44.9 ± 6.143.9 ± 6.4.66 Right coronary sinus46.5 ± 6.243.1 ± 5.7.12 Noncoronary sinus45.1 ± 5.744.7 ± 6.3.86Data are shown as mean ± standard deviation. CT, Computed tomography; TTE, transthoracic echocardiography; LV, left ventricle; VBR, virtual basal ring; SOV, sinus of valsalva; TEE, transesophageal echocardiography.∗P < .05 was considered statistically significant.
Echocardiographic Evaluation
Transthoracic echocardiography (TTE) was evaluated for general cardiac functions. David reimplantation was considered if the aortic cusps had minimal deformity and the SOV exceeded 40 to 45 mm in patients with connective tissue diseases and 55 mm in those without, according to Japan Circulation Society guideline issued in 2020.11 Preoperative TEE was evaluated if tolerated by the patient, and multiplanar resection images of the aortic root in the end-diastolic phase were obtained from volume datasets and the average VBR diameters were measured from the nadirs of the left, right, and noncoronary cusps, to the opposite VBR wall beneath the commissures (Figure 2, L-O).12^,^13 Intraoperative TEE was examined to assess the AR grade. Postoperative TTE was examined before discharge and followed up at outpatient clinics.Figure 2. Preoperative aortic root/valve measurement parameters. Schematic drawings of the aortic root structures are shown as a 3-cusp view (A); a head-on view (B); and a cusp overlap view (C). VBR areas are depicted in pink. The ICDs are shown as bidirectional green solid lines (a-c). Angles α, β, and γ were approximated from the ICDs a-c. The predicted CH (f) (bidirectional blue solid arrows) was calculated from dimensions d and e (bidirectional blue dotted arrows) using the Pythagorean theorem. For the CT analyses, the aortic root structure is visualized in 2-dimensional images with measurement parameters (D-G) and 3-dimensional images by the algorithm (H-K), showing the VBR (D and H), CCA (E and I), ICD (F and J), and CH (G and K) in blue, red, and orange lines. For the TEE analysis, the VBR diameters in 3 directions between their nadirs and the opposite commissure sides are shown as bidirectional yellow, red, and blue arrows (L-O). The formulas used to calculate each parameter are shown in the lower panel. VBR, Virtual basal ring; ICD, intercommissural distances; CH, commissural heights; CT, computed tomography; CCA, commissure circle area; TEE, transesophageal echocardiography.
Preoperative CT Measurements
Most CT images were acquired using contrast medium and the Aquilion ONE (Canon Medical Systems Corp) device, as previously described.10 The CT data for the end-diastolic phase (80% of a cardiac cycle) were imported into the image-processing system (Vitrea; Canon Medical Informatics, Inc). Manual measurements of the aortic roots and cusps were taken to assess the VBR, gHs, and eHs, as reported.10 The ellipticity index values were calculated using the major and minor VBR diameters as follows: ellipticity index = major diameter/minor diameter.14 The commissure circle area (CCA) was defined as the area of the circle on the 3 commissures (at the top of the inter-leaflet triangles). Intercommissural distances (ICDs) were measured between the commissures. The CH was the length of a perpendicular line between the VBR plane and the commissures (Figure 2).
Automated Measurement of the Aortic Root Using CT Data
We have previously developed a deep learning−based algorithm for fully automated aortic cusp segmentation from CT images. This was achieved by combining spatial configuration-Net for detecting anatomical landmarks and U-Net for the segmentation of aortic valve components.9 The combined processes were trained using 258 CT volumes. We then retrained the algorithm for use with segmenting dilated roots using 67 CT volumes. There was a moderate-to-high correlation between the measurements of the algorithm and the experts, with differences of 13.4 mm^2^ for the VBR area, 2.6 mm for SOV diameter, 0.5 mm for gH, and 0.9 mm for eH.10 This algorithm was installed on the Vitrea workstation. Of the 40 cases in our cohort, 1 patient was excluded from the control group because of spinal metal bolts that interfered with automated root detection, and 4 were excluded because their CT data were used to train the algorithm. CT volumes were added from 15 patients who underwent VSRR after February 2016, resulting in 50 patients in the algorithm measurement group (Figure 1). The VBR, CCA, ICD, and CH were measured using the algorithm and compared with the manual measurements taken by 3 experts. This included 2 cardiac surgeons (expert 1, HY; and expert 2, MA) and 1 radiology technician (expert 3, KI) who had 9, 5, and 7 years of experience in cardiac CT data analyses, respectively. Expert 1 measured all 50 cases. Experts 2 and 3 each took measurements for 17 randomly selected cases.
Estimation of the VBR Diameter and CP From the CT Data
Figure 2 shows the aortic root measurement parameters. The VBR diameters were calculated assuming the VBR was a circle, using the VBR area and perimeter.4^,^5^,^15 If the VBR exceeded 30 mm or the AR grade greater than mild, we planned to reduce the VBR diameter by 2 to 4 mm for securing sufficient cusp coaptation height (cCH),6 which was calculated as follows: cCH = gH – VBR diameter/2. The CPs were measured separately along the horizontal and vertical axes. Horizontally, ICDs along 3 cusps were approximately converted to cusp angles and reflected on the graft, eg, one degree-matched circumference of a 34 mm graft was 0.3 mm. Vertically, the predicted CH was approximately calculated from the measured CH, VBR, and CCA, using the Pythagorean theorem.
Surgical Strategy and Techniques
Our modified techniques of David reimplantation was reported in detail previously16 and is demonstrated in Video 1. For the subvalvular sutures along the VBR line, 10 to 15 mattress 3-0 monofilament pledgeted sutures were applied in all controls and 3 patients in the CT group. In the remaining 17 CT group cases, only 6 sutures were used beneath the 3 nadirs and commissures after experiencing a case with complete atrioventricular block. We used a collagen-impregnated Dacron tube graft (Hemashield Platinum Woven Double Velour; Getinge) 30 to 34 mm in diameter. This was 6 to 8 mm larger than the planned VBR size. There are 3 reasons for our use of large-sized straight graft. These are, first, to facilitate good visualization and management of the reimplanted root structures; second, to allow free determination of the CPs in the graft; and third, to maintain vortex blood flow within the reconstructed neo-sinuses. The graft bottom was plicated to the planned VBR diameter +4 mm, considering the aortic wall width. Subvalvular VBR sutures were fixed to the graft bottom. Next, 3 commissures were temporarily attached to the graft using pledgeted sutures under the surgeon's inspection and pulled apart. This graft fabric formed ringed crimps, with the width of each one crimp being approximately 1.5 mm. This was used to estimate CHs above the VBR level. In the CT group, the CP sutures were positioned with reference to predicted CT values. In the controls, the CP sutures were flexibly aligned depending on the patients' CPs and cusp sizes, with a default height of around 25 mm and spaced horizontally at 120° intervals. Then, by the water test, if one cusp looked prolapsed, its bilateral commissures were pulled further up or apart to raise the cusp's free margin and/or the opposing CH was lowered. For remarkable cusp elongation, additional cusp repair, predominantly central plication, was applied. The graft distal portions were vertically plicated between the commissures, from the commissure level to the graft distal end, to reduce the STJ diameter matching the VBR.
Statistical Analysis
Continuous data are presented as means and standard deviations unless otherwise mentioned and were analyzed using unpaired t tests. Categorical data are presented as numbers and percentages and were compared using χ^2^ tests. The disproportionate ratios for the 3 measurements of the ICDs and CHs were calculated as follows: disproportionate ratio (%) = (maximal value − minimal value)/minimal value × 100. For comparisons between the algorithm's and the experts' measurements, absolute errors (AEs) and error rates were defined10 and shown as means and standard errors. The correlation between the 2 measurements was analyzed using the intraclass correlation coefficient (ICC) and 95% confidence interval. Bland-Altman difference plots with limits of agreement17 are shown in Figure E1. The fixed errors between the measurements were analyzed.10 Kaplan-Meier curves for recurrent AR greater than mild after David reimplantation in the CT and control groups are shown in Figure E2 and were compared using the log-rank test. SPSS for Windows, version 21 (IBM Corp) software was used for all statistical analyses.
Results
Demographics and Preoperative Echocardiography and CT Evaluation
Table 1 shows the demographic and echocardiographic data of the cohort. The mean age of the CT group was greater than that of the controls (P = .019). The majority of patients were diagnosed with connective tissue diseases (mostly Marfan syndrome). Preoperative TTE showed AR greater than mild in 20% to 30% of cases. The mean SOV diameter was larger in the CT group (P = .010). Table 2 shows the preoperative CT measurements. The estimated VBR diameters were similar between the groups. However, the CT group included a greater proportion of patients with an oval-shaped VBR (ellipticity index >1.2) than the controls (70% vs 45%, P = .11). The CT group showed a tendency to larger SOVs and ICDs, and parts of the CHs and eHs were significantly greater than those of the controls. The disproportionate ratios of the ICDs were larger in the CT than the controls (P = .085). The cusp angles of the LCC and RCC in the CT group were smaller (P = .050) and larger (P = .091), respectively, than those of the controls. However, the disproportionate ratios of the CHs were similar between the groups (P = .91).Table 2. Preoperative CT measurementsParameterCT group (n = 20)Control group (n = 20)P valueVBR area, mm2615.3 ± 136.7644.5 ± 140.2.51VBR perimeter, mm88.4 ± 10.090.4 ± 9.4.51Estimated VBR diameter, mm28.0 ± 3.228.6 ± 3.0.49Ellipticity index of VBR >1.2, n (%)14 (70%)9 (45%).11SOV diameter, mm Left coronary sinus45.5 ± 5.343.9 ± 4.8.32 Right coronary sinus46.7 ± 6.343.5 ± 5.1.083 Noncoronary sinus46.2 ± 5.943.5 ± 4.6.11 Disproportionate ratio (%)7.8 ± 5.37.0 ± 5.9.68Commissure circle area, mm21330.7 ± 403.31189.2 ± 286.3.21ICD Between N-L and L-R, mm32.0 ± 5.031.5 ± 4.5.75 Between L-R and R-N, mm36.5 ± 5.733.6 ± 3.5.062 Between R-N and N-L, mm34.8 ± 5.032.5 ± 4.3.14 Disproportionate ratio, %17.6 ± 14.711.3 ± 5.9.085Cusp angle, ° LCC111.5 ± 8.2115.9 ± 5.1.050 RCC127.2 ± 6.2124.2 ± 4.7.091 NCC121.4 ± 6.8119.9 ± 5.1.43CH N-L, mm22.6 ± 3.719.9 ± 3.0.017∗ L-R, mm23.0 ± 3.721.8 ± 3.8.29 R-N, mm24.9 ± 4.921.8 ± 4.1.036∗ Disproportionate ratio, %26.1 ± 20.025.4 ± 12.5.91Predicted CH, mm N-L23.7 ± 3.820.7 ± 3.2.012∗ L-R24.1 ± 3.722.5 ± 3.7.20 R-N25.8 ± 5.222.6 ± 3.9.032∗Geometric height, mm LCC18.6 ± 2.819.2 ± 2.1.48 RCC18.0 ± 2.016.9 ± 2.6.14 NCC20.7 ± 2.820.0 ± 2.9.42Effective height, mm LCC12.9 ± 2.511.6 ± 1.9.085 RCC13.4 ± 2.611.5 ± 2.6.029∗ NCC13.3 ± 2.411.5 ± 2.2.019∗CT, Computed tomography; VBR, virtual basal ring; SOV, sinus of valsalva; ICD, intercommissural distance; N-L, commissures between the non and left-coronary sinuses; L-R, commissures between the left and right coronary sinuses; R-N, right and noncoronary sinuses; LCC, left-coronary cusp; RCC, right coronary cusp; NCC, noncoronary cusp; CH, commissural height.∗P < .05 was considered statistically significant.
Operative Outcomes
Table 3 shows the surgical parameters. In the CT group, the aortic crossclamp time was shorter (P = .001), whereas the subvalvular sutures counted fewer (P < .001) than the controls. In the CT group, 16 patients (80%) had horizontal shift at both the commissure and VBR levels, and 19 (95%) had final uneven CHs. In the controls, horizontal CP shifting and uneven CHs occurred in 8 (40%) and 12 (60%) patients, respectively. These incidences were significantly different between the groups (horizontal CP shifting: P = .010; uneven CHs: P = .008). The cCH were similar between the groups (P = .36). Cusp repair was added in 1 patients in the CT group and 7 patients in the control group (P = .018). Figure 3 shows the number of patients and commissures requiring CP adjustments and cusp repair, which were fewer in the CT group (P < .001). Table E1 shows the details of the 5 cases in the CT group necessitating CP adjustments. CHs were adjusted by inspection and water test in 3 and 2 cases, respectively. The case CT #2 also needed cusp repair. In the whole CT group, 6 of the 20 patients had an average SOV >50 mm, and 4 of these required CP adjustments. Of the 14 patients with SOV <50 mm, only 1 patient required CP adjustment (P = .005). There was no case with AR greater than mild in either group after weaning off cardiopulmonary bypass.Table 3. Surgical parameters of David reimplantationParameterCT group (n = 20)Control group (n = 20)P valueOperation time, min397.9 ± 88.0439.3 ± 72.9.11Cardiopulmonary bypass time, min224.5 ± 45.1261.7 ± 47.4.015∗Aortic crossclamp time, min173.8 ± 26.9209.1 ± 37.0.001∗Resternotomy, n (%)1 (5%)2 (10%).55 Concomitant procedure, n (%)8 (40%)3 (15%).077 Coronary artery bypass grafting10 Pulmonary valve isolation20 Partial arch replacement10 Thoracoplasty for funnel chest43Graft size, mm.41 3012 3247 341511Graft bottom size, mm30.6 ± 2.229.3 ± 2.0.056Subvalvular sutures7.0 ± 2.613.1 ± 1.3<.001∗Horizontal shift of CP VBR level, n (%)16 (80%)0<.001∗ Commissure level, n (%)16 (80%)8 (40%).010∗Final CHs (mm) including 2 mm widths of pledgets N-L commissure25.6 ± 3.625.0 ± 1.7.46 L-R commissure26.2 ± 3.824.9 ± 2.2.20 R-N commissure27.6 ± 4.125.6 ± 1.9.052Final uneven CH, n (%)19 (95%)12 (60%).008∗Cusp coaptation height, mm5.8 ± 1.95.2 ± 2.2.36Additional cusp repair, n (%)1 (5%)7 (35%).018∗ Central plication17 Subcommissural plication01STJ plication, mm29.0 ± 2.326.6 ± 0.9<.001∗CT, Computed tomography; CP, commissural position; VBR, virtual basal ring; CH, commissural height; N-L, commissures between the non and left-coronary sinuses; L-R, commissures between the left and right coronary sinuses; R-N, right and noncoronary sinuses; STJ, sinotubular junction.∗P < .05 was considered statistically significant.Figure 3. Intraoperative adjustment of the commissural positions and cusp repair during David reimplantation. The number of patients (A) and commissures (B) requiring CP adjustments based on inspection of the aortic valve and the water test, as well as those requiring cusp repair, are shown. CP, Commissural position.
Postoperative Course
There were no hospital deaths or major postoperative adverse events in either group. Befire discharge, none of the patients had AR graded as greater than mild by TTE. Figure E2 presents the Kaplan**-**Meier curves for cases of recurrent AR greater than mild, accounting for 11.1% of the CT group and 20.0% of the control group after 1 year (P = .21).
Automated Measurement of the VBR Dimensions and CPs
Table 4 compares the measurements of our algorithm and expert 1. The AE (error rate) of the estimated VBR diameters, ICDs, and CHs were 0.5 to 1.3 mm (1.7%-6.2%), corresponding to an almost-perfect correlation (ICC of 0.87-0.97). In our Bland-Altman plots (Figure E1), the patients with values that fell outside the limits of agreements could be explained by poor data conditions, anatomical reasons, and discrepancies between the measurement criteria of the algorithm and the experts. Representative cases of such outliers are shown in Figure E3. Table E2 provides a comparison of the CT measurements by the 3 experts. The AEs between expert 1 and the algorithm were not more than those between the experts in any parameter. The ICCs between the experts were excellent, except for CHs (0.77-0.83). Even for these, the average values of the experts and those of the algorithm showed an excellent ICC (0.91).Table 4. Interobserver variability between the CT measurements by expert 1 and a deep learning−based algorithmParameterCase nExpert 1 [mm^2^ or mm]Algorithm [mm^2^ or mm]Difference [mm^2^ or mm]AE (SE) [mm^2^ or mm]ER (SE) [%]ICC (95% CI)VBR area50621.3 ± 124.8616.5 ± 139.2−4.9 ± 36.322.8 (4.0)3.8 (0.7)0.96 (0.94-0.98)VBR perimeter5088.9 ± 8.989.7 ± 9.80.8 ± 2.11.7 (0.2)1.9 (0.2)0.97 (0.94-0.98)Estimated VBR diameter5028.2 ± 2.828.2 ± 3.10.1 ± 0.70.5 (0.1)1.7 (0.3)0.97 (0.95-0.98)Commissure circle area501271.5 ± 354.71252.3 ± 353.6−19.2 ± 67.953.4 (6.4)4.3 (0.5)0.98 (0.97-0.99)Intercommissural distance15033.7 ± 4.933.7 ± 5.20.0 ± 1.40.8 (0.1)2.5 (0.3)0.96 (0.95-0.97)Commissural height15022.4 ± 3.822.0 ± 3.6−0.3 ± 1.91.3 (0.1)6.2 (0.5)0.87 (0.82-0.90)AE, Absolute error; SE, standard error; ER, error rate; ICC, intraclass correlation coefficient; CI, confidence interval; VBR, virtual basal ring.
Discussion
High-resolution CT is a valuable tool for analyzing aortic root structures.3, 4, 5, 6 VBR areas and perimeters are regularly used in transcatheter aortic valve replacements for valve selection. Although such CT-based VBR measurements have been proposed for VSRR graft sizing,4^,^10 to our knowledge, no report has yet clinically applied this method. As the controls, TEE determined the VBR diameters as it provides better estimates of the oval-shaped VBR than 2-dimensional TTE.12^,^13 In comparing the CT and TEE estimates of VBR diameters (n = 34), we found that CT produced slightly larger estimates, with a difference of 0.1 ± 2.3 mm and ICC of 0.79 (0.61-0.89), suggesting a substantial correlation.
The STJ dimensions were reduced in VSRR, whereas our approach is to preserve the interrelationships between the 3 disproportionate CPs.3^,^4^,^12 Even with discrepant cusp angles, the CT group required less CP adjustment than the controls. Although low eHs could have affected surgeons’ intraoperative decisions with the patients in the control group (Table 2), both groups showed similar cCHs (5-6 mm) (Table 3). Although our target cCH might be insufficient on the basis of the recent recommendation of 8 to 9 mm,18 the CT group showed promising midterm outcomes.
This CT-based approach can simplify surgery and shorten aortic crossclamp time, but the lower number of subvalvular sutures might affect the time (Table 3). The aortic crossclamp times of the CT group patients with 6 subvalvular sutures (n = 17) were an average of 10 minutes shorter than those of the patients with >10 sutures (n = 3) (172 ± 29 minutes vs 182 ± 9 minutes). This difference roughly matched the time for the rest of the 4 to 9 subvalvular sutures. The average time difference for the aortic crossclamping between the control and CT groups was much greater (35 min), presumably owing to the CT-based planning in the CT group.
Even in the CT group, 5 cases needed CP adjustments. Large SOVs (>50 mm) leaded to decreased accuracy in predicting CPs, because CPs were defined by assuming the round VBR shape (Figure 2, C). The gaps errors between the oval-shaped VBR and CCA would be evident with SOV >50 mm. For more precise CP predictions, the cusp angles and the predicted f-value for the CHs necessitates direct measurement using complicated manual methods.
Deep learning−based automated measurement of aortic roots has been progressing9^,^10^,^12^,^19 and focusing on transcatheter aortic valve replacement planning.19 To our knowledge, we first assessed the feasibility of a fully automated algorithm for measuring CCAs, ICDs, and CHs and found excellent correlations between the algorithm and expert measurements, even better than interobserver variance of experts (Table 4 and Table E2). The presence of AR did not affect the algorithm's performance.
VSRR is a complex procedure demanding an interplay between techniques and art. Its proper execution requires both fundamental surgical training and a great deal of experience. The CT-based logical approach we delineate can be used for an invaluable training tool, as well as decision-making by a surgical team, for successful VSRR.
The present study had some limitations. First, this was a retrospective single-center study so the effects of the learning curve for the procedure could not be completely excluded. Second, the sample size was small. Although this was a proof-of-concept study that aimed to demonstrate the applicability of a CT-based approach to VSRR, further studies with larger samples and more variations are needed to refine our strategy and algorithm. Third, since bicuspid valves configure 2 CPs with or without a raphe, the angles of the respective cusps are necessary to determine the horizontal CPs. Fourth, we excluded cases in which aortic cusp repair for cusp deformity was planned. Finally, the long-term outcomes for the spared valve function needs further investigation.
Conclusions
Our results show that CT-based VSRR planning can assist in the intraoperative determination of graft sizes and CPs and reduce the need for additional cusp repair. This simplification of the intraoperative process can reduce the cardiac arrest time. Our artificial intelligence-based algorithm can replace expert measurements to support standardized VSRR planning.
Conflict of Interest Statement
H. Yamauchi, I. Sakuma, and M. Ono received research grants from Canon Medical Systems Corporation. H. Yamauchi received the image processing system (Vitrea) for research purposes from Canon Medical Informatics, Inc. G. Aoyama is Canon Medical Systems Corporation employee. All other authors reported no conflicts of interest.
The Journal policy requires editors and reviewers to disclose conflicts of interest and to decline handling or reviewing manuscripts for which they may have a conflict of interest. The editors and reviewers of this article have no conflicts of interest.
The reference list from the paper itself. Each links out to its DOI / PubMed record.
- 1Feindel C.M.Fan C.S.Park J.Ouzounian M.David T.E.Reimplantation of the aortic valve in patients with tricuspid aortic valve: the Toronto general hospital experience Ann Cardiothorac Surg 12320232372433730470010.21037/acs-2023-avs 1-21PMC 10248913 · doi ↗ · pubmed ↗
- 2Rajesh K.Chung M.Levine D.Importance of surgeon’s experience in practicing valve-sparing aortic root replacement J Thorac Cardiovasc Surg Open 212024193410.1016/j.xjon.2024.07.013PMC 1155129539534352 · doi ↗ · pubmed ↗
- 3Tretter J.T.Izawa Y.Spiner D.E.Understanding the aortic root using computed tomographic assessment: a potential pathway to improved customized surgical repair Circ Cardiovasc Imaging 14112021 e 01313410.1161/CIRCIMAGING.121.01313434743527 · doi ↗ · pubmed ↗
- 4Izawa Y.Mori S.Tretter J.T.Normative aortic valvar measurements in adults using cardiac computed tomography: a potential guide to further sophisticated aortic valve-sparing surgery Circ J 8572021105910673340830410.1253/circj.CJ-20-0938 · doi ↗ · pubmed ↗
- 5Komiya T.Shimamoto T.Nonaka M.Matsuo T.Is small cusp size a limitation for aortic valve repair?Eur J Cardiothorac Surg 56320194975023082491810.1093/ejcts/ezz 053 · doi ↗ · pubmed ↗
- 6Tanaka H.Nomura Y.Murakami H.Miyahara S.A simplified approach to determine the ventriculoaortic junction diameter in the reimplantation procedures J Thorac Cardiovasc Surg Tech 122022273110.1016/j.xjtc.2021.12.013PMC 898729635403063 · doi ↗ · pubmed ↗
- 7Kubo S.Tanaka A.Omura A.Long-term results of valve-sparing aortic root replacement and aortic cusp repair Ann Thorac Surg 1171202478863754156110.1016/j.athoracsur.2023.05.050 · doi ↗ · pubmed ↗
- 8Beckmann E.Martens A.Krueger H.Aortic valve-sparing root replacement (David): learning curve and impact on outcome Interact Cardiovasc Thorac Surg 30520207547613197122810.1093/icvts/ivz 324 · doi ↗ · pubmed ↗