Fontan associated protein-losing enteropathy is linked to distinct metabolic and hepatic alterations
Christian Schroeder, Fabian B. Fahlbusch, Robert Cesnjevar, Manfred Rauh, Sven Dittrich, Julia Moosmann

TL;DR
Fontan patients with protein-losing enteropathy show unique metabolic changes involving lipids, bile acids, and hormone activation.
Contribution
Identifies a distinct metabolic and hepatic signature in Fontan patients with protein-losing enteropathy using targeted serum metabolomics.
Findings
Fontan patients with PLE show increased cholesterol, triacylglycerols, and phosphatidylcholine species compared to those without PLE.
Bile acid derivatives like taurodeoxycholic acid are lower in PLE patients and correlate with renin and phosphatidylcholine levels.
Hypoalbuminemia and hypogammaglobulinemia in PLE are linked to activation of the renin-angiotensin-aldosterone system and vasopressin.
Abstract
The univentricular Fontan circulation is associated with long-term multiorgan complications, including protein-losing enteropathy (PLE). While hemodynamic and lymphatic contributors to PLE have been described, its systemic metabolic signature remains incompletely characterized. We aimed to identify PLE-associated alterations in circulating metabolites using targeted serum metabolomics. Targeted serum metabolomic profiling was performed by liquid chromatography–tandem mass spectrometry (LC–MS/MS) using the AbsoluteIDQ p180 kit. Forty-nine individuals were included: Fontan patients with PLE (FPLE, n = 10), Fontan patients without PLE (F, n = 30), and clinically stable biventricular controls (C, n = 9). Data were analyzed using MetaboAnalyst v6.0, including multivariate modeling (PLS-DA), univariate statistics with false discovery rate correction, correlation analyses, and receiver…
Genes, proteins, chemicals, diseases, species, mutations and cell lines named across the full text — each resolved to its canonical identifier and authoritative record.
Click any figure to enlarge with its caption.
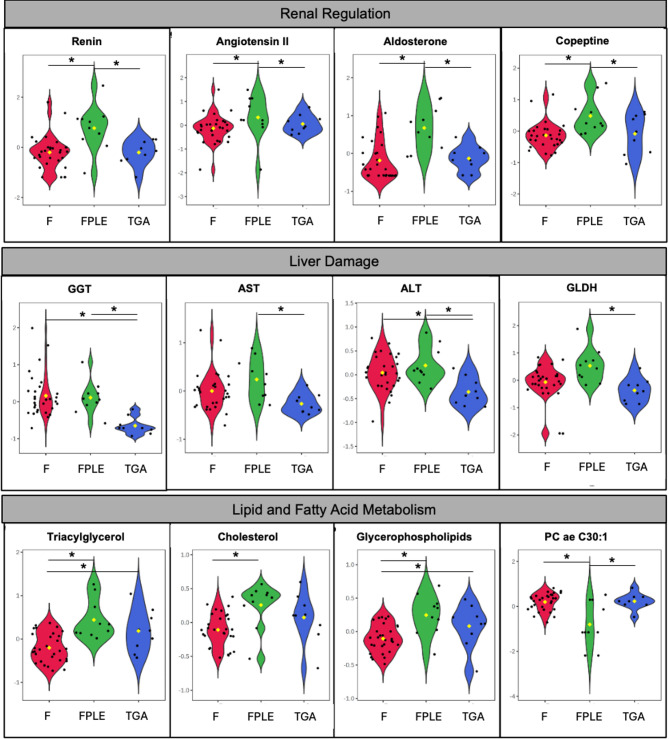 Figure 1
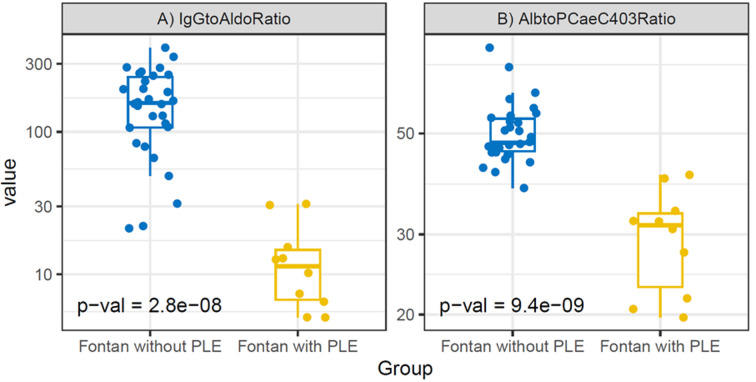 Figure 2
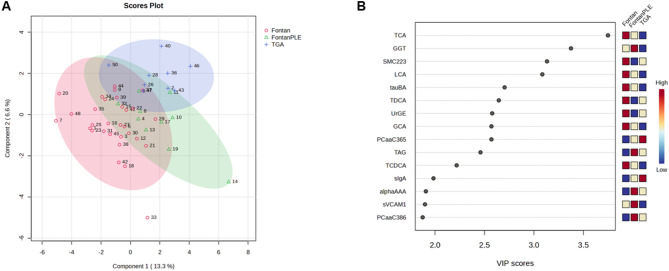 Figure 3
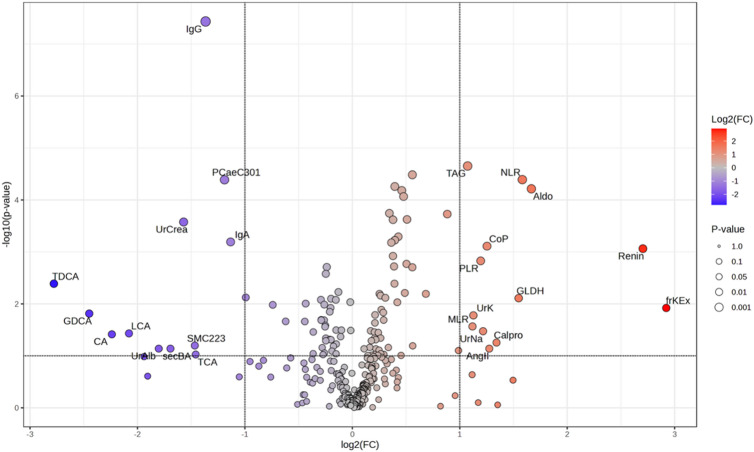 Figure 4
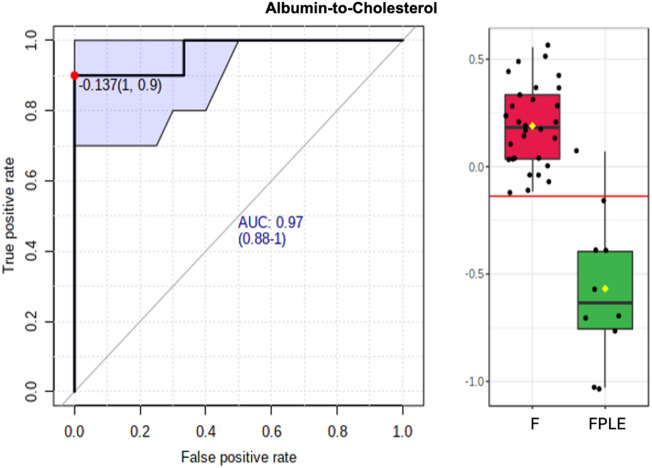 Figure 5
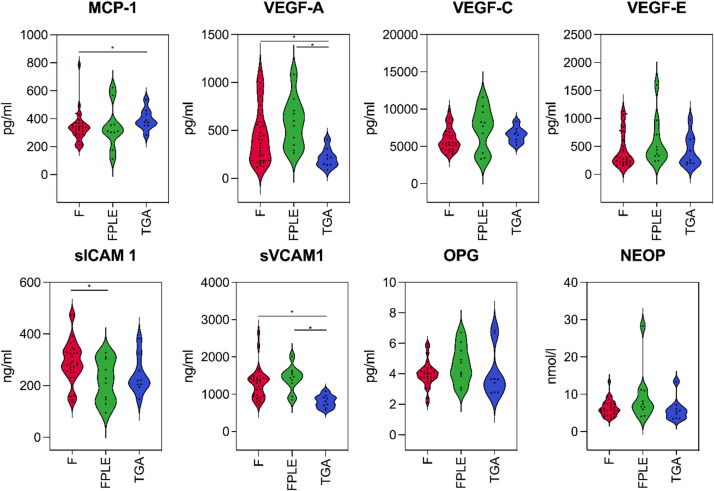 Figure 6
- —Charité - Universitätsmedizin Berlin (3093)
Peer Reviews
No public reviews on file for this paper yet. If you reviewed it on a platform where reviews are public (OpenReview, ICLR, NeurIPS, ICML), you can paste yours below so the community can read it here.
Videos
No videos yet. Explain this paper in a talk, walkthrough, or lecture? Add one.
Taxonomy
TopicsCongenital Heart Disease Studies · Nutrition and Health in Aging · Lymphatic Disorders and Treatments
Introduction
The Fontan procedure is the standard surgical approach for palliation of congenital single-ventricle heart defects^1^. Since its first description in 1971^2^, it has significantly improved survival and outcomes for patients with complex congenital heart disease (CHD)^3,4^. However, the absence of a sub-pulmonary ventricle leads to chronically elevated central venous pressure, non-pulsatile pulmonary blood flow, and reduced cardiac output^5–9^. As a result, the Fontan circulation predisposes patients to a variety of complications, many of which extend beyond circulatory failure^10^. Multiorgan complications are common, with significant impact on morbidity arising from conditions such as protein-losing enteropathy (PLE), plastic bronchitis, lymphatic malformations, renal dysfunction and Fontan-associated liver disease (FALD). The various complications frequently overlap, making clinical management more complex. FALD, particularly when accompanied by liver fibrosis and cirrhosis, is known to increase hepatic lymph production and promote lymphangiogenesis^15,16^. This pathophysiological process is believed to cause characteristic abdominal lymphatic malformations which are seen in patients with PLE^17,18^.
Omic technologies—including genomics, transcriptomics, proteomics, and metabolomics—have significantly transformed our understanding of cardiovascular diseases, such as heart failure, by facilitating the discovery of novel biomarkers and therapeutic targets^11^. Previous studies characterizing metabolic changes in Fontan patients have primarily focused on amino acid and phospholipid metabolomics in adult patients with a dominant left ventricle^12,13^. These prior reports have identified disruptions in cellular signalling and energy metabolism, along with evidence of oxidative stress, chronic low-level inflammation, endothelial dysfunction, as well as structural and/or functional changes in lymphatic vessels^12–14^. Expanding on these findings, Fontan-specific alterations in tricarboxylic acid (TCA) cycle metabolites, including 2-oxoglutaric acid and cis-aconitic acid^14^ could be identified.
However, metabolomic signatures specifically linked to PLE - a complication marked by multisystem involvement and end-organ dysfunction - remain poorly characterized. Therefore, we performed a targeted metabolomic analysis to characterize metabolic differences among three groups: Fontan patients with PLE (FPLE), Fontan patients without PLE (F), and biventricular controls (C). Identifying distinct metabolic patterns in pediatric patients with FPLE, a subgroup at high risk for severe complications and adverse outcomes, may uncover novel pathophysiological mechanisms and reveal novel biomarkers as potential therapeutic targets.
Materials and methods
Patients
Patients who had undergone Fontan surgery at the Department of Pediatric Cardiac Surgery and were receiving postoperative follow-up care at the Department of Pediatric Cardiology, University Hospital of Erlangen, Germany, were prospectively invited to participate in this study. Thirty Fontan patients without PLE and ten Fontan patients with PLE consented to participate. As a biventricular control group, nine age-matched patients with dextro-transposition of the great arteries (d-TGA) after arterial switch operation were included, as both control and Fontan groups required neonatal cardiac surgery. d-TGA controls were in good clinical condition, had normal ventricular function, no clinically relevant valvular disease, and without signs of heart failure (NYHA functional class I) at the time of sampling. Patients with residual hemodynamically significant lesions, advanced heart failure, acute intercurrent illness, or conditions known to substantially affect lipid or bile acid metabolism were excluded. Patient characteristics of all three groups are summarized in Table 1. PLE was diagnosed in accordance with the American Heart Association (AHA) Clinical Statement, defining PLE as a clinical syndrome characterized by elevated fecal alpha-1-antitrypsin (> 400 µg/g), hypoalbuminemia (< 30 g/L) or reduced serum total protein (< 50 g/L), and evidence of third-space fluid retention (e.g., ascites, edema, or pleural effusions) in the absence of another identifiable cause^7^.
Table 1. Patient demographics, vital signs, and routine laboratory parameters.Fontan with PLE(FPLE; n=10)Fontan without PLE(F; n=30)d-TGA(C; n=9)p-ValueFDRFPLE - FFPLE - CF - CDemographics Female sex5 (50%)12 (40%)2 (22%)---- Age at examination (years)13.8 ± 7.8614.03 ± 6.916.22 ± 5.26nsnsnsns Height (cm)134.23 ± 25.12155 ± 30.22150.44 ± 38.92nsnsnsns Weight (kg)33.07 ± 14.5049.75 ± 25.1070.94 ± 44.47nsnsnsns Body surface area (m^2^)1.1 ± 0.351.44 ± 0.511.61 ± 0.31nsnsnsnsAnatomical and Surgical Details Dominance of right ventricle5 (50%)12 (40%)-ns--- Age at TCPC (years)4.58 ± 5.483.68 ± 2.23-ns--- Time since TCPC (years)6.89 ± 4.849.68 ± 6.43-ns--- Fenestration2 (20%)3 (10%)-ns---Vital Signs SpO_2_ (%)93.3 ± 2.3694.1 ± 4.6798 ± 2.06ns0.013nsns Heart rate (bpm)95.3 ± 16.3180.14 ± 16.1469.78 ± 13.3ns< 0.001nsnsBlood pressure (mmHg) Systolic104.13 ± 8.27115.83 ± 12.43124.89 ± 17.66ns< 0.0001ns0.041 Diastolic62 ± 5.5163.41 ± 7.7760.31 ± 8.5nsnsnsns Mean76.59 ± 6.0282.62 ± 8.1282.57 ± 11.78nsnsnsnsRoutine Blood Analysis Hemoglobin (g/dl)14.56 ± 2.2414.57 ± 1.6714.16 ± 1.86nsnsnsns Erythrocyte count (pl^-1^)5.1 ± 0.774.99 ± 0.544.95 ± 0.43nsnsnsns Platelet count (nl^-1^)259.4 ± 115.33181.28 ± 62.56218.78 ± 43.760.006nsnsns Leucocyte count (nl^-1^)7.06 ± 2.455.32 ± 1.656.04 ± 1.070.01nsnsns Lymphocyte count (nl^-1^)1.03 ± 0.891.34 ± 0.531.81 ± 0.35ns0.0070.045ns Neutrophile count (nl^-1^)5.56 ± 1.623.11 ± 0.913.53 ± 0.94< 0.001< 0.001ns0.007 Eosinophile count (nl^-1^)0.26 ± 0.250.14 ± 0.070.19 ± 0.150.026nsnsns Basophile count (nl^-1^)0.05 ± 0.060.04 ± 0.040.03 ± 0.02nsnsnsns Monocyte count (nl^-1^)0.66 ± 0.320.52 ± 0.220.5 ± 0.11nsnsnsns Osmolarity (mOsm/kg)279.1 ± 3.87282.07 ± 3.58284.44 ± 2.070.0220.001ns0.043 Sodium (mM)134.4 ± 1.96136.2 ± 1.75137.56 ± 1.010.005< 0.0010.040.013 Potassium (mM)3.36 ± 0.523.99 ± 0.663.71 ± 0.240.005nsns0.041 Calcium (mM)2.1 ± 0.182.29 ± 0.172.43 ± 0.340.0150.001ns0.041 Creatinine (mg/dl)0.48 ± 0.190.62 ± 0.240.73 ± 0.23ns0.023nsns Glucose (mg/dl)93.4 ± 21.8490.27 ± 16.5593.22 ± 10.94nsnsnsnsRoutine Urine Analysis Osmolarity (mOsm/kg)403 ± 201.51673.33 ± 290.36811 ± 281.560.010.002nsns Sodium (mM)43.19 ± 40.218.58 ± 14.1312.81 ± 5.640.0030.003nsns Fractional excretion (%)1.32 ± 1.080.65 ± 0.360.59 ± 0.260.0030.008nsns Potassium (mM)21.77 ± 20.289.97 ± 8.716.87 ± 2.230.0070.006nsns Fractional excretion (%)87.59 ± 208.2911.94 ± 9.8311.63 ± 4.090.032nsnsns Creatinine (mg/dl)34.94 ± 30.19103.78 ± 73.18148.94 ± 63.680.006< 0.001ns0.004 Glucose (mg/dl)3.6 ± 3.377.2 ± 5.027.89 ± 6.15nsnsnsnsValues are presented as mean ± standard deviation (SD). Metric data were analyzed using one-way ANOVA with Fisher’s least significant difference (LSD) post hoc test; pairwise comparisons used Student’s t-test. Categorical data were analyzed using the Chi-square test. Abbreviations: TCPC = total cavo-pulmonary connection, ns = not significant.
Sample collection and preparation
Serum samples for metabolomic and biomarker analyses were obtained during peripheral venous blood sampling performed for clinical care, including complete blood count, coagulation parameters, electrolytes, and liver and renal function tests. Clean-catch urine samples were collected for the analysis of electrolytes, osmolality, creatinine, and protein. All routine laboratory analyses were performed at the certified clinical laboratory of the University Hospital of Erlangen, Germany.
Metabolomic and enzyme-linked immunosorbent assay (ELISA) analyses
Serum samples were centrifuged and stored at -80 °C within 20 min after collection. Targeted metabolomic profiling was performed using the AbsoluteIDQ p180 kit (Biocrates Life Sciences, Innsbruck, Austria) according to the manufacturer’s instructions, as previously described^15^. The kit quantifies 188 metabolites across multiple analyte classes, including acylcarnitines, amino acids, biogenic amines, phosphatidylcholines, sphingolipids, and hexose. Serum bile acids were quantified using targeted metabolomics. Bile acids were categorized into primary and secondary species according to established definitions. Individual bile acid species were analyzed in relation to clinical and biochemical parameters. Enzyme-linked immunosorbent assays (ELISAs) were used to quantify vascular and inflammatory markers, including vascular endothelial growth factor A, C, and D (VEGF-A, VEGF-C, VEGF-D), soluble intercellular adhesion molecule-1 (sICAM-1), neopterin, and monocyte chemoattractant protein-1 (MCP-1). These markers were selected based on their established roles in lymphangiogenesis, endothelial activation, and immune activation relevant to Fontan physiology and PLE^16–20^. All ELISAs were performed according to the manufacturer’s instructions (R&D Systems, Minneapolis, USA).
Statistical analysis
Statistical analyses were conducted using MetaboAnalyst 6.0, R statistical software version 4.3.0^21,22^, and IBM SPSS Statistics version 29.0.1.0^23^. Prior to analysis, metabolomic data were log10-transformed and Pareto-scaled^24^. Values below the limit of detection were imputed as LOD/2, values below the lower limit of quantification were set to (LOD + LLOQ)/2, and values exceeding the upper limit of quantification were capped at the ULOQ.
Univariate analyses and multiple-testing correction
Overall group differences among Fontan patients with PLE, Fontan patients without PLE, and controls were assessed using analysis of variance (ANOVA). Resulting p-values were adjusted for multiple testing using the Benjamini–Hochberg false discovery rate (FDR) procedure, with statistical significance defined as an FDR-adjusted p-value < 0.05. Post-hoc comparisons were used to summarize group-wise means and standard deviations. Categorical variables were analyzed using the chi-squared test, and correlations between continuous variables were assessed using Pearson’s correlation coefficient.
Exploratory multivariate analysis
To explore multivariate metabolic patterns and group separation, supervised partial least squares–discriminant analysis (PLS-DA) was performed using MetaboAnalyst version 6. Prior to multivariate modelling, the input feature set was restricted to a limited subset of metabolites selected based on biological plausibility and evidence from univariate analyses, in order to reduce dimensionality and limit model complexity. The maximum number of latent components was limited to five.
Model performance was assessed using five-fold cross-validation, with Q² used as the primary performance metric. Permutation testing was applied to evaluate the robustness of group separation. Variable importance in projection (VIP) scores were calculated to summarize the relative contribution of individual metabolites to group separation across model components, accounting for explained variance^25,26^. Given the limited sample size and exploratory design of the study, PLS-DA was used exclusively as a descriptive pattern-recognition approach and was not interpreted as confirmatory evidence of discrimination.
Exploratory ROC-based screening of candidate ratios
Univariate ROC curve analyses were performed as an exploratory screening step to identify candidate metabolic and routine laboratory ratios that discriminate Fontan patients with PLE from those without PLE. ROC curves were derived from the same dataset used to nominate and characterize these ratios. For each analysis, sensitivity, specificity, area under the curve (AUC), and 95% confidence intervals were calculated^27^. Because marker nomination and performance estimation were conducted within the same dataset and the number of patients with PLE was limited (n = 10), no internal validation procedures (e.g., bootstrapping or cross-validation) were applied. Accordingly, reported AUC values represent potentially optimistic estimates and should be interpreted as hypothesis-generating rather than confirmatory.
Multivariate linear analysis of biomarker ratios
To evaluate whether group differences in the IgG-to-aldosterone and albumin-to-PC ae C40:3 ratios persisted after adjustment for clinical covariates, multivariate linear models were applied. Given strong correlations among age at visit, body size, and time since total cavo-pulmonary connection (TCPC), model parsimony was prioritized to minimize multicollinearity (Supplementary Table 1, Supplementary Fig. 1). A comprehensive model including age at follow-up, years since TCPC, sex, body surface area (BSA), and diuretic therapy, as well as PLE status was compared with reduced models (Supplementary Figure S2). Likelihood ratio testing supported a simplified specification retaining sex, BSA, and diuretic therapy as fixed effects.
Separate models were fitted for each biomarker ratio. Estimated marginal means were calculated to visualize adjusted group differences under diuretic use and non-use.
Data availability
The original contributions presented in this study are included in the article and its supplementary material. Further information is available from the corresponding author upon reasonable request.
Ethics
The collection and analysis of human blood samples and clinical data were approved by the Ethics Committee of the University of Erlangen (Re.-No. 145_13B). Written informed consent was obtained from all participants or their legal guardians. The study was conducted in accordance with the Declaration of Helsinki (2024)^28^.
Results
Baseline characteristics and descriptive clinical comparisons
A total of 49 patients were included in the analysis, comprising 30 Fontan patients without PLE (F), 10 Fontan patients with PLE (FPLE), and 9 clinically stable biventricular controls (C). Baseline demographic characteristics, anatomical and surgical details, medication use, vital signs, and routine blood and urine laboratory parameters are summarized in Table 1. Overall, demographic variables, cardiac anatomy, and surgical characteristics were comparable between Fontan patients with and without PLE, providing a stable clinical framework for subsequent metabolomic and biomarker analyses. Diuretic therapy was more frequently used in patients with PLE (8/10) compared with Fontan patients without PLE (2/30), whereas beta-blocker use was rare and anticoagulation was common in both Fontan groups (FPLE: 7/10 and Fontan 15/30); none of the biventricular control patients received these medications.
Univariate group comparisons of metabolites and routine laboratory parameters
Protein metabolism, immunoglobulins, and amino acid profiles
Univariate analyses revealed pronounced alterations in protein metabolism and immunoglobulin homeostasis in FPLE (Table 2, Protein Metabolism). After correction for multiple testing, fecal alpha-1-antitrypsin remained significantly elevated in FPLE, while serum concentrations of total protein, albumin, immunoglobulin G (IgG), and immunoglobulin A (IgA) were significantly reduced compared with both Fontan patients without PLE and biventricular controls (FDR < 0.05 for all). Among amino acids and biogenic amines, histidine concentrations were significantly lower, whereas ornithine concentrations were significantly higher in FPLE after FDR correction (Table 2, Amino Acids and Biogenic Amines). In contrast, spermidine showed numerically higher concentrations in FPLE but did not remain significant after adjustment for multiple testing.
Table 2. Altered metabolomic pathways and systemic parameters.Fontan with PLE(FPLE; n=10)Fontan without PLE(F; n=30)d-TGA(C; n=9)p-ValueFDRFPLE - FFPLE - CF - CProtein Metabolism Total protein serum (g/l)48.3 ± 12.2166.7 ± 4.3667.2 ± 4.24< 0.001< 0.001nsns Total protein urine (g/l)162.3 ± 177.29171.33 ± 124.7995.33 ± 68.26nsnsnsns Albumin serum (g/dl)2.88 ± 0.824.3 ± 0.274.42 ± 0.19< 0.001< 0.001nsns Albumin urine (mg/dl)4.65 ± 0.8316.77 ± 22.7325.55 ± 48.31nsnsnsns Faecal alpha-1-antitrypsine (µg/g)1424.5 ± 640.52247.93 ± 321.71238.33 ± 150.48< 0.001< 0.001nsns Faecal Calprotectin (µg/g)59.06 ± 121.7524.9 ± 42.5813.78 ± 22.3nsnsnsnsAmino acids Histidine (µM)78.68 ± 16.6490.53 ± 11.9108.21 ± 18.30.027< 0.0010.0020.007 Ornithine (µM)141 ± 21.06101.31 ± 22.2994.36 ± 21.16< 0.001< 0.001ns0.004 Arginine (µM)97.3 ± 16.23107.66 ± 22.07124.24 ± 21.28ns0.007nsns Biogenic amines Spermidine (µM)0.28 ± 0.080.23 ± 0.050.2 ± 0.030.010.004nsns Creatinine (µM)47.74 ± 19.9664.87 ± 24.7275.13± 23.46ns0.015nsnsImmunoglobulins IgG (U/l)3.66 ± 3.729.44 ± 2.79.31 ± 2.58< 0.001< 0.001ns< 0.001 IgA (U/l)0.67 ± 0.381.48 ± 0.81.23 ± 0.520.003nsns0.017Renal Regulation Renin (pg/ml)326.6 ± 675.0752.21 ± 129.1523.67 ± 16.070.020.04ns0.017 Angiotensin II (U/l)51.8 ± 45.6219.94 ± 26.520.02 ± 12.960.0070.026nsns Aldosterone (ng/ml)0.29 ± 0.220.09 ± 0.090.08 ± 0.04< 0.001< 0.001ns0.004 Copeptin (pmol/l)16.35 ± 14.336.86 ± 5.67.84 ± 5.10.0020.026ns0.041Liver Damage GGT (U/l)58.5 ± 45.3380.73 ± 119.4818.22 ± 6.53ns<0.001<0.0010.009 AST (U/l)6.43 ± 8.622.26 ± 1.471.28 ± 0.94ns0.024nsns ALT (U/l)28 ± 10.6524.33 ± 8.1316.44 ± 4.61ns0.0040.0150.041 GLDH (U/I)6.43 ± 8.622.26 ± 1.471.28 ± 0.94ns0.004ns0.041Lipid and Fatty Acid Metabolism Triacylglycerol (mg/dl)137.37 ± 77.9865.29 ± 23.79105.4 ± 59.45< 0.001ns0.0280.004 Cholesterol (mg/dl)165.15 ± 33.13125.48 ± 22.58145.34 ± 35.43< 0.001nsns0.033 Glycerophospholipids (total, mM)2.44 ± 0.471.92 ± 0.262.2 ± 0.43< 0.001ns0.0410.016 lysoPC a C16:0 (µM)96.65 ± 13.7486.38 ± 14.24105.07 ± 18.16nsns0.002ns lysoPC a C18:2 (µM)21.14 ± 8.6827.2 ± 8.5932.94 ± 6.20.050.003nsns PC aa C34:1 (µM)320.3 ± 90.81238.03 ± 42.76275.22 ± 48.63< 0.001nsns0.016 PC aa C34:2 (µM)579.7 ± 107.62445.87 ± 75.28515 ± 121.01< 0.001nsns0.017 PC aa C36:3 (µM)183.6 ± 60.47124.63 ± 19.86147.88 ± 35.63< 0.0010.029ns0.006 PC aa C36:4 (µM)212.4 ± 39.43154.41 ± 31.65194.26 ± 53.55< 0.001ns0.0080.009 PC aa C36:5 (µM)20.94 ± 11.0813.04 ± 5.1424.18 ± 14.580.018ns0.0020.032 PC aa C38:4 (µM)108.76 ± 20.5883.68 ± 19.6191.10 ± 23.490.002nsns0.043 PC aa C38:5 (µM)52.52 ± 13.7236.91 ± 8.6247.41 ± 15.07< 0.001ns0.0160.003 PC aa C38:6 (µM)65.29 ± 20.4544.33 ± 13.9762.83 ± 26.170.003ns0.010.043 PC ae C30:1 (µM)0.04 ± 0.050.1 ± 0.050.1 ± 0.050.0040.017nsns PC ae C34:3 (µM)7.32 ± 2.588.89 ± 2.610.8 ± 2.14ns0.004ns0.045 PC ae C36:1 (µM)9.27 ± 1.927.21 ± 1.217.87 ± 1.92< 0.0010.049nsns PC ae C36:2 (µM)17.08 ± 3.7812.99 ± 2.1514.33 ± 4.42< 0.001nsnsns PC ae C38:0 (µM)1.83 ± 0.551.29 ± 0.341.82 ± 0.780.004ns0.0060.041 Sphingolipids (total, mM)0.16 ± 0.020.14 ± 0.020.15 ± 0.02nsnsnsns Acylcarnitine (total, mM)0.05 ± 0.010.06 ± 0.010.06 ± 0.010.032nsnsnsComparison of key metabolomic and regulatory features across groups. Metric data were analyzed using one-way ANOVA with Fisher’s LSD post hoc test; pairwise comparisons used Student’s t-test. Abbreviation: ns = not significant.#.
Renal-neurohormonal regulation and electrolyte homeostasis
Parameters reflecting renal–neurohormonal regulation (renin-angiotensin-aldosterone-system (RAAS)/vasopressin) differed between groups (Tables 1 and 2, Renal Regulation). After FDR correction, markers of renin–angiotensin–aldosterone system activation, including renin, aldosterone, and copeptin, were significantly elevated in FPLE compared with non-PLE Fontan patients and controls (Table 2; Fig. 1, Renal Regulation). Several routine electrolyte parameters showed numerical group differences that did not persist after correction for multiple testing.
Fig. 1. Group-wise comparison of key metabolic features. Normalized metabolite values in Fontan patients without PLE (red), with PLE (green), and biventricular controls with d-TGA (blue), displayed as violin plots. Statistical comparisons were performed on normalized data. Significant differences are indicated by asterisks (*).
Hepatic injury markers
Group comparisons of hepatic injury markers demonstrated heterogeneous patterns across cohorts (Table 2, Liver Damage). After FDR correction, gamma-glutamyltransferase (GGT), alanine aminotransferase (ALT), and glutamate dehydrogenase (GLDH) differed significantly between groups, whereas aspartate aminotransferase (AST) did not remain significant (Table 2; Fig. 1, Liver Damage).
Lipid and fatty acid metabolism
Univariate lipidomic analyses identified group-dependent alterations across lipid classes (Table 2, Lipid and Fatty Acid Metabolism). After FDR correction, cholesterol, triacylglycerols, and total glycerophospholipids differed significantly between groups (Table 2; Fig. 1, Lipid and Fatty Acid Metabolism). Multiple phosphatidylcholine species (both PC aa and PC ae) exhibited FDR-significant differences, with highest concentrations observed in FPLE and lowest concentrations in Fontan patients without PLE. In contrast, sphingolipids and acylcarnitines did not show FDR-significant group differences.
Adjusted associations in multivariate linear regression models
Group-dependent distributions of biomarker ratios
To translate the univariate alterations in protein metabolism, lipid profiles, and renal–neurohormonal regulation into candidate composite biomarkers, we performed an exploratory ROC-based screening of candidate single markers and ratios. The IgG-to-aldosterone ratio and the albumin-to-PC ae C40:3 ratio showed the highest discriminatory potential (see 3.5) and were therefore examined further. Both ratios showed distinct group-dependent distributions, with lower values observed in Fontan patients with PLE compared with Fontan patients without PLE (Fig. 2).
Fig. 2. Boxplots illustrating the distribution of (A) IgG-to-aldosterone and (B) albumin-to-PC ae C40:3 ratios in Fontan patients with and without protein-losing enteropathy (PLE). Both biomarker ratios differed between groups in unadjusted analyses.
Effect of diuretic therapy and adjusted group differences
Diuretic therapy was used significantly more frequently in FPLE (see 3.1), diuretic use was considered a potential confounder in the analysis of biomarker ratios. Multivariate linear models were therefore applied to assess adjusted group differences while accounting for sex, body surface area, and diuretic therapy. In these models, no relevant association was observed between diuretic use and either the IgG-to-aldosterone ratio or the albumin-to-PC ae C40:3 ratio (Table 3). In contrast, group status (FPLE vs. F patients) accounted for the majority of variability in both ratios. Estimated marginal means confirmed that group differences in both ratios persisted after adjustment for diuretic therapy. Model structure and covariance assumptions are shown in Supplementary Table S1 / Figure S1.
Table 3. Results of the simplified multivariate linear models for biomarker ratios. Term IgGtoAldoRatio AlbtoPCaeC403Ratio Estimate (95% CI)pval Estimate (95% CI) pvalSexMale-22.89 (-79.60-33.83)0.4293.38 (-2.35-9.11)0.248BSA47.04 (-12.62-106.70)0.1220.28 (-5.74-6.30)0.928DiureticsTRUE-4.14 (-99.07-90.80)0.932-4.08 (-13.75-5.59)0.408Biomarker ratios were regressed on sex, BSA, diuretic therapy, and PLE status. Legend: Variables included were sex (male vs. female), body surface area (BSA), current diuretic therapy (yes/no), PLE status (with/without), the IgG-to-aldosterone ratio, and the albumin-to-phosphatidylcholine ae C40:3 ratio.
Exploratory multivariate pattern analysis
PLS-DA was applied as an exploratory multivariate approach. In the scores plot, Fontan patients without PLE and controls occupied largely distinct regions of the multivariate space, whereas FPLE patients clustered in an intermediate position with partial overlap with both groups (Fig. 3A).
Fig. 3. Partial least squares–discriminant analysis (PLS-DA). (A) Two-dimensional scores plot illustrating multivariate separation between Fontan patients without protein-losing enteropathy (F), Fontan patients with protein-losing enteropathy (FPLE), and controls (C). Partial overlap between groups reflects inter-individual metabolic variability. (B) Variable importance in projection (VIP) scores from the optimized PLS-DA model highlighting variables contributing most strongly to group separation. Variables are color-coded according to relative group means, with higher mean values indicated in red and lower mean values in blue. VIP scores are shown for exploratory pattern recognition rather than inferential testing. Abbreviations: Abbreviations: VIP, variable importance in projection; TCA, taurocholic acid; LCA, lithocholic acid; tauBA, total taurine-conjugated bile acids; TDCA, taurodeoxycholic acid; TCDCA, taurochenodeoxycholic acid; GCA, glycocholic acid; SM C22:3, sphingomyelin (22:3); PC aa C36:5, phosphatidylcholine diacyl (36:5); PC aa C38:6, phosphatidylcholine diacyl (38:6); TAG, triacylglycerol; GGT, gamma-glutamyltransferase; UrGE, urinary gamma-glutamyltransferase equivalent; sIgA, secretory immunoglobulin A; α1A, alpha-1 antitrypsin; sVCAM-1, soluble vascular cell adhesion molecule-1.
Variables contributing most strongly to group separation, as indicated by VIP scores, were predominantly related to lipid and bile acid metabolism, including taurocholic acid, lithocholic acid, total taurine-conjugated bile acids, sphingomyelin SM C22:3, and gamma-glutamyltransferase (Fig. 3B). These multivariate patterns were consistent with the univariate metabolite profiles (Fig. 4; Table 4).
Fig. 4. Volcano plot of fold change analysis. Volcano plot depicting metabolites differentially abundant between Fontan patients without PLE and those with PLE. Significant features are highlighted. Abbreviations: Aldo = Aldosterone, Ang II = Angiotensin II, CA = Cholic acid, Calpro = Fecal calprotectin, CoP = Copeptin, frKEx = Fractional potassium excretion (urine), GDCA = Glycodeoxycholic acid, LCA = Lithocholic acid, secBA = Secondary bile acids, MLR = Monocyte-to-lymphocyte ratio, NLR = Neutrophil-to-lymphocyte ratio, PLR = Platelet-to-lymphocyte ratio, TAG = Triacylglycerol, TCA = Taurocholic acid, TDCA = Taurodeoxycholic acid, UrAlb = Urinary albumin, UrCrea = Urinary creatinine, UrK = Urinary potassium, UrNa = Urinary sodium.
Table 4. Fold change analysis comparing Fontan patients with PLE (FPLE) to those without PLE (F).A) Decrease of absolute values in FPLE compared to FB) Increase of absolute values in FPLE compared to FFold Changep-ValueFold Changep-ValueTDCA0.1460.004frKEx7.5770.012GDCA0.1830.015Renin6.518< 0.001CA0.2120.038Aldo3.175< 0.001LCA0.2370.037NLR2.994< 0.001UrAlb0.2870.073GLDH2.9250.008secBA0.3090.073Calpro2.5350.056UrCrea0.337< 0.001AngII2.4190.073SM C22:30.3620.063CoP2.384< 0.001TCA0.3640.094UrNa2.3250.034IgG0.388< 0.001PLR2.2890.001PC ae C30:10.438< 0.001UrK2.1840.017IgA0.456< 0.001TAG2.104< 0.001Fold change and p-values are shown for metabolites and clinical parameters with either a decrease (A) or increase (B) in FPLE relative to F. Abbreviations: Aldo = Aldosterone, Ang II = Angiotensin II, CA = Cholic acid, Calpro = Fecal calprotectin, CoP = Copeptin, frKEx = Fractional potassium excretion (urine), GDCA = Glycodeoxycholic acid, LCA = Lithocholic acid, secBA = Secondary bile acids, MLR = Monocyte-to-lymphocyte ratio, NLR = Neutrophil-to-lymphocyte ratio, PLR = Platelet-to-lymphocyte ratio, TAG = Triacylglycerol, TCA = Taurocholic acid, TDCA = Taurodeoxycholic acid, UrAlb = Urinary albumin, UrCrea = Urinary creatinine, UrK = Urinary potassium, UrNa = Urinary sodium, SM = Sphingomyelin, PC ae = Acyl-alkyl phosphatidylcholine.
To contextualize the univariate and adjusted findings, exploratory correlation analyses revealed group-dependent patterns of association between selected bile acids, renin, and phosphatidylcholine species that were predominantly observed in patients with PLE (Supplementary Tables S2-S3).
Exploratory diagnostic performance of metabolic ratios
ROC analyses were performed as part of this exploratory screening to compare the discriminatory performance of candidate metabolic and routine laboratory ratios in differentiating Fontan patients with and without PLE. The IgG-to-aldosterone ratio and the albumin-to-PC ae C40:3 ratio showed the highest areas under the curve among the evaluated parameters (Table 5). A representative ROC curve is shown in Fig. 5. Because ratio nomination and performance estimation were performed in the same dataset, AUC estimates should be interpreted as hypothesis-generating and may overestimate true discriminatory performance.
Table 5. Univariate ROC analysis of selected biomarker ratios distinguishing Fontan patients with and without PLE.Neutrophile-to-LymphocyteAUC (CI)Fontan with PLE (n = 10)Fontan wo. PLE (n = 30)p-Value0.897 (0.7-1)7.5 ± 4.112.58 ± 1.17< 0.001Platelets-to-Lymphocyte0.837 (0.618–0.993)327.8 ± 209.61147.72 ± 63.410.002IgG-to-Aldosterone0.99 (0.96-1)13.7 ± 9.75167.55 ± 93.73< 0.001IgG-to-Cholesterol0.917 (0.73-1)0.02 ± 0.030.08 ± 0.03< 0.001IgG-to-TAG0.943 (0.81-1)0.04 ± 0.040.16 ± 0.07< 0.001IgG-to-Ornithine0.927 (0.748-1)0.03 ± 0.030.1 ± 0.03< 0.001IgG-to-C18:10.96 (0.873-1)24.04 ± 19.6481.8 ± 25.09< 0.001IgG-to-PC aa C36:30.933 (0.79-1)0.02 ± 0.030.08 ± 0.03< 0.001IgG-to-PC ae C36:10.927 (0.77-1)0.42 ± 0.481.32 ± 0.45< 0.001IgG-to-PC ae C44:50.953 (0.852-1)2.89 ± 2.188.55 ± 2.75< 0.001Albumin-to-Cholesterol0.97 (0.88-1)0.18 ± 0.060.35 ± 0.07< 0.001Albumin-to-PC aa C34:10.963 (90.88-1)0.1 ± 0.040.19 ± 0.03< 0.001Albumin-to-PC aa C36:30.997 (0.967-1)0.17 ± 0.070.35 ± 0.06< 0.001Albumin-to-PC aa C36:40.963 (0.87-1)0.14 ± 0.060.29 ± 0.06< 0.001Albumin-to-PC ae C36:10.983 (0.933-1)3.2 ± 1.026.12 ± 1.05< 0.001Albumin-to-PC ae C36:20.993 (0.958-1)1.75 ± 0.553.41 ± 0.67< 0.001Albumin-to-PC ae C38:30.977 (0.907-1)6.55 ± 2.3812.34 ± 2.17< 0.001Albumin-to-PC ae C40:30.997 (0.97-1)28.84 ± 7.4650.53 ± 8.3< 0.001Albumin-to-SM C16:00.977 (0.92-1)0.35 ± 0.080.6 ± 0.1< 0.001Ratios are presented as mean ± standard deviation (before normalization). ROC analysis was performed on log10-transformed and Pareto-scaled data. Parameters shown represent selected biomarker ratios of interest. ROC p-values refer to testing AUC against 0.5 and are not adjusted for multiple testing. Marker selection and ROC performance estimation were conducted within the same dataset without internal validation. Due to the exploratory nature of the analysis and the limited sample size of the FPLE group, AUC values illustrate discriminatory potential rather than establish diagnostic thresholds and require confirmation in independent cohorts.
Fig. 5. Univariate ROC analysis. Exemplary ROC curve for the albumin-to-PC ae C40:3 ratio illustrating exploratory discriminatory performance between FPLE and non-PLE Fontan patients. Marker nomination and performance estimation were performed within the same dataset without internal validation.
Targeted ELISA analysis highlights vascular and inflammatory pathways
Targeted ELISA analyses revealed distinct patterns of circulating proteins associated with vascular and inflammatory pathways. VEGF-A, a key regulator of angiogenesis, was significantly elevated in both F and FPLE groups (p = 0.0039). sVCAM-1, an adhesion molecule facilitating leukocyte migration and a marker of vascular inflammation, was markedly increased in FPLE and F (p < 0.0005). A comprehensive overview of all ELISA results is provided in Fig. 6.
Fig. 6. Group-wise comparison of selected biomarkers measured by enzyme-linked immunosorbent assays (ELISAs). Data for Fontan patients without PLE (red), Fontan patients with PLE (green), and biventricular controls with d-TGA (blue) are shown as violin plots. Statistically significant differences are indicated by asterisks (*).
Discussion
Summary of key results
In this study cohort, PLE was associated with a distinct and internally consistent metabolic and biomarker profile. Univariate analyses identified robust FDR-significant alterations in markers of protein metabolism and immunoglobulin homeostasis, including elevated fecal alpha-1-antitrypsin and reduced serum total protein, albumin, IgG, and IgA. Beyond protein loss, PLE was characterized by activation of renal-neurohormonal regulation, with elevated renin, aldosterone, and copeptin levels compared with Fontan patients without PLE. In parallel, group-specific alterations in lipid metabolism were observed, including differences in multiple glycerophospholipid species, cholesterol, and triacylglycerols, suggesting a broader disturbance of lipid homeostasis associated with FPLE. Adjusted multivariate linear models demonstrated that group status (FPLE vs. F) accounted for the majority of variability in key biomarker ratios, independent of sex, body surface area, and diuretic therapy. Exploratory multivariate analyses further supported these findings by revealing lipid- and bile acid-related metabolic patterns associated with the FPLE phenotype. Together, these results delineate a coherent metabolic phenotype of PLE in the Fontan circulation, integrating disturbances in protein homeostasis, renal-neurohormonal regulation, and lipid-associated metabolic pathways.
Metabolic characterization of PLE in Fontan circulation
The management of PLE in Fontan patients remains a growing clinical challenge, and early identification of patients at risk is limited by an incomplete understanding of the underlying pathophysiology. In this study, targeted metabolomics combined with routine laboratory parameters was used to characterize metabolic alterations associated with PLE. Previous studies have reported proteomic and metabolomic changes in clinically stable Fontan patients, including alterations in immune system activation and cardiovascular development^16,17,29^. Our findings confirm these systemic metabolic disturbances in Fontan circulation and extend them by identifying a pattern that is specific to patients with PLE, integrating protein loss, activation of renal-neurohormonal regulatory systems (RAAS/vasopressin), and lipid dysregulation. While hepatic impairment was present in both Fontan groups, FPLE patients demonstrated a more pronounced disturbance of protein and lipid metabolism, altered bile acid profiles, and signs of neuroendocrine activation. This constellation suggests that PLE is not an isolated intestinal phenomenon but rather reflects coordinated dysfunction across hepatic, lymphatic, renal, and endocrine systems.
Adjusted associations of composite biomarker ratios
As diuretic therapy was significantly more frequently used in Fontan patients with PLE and may influence renal-neurohormonal regulation (RAAS/vasopressin), diuretic use was considered a potential confounder in the interpretation of composite biomarker ratios. The higher prevalence of diuretic treatment in this group is clinically plausible as diuretics are a core component of symptomatic therapy in patients with PLE and more advanced Fontan failure. In this exploratory metabolomic analysis, differences in the IgG-to-aldosterone and albumin-to-PC ae C40:3 ratios between Fontan patients with and without PLE were robust across multiple model specifications. Importantly, these group differences persisted after adjustment for diuretic therapy and key clinical covariates, indicating that the observed metabolic signatures are unlikely to be primarily driven by pharmacological treatment effects. A numerically lower IgG-to-aldosterone ratio in patients receiving diuretics is biologically plausible, given the well-established activation of RAAS under diuretic therapy in other clinical settings^30^. However, the absence of a statistically significant association and the persistence of group effects after adjustment argue against a dominant treatment-driven mechanism in the present cohort. The contrast between low marginal R² values for fixed clinical covariates and high conditional R² values in the mixed-effects models suggests that PLE status itself represents the principal source of variability in these composite markers. This supports the interpretation that the investigated ratios capture disease-specific pathophysiological processes rather than general disease severity, body size, or treatment burden. Nonetheless, the limited number of patients with PLE and the wide confidence intervals underscore the exploratory nature of these findings and the need for confirmation in larger, independent cohorts.
Protein loss, inflammation, and vascular pathways
Consistent with the AHA definition of PLE^7^, FPLE demonstrated pronounced hypoalbuminemia, hypogammaglobulinemia, and elevated fecal alpha-1-antitrypsin, reflecting substantial systemic protein loss. Although fecal calprotectin was not significantly elevated, its high interindividual variability may have masked subtle inflammatory differences^31^.
Beyond protein depletion, our data highlight the involvement of angiogenic and inflammatory vascular pathways. VEGF-A, a mediator of angiogenesis as well as endothelial permeability and inflammation, was elevated in both Fontan groups, consistent with previous reports in Fontan patients^16^. While adhesion molecules that facilitate leukocyte recruitment and intercellular interactions, such as sICAM-1 and sVCAM-1 were increased particularly in patients with FPLE, indicating enhanced systemic endothelial activation. Given established associations of sVCAM-1 with adverse outcomes in heart failure these findings suggest that vascular inflammation and endothelial remodeling may potentially contribute to disease severity and systemic manifestations of PLE^18^.
Amino acids as markers of systemic metabolic stress
PLE was associated with distinct alterations in circulating amino acid profiles, most notably reduced histidine and elevated ornithine concentrations that remained significant after FDR correction. Ornithine, a central intermediate of the urea cycle and precursor of spermidine, reflects hepatic amino acid handling and nitrogen disposal, and its elevation is consistent with increased amino acid catabolism under conditions of chronic protein loss and systemic stress^32^. While spermidine, known for its pro-inflammatory effects particularly in the gut, showed a numerical increase in FPLE, this difference did not remain significant after FDR correction and should therefore be interpreted cautiously^33^. Reduced histidine concentrations are of particular interest given histidine’s emerging role in immune regulation, oxidative stress modulation, and cardiovascular homeostasis^34^. Beyond its function as a proteinogenic amino acid, histidine availability has been linked to chronic inflammatory states and adverse cardiometabolic profiles, reflecting increased metabolic consumption rather than simple nutritional deficiency^35,36^. As the precursor of histamine, histidine contributes to myocardial stress responses, and experimental as well as clinical data suggest cardioprotective effects of intact histidine-histamine signalling pathways^37,38^. In the context of FPLE, the combination of reduced histidine and elevated ornithine points toward coordinated alterations in amino acid handling, consistent with enhanced nitrogen turnover and hepatic metabolic stress rather than isolated gastrointestinal protein loss^39,40^.
Hepatic involvement and Fontan-associated liver disease
Markers associated with hepatocellular injury differed between groups, with GGT, ALT, and GLDH being elevated in patients with FPLE and, to a lesser extent, in Fontan patients without PLE compared to controls. While classical transaminases and markers of hepatocellular injury did not consistently indicate overt liver damage, GGT emerged as the most robust liver-associated parameter distinguishing FPLE from non-PLE patients. This observation aligns with data from adult Fontan cohorts, in which standard liver function tests may remain within reference ranges despite ongoing hepatic congestion, metabolic strain, and the risk of developing Fontan-associated liver disease (FALD)^41^.
Although the present cross-sectional design precludes inference on temporal relationships, the observed pattern supports the concept that hepatic metabolic stress accompanies - and may precede - overt manifestations of PLE. Importantly, these alterations should not be interpreted as evidence of advanced hepatobiliary disease but rather as biochemical indicators of systemic and circulatory stress inherent to Fontan physiology^42^.
Distinct lipidomic signatures and systemic metabolic stress
Consistent with prior reports, Fontan patients without PLE exhibited hypocholesterolemia compared with controls^43^. In contrast, patients with PLE showed higher cholesterol and triacylglycerol levels, suggesting a protein-loss-associated dyslipidemia that has not been systematically characterized in this population. Although apolipoproteins were not measured, the combination of lipid accumulation and protein loss may indicate altered lipid transport or clearance pathways^44,45^. Among glycerophospholipids, multiple phosphatidylcholine species differed significantly between groups and contributed to albumin-based composite ratios. These findings suggest that PLE-associated metabolic disturbances preferentially affect protein and glycerophospholipid handling rather than membrane lipid composition or mitochondrial fatty acid oxidation. In line with this, sphingolipids and acylcarnitines did not differ significantly between groups^46–50^.
Bile acids, renal–neurohormonal regulation, and neuroendocrine stress
To aid interpretation of the complex metabolic dataset, exploratory correlation analyses were used to contextualize associations between bile acids, lipid species, and markers of renal-neurohormonal regulation (RAAS/vasopressin). Exploratory correlation analyses revealed preferential associations between bile acids, renin, and selected phosphatidylcholines in patients with PLE. Taken together, these patterns are consistent with an integrative hepato-renal-metabolic axis, reflecting coordinated metabolic stress across hepatic, renal, and lipid regulatory pathways rather than a defined mechanistic relationship. Alterations in bile acid profiles were among the most prominent features differentiating FPLE from non-PLE Fontan patients. Reduced levels of conjugated bile acids and their associations with renin and phosphatidylcholines suggest disruption of bile acid synthesis or trafficking in the setting of protein loss. Bile acids are increasingly recognized as signalling molecules influencing vascular tone, inflammation, and water homeostasis^51^, providing a potential mechanistic link between hepatic metabolism and renal–neurohormonal activation (RAAS/vasopressin)^52^.
Marked elevation of copeptin, a stable surrogate of vasopressin, supports activation of central neuroendocrine stress pathways in FPLE^53^. Together with increased renin and aldosterone levels, this pattern underscores pronounced renal–neurohormonal regulation and systemic homeostatic stress as defining features of the PLE phenotype. Vasopressin-mediated effects on fluid balance and vascular tone are consistent with key clinical characteristics of PLE in Fontan physiology, including volume imbalance and circulatory vulnerability. In this context, elevated copeptin is best interpreted as an integrative indicator of renal–neurohormonal activation rather than a disease-specific or standalone biomarker.
Limitations and future directions
This study is limited by its observational design, modest cohort size, and the relatively small number of patients with PLE. Given these constraints, most analyses were necessarily unadjusted and exploratory in nature, and the observed associations may therefore be influenced by confounding related to clinical characteristics, disease severity, and treatment-related factors. In particular, detailed information on dietary intake and disease-specific nutritional interventions - which may influence lipid metabolism and bile acid profiles - was not systematically available and could therefore not be accounted for. Metabolomic, multivariate, and ROC analyses were also exploratory, and no internal validation procedures were applied; therefore, confirmation in independent cohorts will be essential to establish robustness and clinical utility.
From a systems-level perspective, the findings generate hypotheses regarding coordinated dysfunction across hepatic, lymphatic, renal, and renal–neurohormonal regulatory systems (RAAS/vasopressin) in Fontan-associated PLE. Alterations in bile acid profiles, potentially influenced by gut microbiome composition and intestinal barrier integrity, may represent one component of this integrated metabolic stress response. Future prospective studies combining longitudinal metabolomics with inflammatory markers, hemodynamic assessments, targeted endocrine profiling, and advanced hepatic and lymphatic imaging will be required to clarify temporal relationships, validate candidate biomarkers, and assess prognostic relevance.
Future studies should include prespecified marker selection and independent validation to assess generalizability and clinical relevance of candidate biomarker ratios identified in this exploratory analysis.
Conclusion
Pediatric Fontan patients with PLE exhibit a distinct metabolic phenotype characterized by systemic protein loss, dyslipidemia, renal-neurohormonal activation (RAAS/vasopressin), altered amino acid handling, and bile acid disturbances. These findings indicate that metabolic alterations in FPLE extend beyond intestinal protein loss and reflect coordinated dysfunction across hepatic and endocrine regulatory systems. Composite metabolite ratios represent promising candidate markers for the identification and monitoring of PLE and warrant validation in larger, independent Fontan cohorts.
Supplementary Information
Below is the link to the electronic supplementary material.
Supplementary Material 1
Supplementary Material 2
Supplementary Material 3
Supplementary Material 4
Supplementary Material 5
The reference list from the paper itself. Each links out to its DOI / PubMed record.
- 1Baker, D. W. et al. Path ahead for ‘low risk’ adolescents living with a Fontan circulation. Heart (2020).10.1136/heartjnl-2020-31761933229361 · doi ↗ · pubmed ↗
- 2Rychik, J. et al. Evaluation and Management of the Child and Adult With Fontan Circulation: A Scientific Statement From the American Heart Association. Circulation. :Cir 0000000000000696. (2019).10.1161/CIR.000000000000069631256636 · doi ↗ · pubmed ↗
- 3Mc Dowell, K. et al. Cellular adhesion molecules and adverse outcomes in chronic heart failure: findings from the DAPA-HF randomized clinical trial. JAMA Cardiol.10(8), 797-808 (2025).10.1001/jamacardio.2025.1592 PMC 1213880140465275 · doi ↗ · pubmed ↗
- 4Team, R. C. R: A Language and Environment for Statistical Computing (R Foundation for Statistical Computing, 2023).
- 5Michel, M. et al. Altered serum proteins suggest Inflammation, fibrogenesis and angiogenesis in adult patients with a Fontan circulation. Int. J. Mol. Sci.25(10). (2024).10.3390/ijms 25105416 PMC 1112181838791454 · doi ↗ · pubmed ↗
- 6Madeo, F., Eisenberg, T., Pietrocola, F. & Kroemer, G. Spermidine in health and disease. Science 359(6374). (2018).10.1126/science.aan 278829371440 · doi ↗ · pubmed ↗
- 7Holeček, M. Histidine in health and disease: Metabolism, physiological Importance, and use as a supplement. Nutrients 12(3). (2020).10.3390/nu 12030848 PMC 714635532235743 · doi ↗ · pubmed ↗
- 8Moro, J. et al. A systematic review on metabolism and physiological effects in human and different animal species. Nutrients 12(5). (2020).10.3390/nu 12051414 PMC 728487232423010 · doi ↗ · pubmed ↗