Author Correction: Oral vaccination stimulates neutrophil functionality and exerts protection in a Mycobacterium avium subsp. paratuberculosis infection model
Iraia Ladero-Auñon, Elena Molina, Maddi Oyanguren, Diego Barriales, Miguel Fuertes, Iker A. Sevilla, Lucy Luo, Rakel Arrazuria, Jeroen De Buck, Juan Anguita, Natalia Elguezabal

Abstract
Genes, proteins, chemicals, diseases, species, mutations and cell lines named across the full text — each resolved to its canonical identifier and authoritative record.
Click any figure to enlarge with its caption.
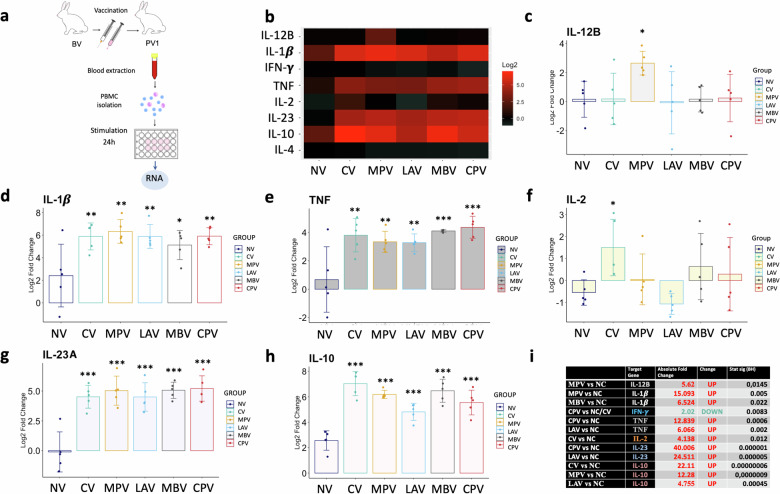 Figure 1
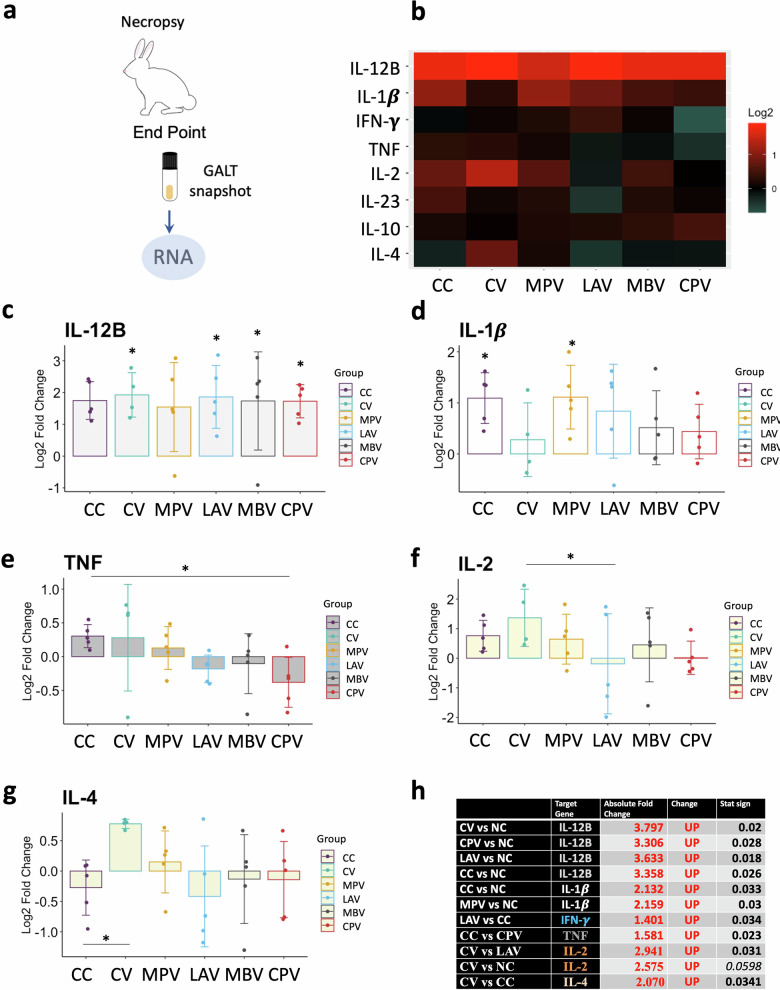 Figure 2
Peer Reviews
No public reviews on file for this paper yet. If you reviewed it on a platform where reviews are public (OpenReview, ICLR, NeurIPS, ICML), you can paste yours below so the community can read it here.
Videos
No videos yet. Explain this paper in a talk, walkthrough, or lecture? Add one.
Taxonomy
TopicsMycobacterium research and diagnosis · Tuberculosis Research and Epidemiology · Immune responses and vaccinations
Correction to: npj Vaccines 10.1038/s41541-021-00367-8, published online 12 August 2021
In the original Article, Figure 7 was inadvertently published twice, appearing also as Figure 8. The correct Figure 8 and its corresponding figure legend is provided below. The original Article has been corrected.
Incorrect Figure 8
Incorrect Figure 8 legend:
Cytokine relative quantification by RT-qPCR in GALT at the end point of the experiment of all challenged groups relative to the NC. a Schematic representation of sample origin. b Heatmap representation of the average expression of cytokines; in red upregulated and in green downregulated gene expression. Bar charts showing log2 fold change between groups. c IL-12B, d IL-1β, e TNF, f IL-2, g IL-23A, h IL-10, i Table summarizing significant differences between groups in cytokine expression and the Absolute Fold Change Factor. All values were means with error bars representing standard deviation from groups of n = 5, except for NC which was n = 4. ANOVA with Tukey’s post-host test was applied and signification levels are *p < 0.05, **p < 0.01, ***<0.001.
Correct Figure 8
Corrected Figure 8 legend:
Cytokine relative quantification by RT-qPCR in GALT at the end point of the experiment of all challenged groups relative to the NC. a Schematic representation of sample origin. b Heatmap representation of the average expression of cytokines; in red up-regulated and in green down-regulated gene expression. Bar charts showing log2 fold change between groups. c IL-12B, d IL-1b, e TNF, f IL-2, g IL-4, h table summarizing significant differences between groups in cytokine expression and the Absolute Fold Change Factor. All values were means with error bars representing standard deviation from groups of n = 5, except for NC which was n = 4. ANOVA with Tukey’s post-host test was applied and signification levels are *p <0.05, **p <0.01, ***p <0.001.