Immune dysregulation through longitudinal lymphocyte trajectories and their clinical determinants in hospitalized COVID-19 patients
José Pedro Cidade, Fabio Silvio Taccone, Luis Felipe Reyes, Laura Merson, Benjamin Lefevre, Barbara Wanjiru Citarella, Arie Zainul fatoni, Pedro Póvoa, Luis Felipe Reyes, Luis Felipe Reyes, Laura Merson, Barbara Wanjiru Citarella, Sabriya Abdalasalam, Alaa Abdalfattah Abdalhadi

TL;DR
This study tracks lymphocyte levels over time in hospitalized COVID-19 patients to understand immune dysregulation and its link to poor outcomes.
Contribution
The study introduces longitudinal analysis of lymphocyte trajectories and their clinical determinants in large populations of hospitalized COVID-19 patients.
Findings
Lymphopenia was independently associated with higher ICU admission rates and in-hospital mortality.
Corticosteroid use was linked to prolonged lymphopenia and impaired recovery.
Age, sex, and corticosteroid exposure were significant predictors of lymphocyte trajectory dynamics.
Abstract
Immune dysregulation plays a pivotal role in the pathophysiology of sepsis and COVID-19, with lymphopenia emerging as a consistent marker of severity and poor prognosis. However, most existing studies have assessed lymphocyte counts at isolated time points, limiting insights into their temporal behavior and prognostic value. The dynamics of lymphocyte recovery or persistence of lymphopenia remain largely unexplored in large populations, as well as the impact of adjunctive therapies such as corticosteroids. We hypothesized that the persistence or recovery of lymphopenia may be key to understanding disease progression and predicting outcomes. Using the multinational ISARIC cohort, we investigated longitudinal lymphocyte trajectories in hospitalized patients and the clinical determinants associated with their evolution over time. We conducted a multinational prospective observational…
Genes, proteins, chemicals, diseases, species, mutations and cell lines named across the full text — each resolved to its canonical identifier and authoritative record.
Click any figure to enlarge with its caption.
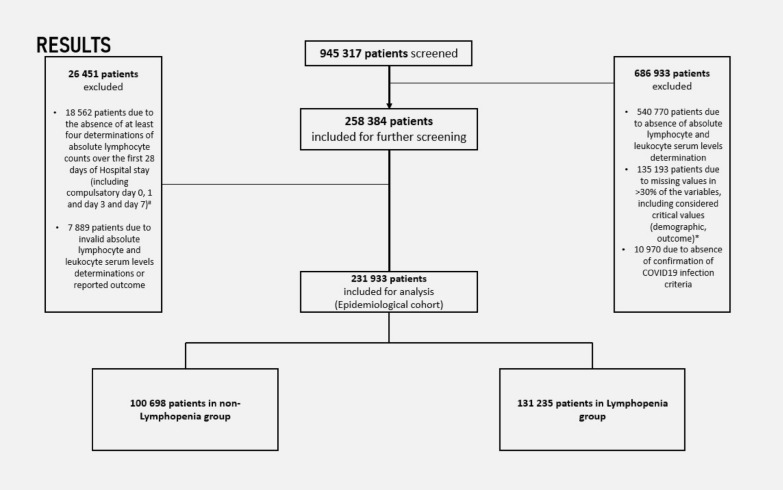 Figure 1
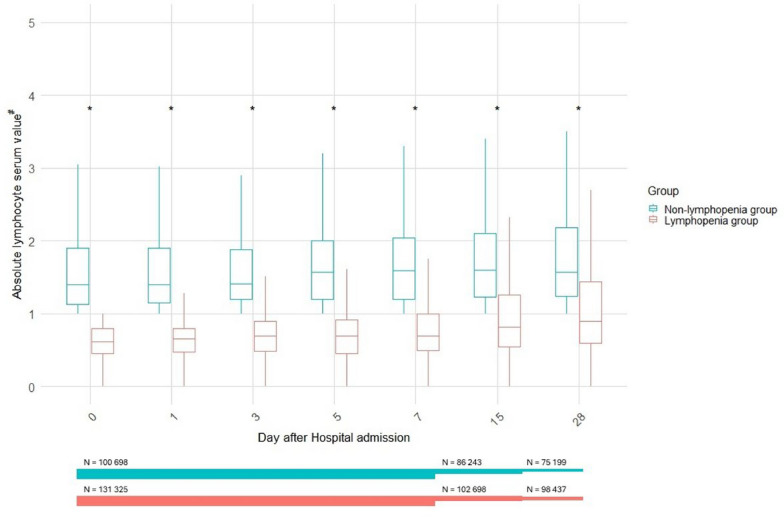 Figure 2
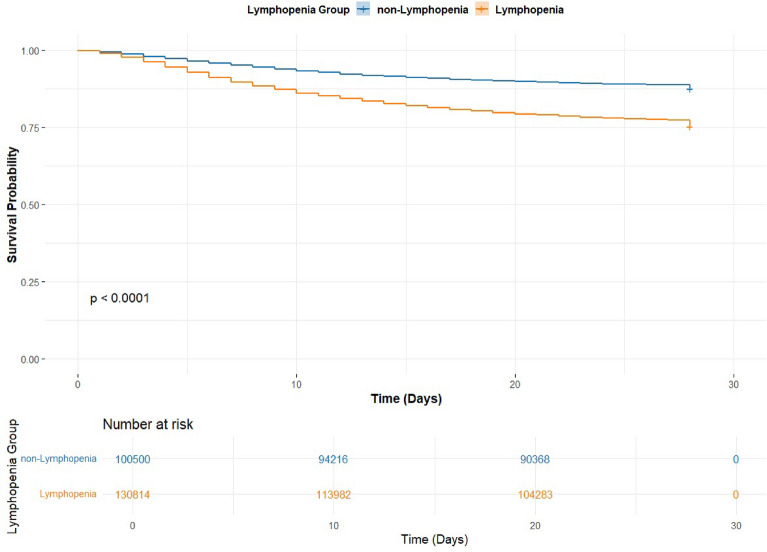 Figure 3
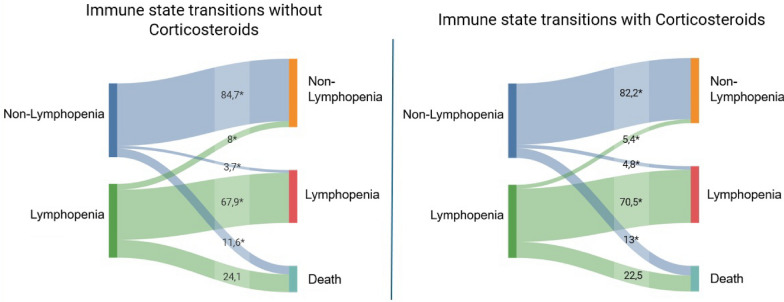 Figure 4
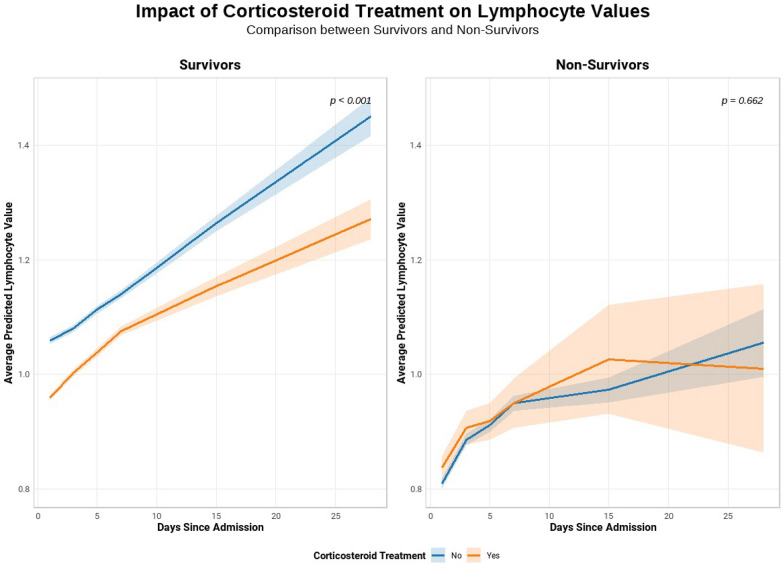 Figure 5
Peer Reviews
No public reviews on file for this paper yet. If you reviewed it on a platform where reviews are public (OpenReview, ICLR, NeurIPS, ICML), you can paste yours below so the community can read it here.
Videos
No videos yet. Explain this paper in a talk, walkthrough, or lecture? Add one.
Taxonomy
TopicsCOVID-19 Clinical Research Studies · Immune responses and vaccinations · Sepsis Diagnosis and Treatment
Introduction
Immune dysfunction has gained prominence as a key area of interest in the pathophysiology of sepsis, with compelling evidence linking the profound derangement in the host inflammatory response to clinical outcomes [1, 2]. Our long-standing view of a universal immune activation response towards infection has been fundamentally redefined. Recent evidence clearly suggests a far more dynamic and heterogeneous biological mechanism, with septic patients transitioning from early hyperinflammation and cytokine release to a state of immune paralysis, usually persisting or fluctuating, in and out of an immunosuppressive phase [3–7]. This complexity is potentially correlated with a wide variability in outcomes among septic patients, prompting increasing interest in immunophenotypes and distinct immune response patterns, despite similar infectious insults [8, 9]. The COVID-19 pandemic intensified focus on this paradigm, revealing striking interindividual differences in disease trajectories despite a common viral insult. This variability has exposed the limitations of our current understanding of immune dynamics over time.
Among the various immunological alterations observed in COVID-19 and other causes of sepsis, lymphopenia has consistently emerged as a unique biological marker of disease severity and poor prognosis [10]. Absolute lymphocyte counts below 1 × 10^9^ cells/L have been repeatedly associated with increased risk of organ failure, need for organ support, and mortality. However, most existing studies have relied on single time-point measurements, limiting our understanding of the dynamics of lymphocyte recovery or persistence of immune suppression [11–15]. A recent meta-analysis by Elçioğlu et al*.* demonstrated consistently higher in-hospital mortality rates, both early and late, across fifteen observational studies, arguing that longitudinal immune trajectories may provide greater insight into clinical outcomes [16]. Yet, whether lymphopenia reflects a transient epiphenomenon, a marker of adaptive exhaustion, or a surrogate of immune failure remains unclear, particularly when evaluated outside of its temporal context [17].
Despite consistent associations between lymphopenia and adverse outcomes in critical illness, the temporal dimension of lymphocyte trajectories remains poorly understood. As such, the prognostic implications of lymphocyte dynamics, whether as markers of immune recovery or ongoing dysfunction, remain largely unexplored. In this context, we aimed to assess the prognostic value of lymphocyte trajectories over time. Leveraging the International Severe Acute Respiratory and Emerging Infection Consortium (ISARIC) COVID-19 database, one of the largest standardized, multinational cohorts of hospitalized patients, we conducted a comprehensive analysis of hospitalized COVID-19 patients with serial lymphocyte counts. We aimed to describe the presence of lymphopenia in these patients and assess its persistence, resolution, or fluctuation over time, exploring how dynamic patterns relate to clinical outcomes, as well as the impact of adjunctive therapies such as corticosteroids.
Methods
This study is a prospective observational cohort study of hospitalized patients from five continents. The study Consortium framework is provided by the International Severe Acute Respiratory and Emerging Infection (ISARIC)—World Health Organization (WHO) Clinical Characterization Protocol for Severe Emerging Infections [18, 19]. The protocol, case report forms, consent forms, and study information are available on the ISARIC website (https://isaric.org). This standardized protocol uses tiered data collection tailored to a range of resource settings. Investigators from 69 countries collected prospective data using the ISARIC case report form (CRF) built on Research Electronic Data Capture (REDCap, version 8.11.11, Vanderbilt University, Nashville, Tenn.) [20] hosted by the University of Oxford. Other investigators collected data using locally hosted systems and submitted it to the ISARIC dataset for centralized mapping. All investigators retain full rights to their data.
This observational study required no change to clinical management and encouraged patient enrolment in other research projects. The ISARIC-WHO Clinical Characterization Protocol was approved by the World Health Organization Ethics Review Committee (RPC571 and RPC572). Also, local ethics approval was obtained for each participating country and site according to local requirements.
Study population
We included all adult patients hospitalized with confirmed SARS-CoV-2 infection, defined by clinical and radiological criteria (i.e., symptoms and findings of SARS-CoV-2 pneumonia seen in thoracic diagnostic images) and/or a positive reverse transcription-polymerase chain reaction (RT-PCR) result from a respiratory sample. Eligible patients had to be biochemically characterized during hospitalization, with available data on absolute lymphocyte and leukocyte counts. Patients with > 30% missing data in variables deemed critical for analysis were excluded (see the Electronic Supplementary Material [ESM] for further details).
To ensure a meaningful assessment of lymphocyte dynamics, we excluded patients who lacked data for at least four absolute lymphocyte count measurements during the first 28 days of hospitalization. These measurements were required to include values from days 0, 1, 3, and 7, allowing consistent evaluation of early immune trajectories during the critical initial phase of the septic process and ensuring that lymphocyte counts were obtained at standardized time points across all patients. Patients with implausible values for these variables or with missing outcome data were also excluded. Censoring due to early discharge or death was handled by including all available data up to the time of censoring, ensuring that incomplete follow-up did not bias the estimation of early lymphocyte dynamics.
Data collection and definitions
Demographic, clinical, and biochemical data were extracted from the electronic case report forms (eCRFs), including age, sex, comorbidities, country income classification (per World Bank definitions: https://data.worldbank.org/country), vital signs at admission, laboratory values during hospitalization, need for advanced organ support (mechanical ventilation, vasopressors, renal replacement therapy), systemic complications, and treatments administered during hospitalization. All study variables were predefined in the ISARIC study protocol and case report form completion guide is available online (https://isaric.org).
The resulting analytic cohort is referred to as the Epidemiological cohort. Patients were further stratified based on the development of lymphopenia, defined as at least one absolute lymphocyte count < 1 × 10⁹ cells/L during hospitalization [10, 21]. Patients with no such values were classified in the non-lymphopenia group. For all analyses, day 0 was considered the day of hospital admission.
Outcomes
The primary outcome evaluated in this study was 28-day all cause in-hospital mortality. Secondary outcomes included the rate and risk factors for Lymphopenia development, rate of advanced organ support requirements during the hospitalization episode (i.e. mechanical ventilation, vasopressor support or renal replacement therapy), the rate of ICU admission, the ICU and hospital all-cause mortalities and the impact of corticosteroids on lymphocyte trajectories and remaining outcomes.
Statistical methods
Data was expressed as mean (standard deviation [SD]), if normally distributed, and non-normally distributed variables as median (interquartile range [IQR]). Categorical variables were expressed as numbers and percentages. Chi-square test was used for categorical variables, and t-test and Kruskal–Wallis were used on continuous variables for statistical assessment of outcomes between groups. Initially, we performed univariate analysis of demographic, comorbidities, clinical presentation, biochemical characterization, complications and outcomes between Lymphopenia and non-Lymphopenia cohorts. Absolute lymphocyte counts distribution over time was also obtained to compare the cohorts.
Survival analysis was performed using Kaplan–Meier curves with log-rank tests to compare 28-day survival across lymphocyte-defined groups. Multivariable Cox proportional hazards models evaluated the association between continuous lymphocyte counts and mortality, adjusting for age, sex, corticosteroid treatment, and organ support interventions (vasopressors/inotropes, renal replacement therapy, invasive and non-invasive ventilation). Proportional hazards assumptions were verified.
Additionally, we conducted a multivariable logistic regression to assess associations between lymphopenia status (based on longitudinal lymphocyte thresholds) and all-cause in-hospital mortality, adjusting for the same covariates. Model discrimination and calibration were evaluated.
To analyze transitions between the non-lymphopenic and lymphopenic states and the risk of death, we fitted a continuous-time, time-homogeneous multistate Markov model using Aalen-Johansen estimation. This approach allowed estimation of transition probabilities over time, capturing competing risks and intermediate transitions, and was adjusted for age and gender. An additional analysis including corticosteroid therapy as a covariate was performed subsequently. A diagram of the multistate analysis is presented in the Methods section of the ESM.
To jointly assess lymphocyte dynamics and mortality in relation to corticosteroid treatment, a joint modeling approach combined a linear mixed-effects model for longitudinal lymphocyte counts with a Cox survival model. Corticosteroid treatment was included as a time-varying covariate. Models were adjusted for relevant clinical variables, organ support requirements (respiratory, hemodynamic and renal) and demographic factors.
Statistical analyses were performed using R version 4.4.0 (R Foundation for Statistical Computing, Vienna, Austria) with packages survival, lme4 and JMbayes2. A two-sided p-value < 0.05 was considered statistically significant.
Results
A total of 945,317 patients were initially screened for inclusion. Among these, 686,933 were excluded due to the absence of valid absolute lymphocyte and leukocyte determinations, high rate of missing values or absence of confirmation of required COVID-19 infection criteria. After applying exclusion criteria, 26,451 patients were removed, resulting in a final cohort of 231,933 patients (as depicted in Fig. 1). Of these, 100,698 patients (43.4%) were classified into the non-Lymphopenia group, while 131,235 patients (56.6%) were categorized in the Lymphopenia group.Fig. 1. Patient selection Diagram using STROBE requirements. * Considered critical variables are further characterized in the ESM; # Day 0 was defined as the day of hospital admission. Required days D0, D1, D3 and D7 correspond to days after hospital admission
Patients’ demographic, treatment and outcome characteristics
Patient characteristics are detailed in Table 1. The groups presented significantly different demographic and clinical characteristics, with Lymphopenia group being composed of older patients, with a male preponderance and consistently higher rates of comorbidities and complications during Hospital stay. Patients in the Lymphopenia group also required higher rates of ICU admission and longer lengths of respiratory support (invasive mechanical ventilation) along with longer lengths of ICU and Hospital stay. We also documented higher all-cause mortality rates, either at ICU or in-Hospital, in the Lymphopenia group when compared to non-Lymphopenia group patients (Table 1). Figure 2 illustrates the longitudinal distribution of absolute lymphocyte serum values across Day 0 to Day 28 stratified by lymphopenia status. Patients classified in the Lymphopenia group consistently exhibited significantly lower lymphocyte counts at every measured time point compared to the non-Lymphopenia group (p < 0.05 for all days). This persistent lymphopenia was evident despite the general upward trend in lymphocyte values observed over time in both groups.Table 1. Demographic, clinical, treatment and outcome characteristics stratified by lymphopenia groupsVariableNon-Lymphopenia (n = 100,698)Lymphopenia (n = 131,235)p-valueDemographic Variables Age, years (median [IQR])60.0 [43.0, 76.0]69.0 [55.0, 80.0]** < 0.001** Gender, males (%)51,834 (51.5)79,285 (60.4)** < 0.001** Height (cm), Median [IQR]168.0 [161.0, 175.0]170.0 [163.0, 175.0]** < 0.001** Weight (kg), Median [IQR]75.0 [54.0, 90.0]76.0 [60.0, 90.0]0.410Comorbidities** < 0.001** HIV/AIDS653 (0.8%)562 (0.5%) Asthma12,102 (13.6%)15,338 (13.0%) Chronic Cardiac Disease19,958 (21.9%)33,659 (27.7%) Chronic Hematological Disease2,782 (3.1%)5,216 (4.5%) Chronic Kidney Disease9,905 (11.1%)18,518 (15.5%) Chronic Neurological Disorder8,592 (9.6%)11,610 (9.9%) Chronic Pulmonary Disease11,301 (12.4%)19,704 (16.3%) Dementia7,884 (8.8%)11,635 (9.8%) Diabetes23,275 (25.8%)31,204 (26.1%) Hypertension31,899 (39.0%)48,248 (46.1%) Immunosuppression1,272 (3.1%)3,069 (5.1%) Liver Disease2,768 (3.0%)3,897 (3.2%) Malignant Neoplasm6,119 (6.8%)12,958 (10.8%) Malnutrition1,426 (1.7%)2,089 (1.9%) Obesity13,738 (16.8%)17,678 (16.5%) Other Comorbidities35,202 (45.4%)50,732 (48.9%) Rare Diseases/Inborn Errors of Metabolism295 (0.7%)320 (0.5%) Rheumatologic Disorder8,254 (9.3%)12,635 (10.8%) Smoking22,382 (38.9%)32,512 (43.6%) Transplantation468 (1.1%)1,217 (2.0%) Tuberculosis46 (0.5%)71 (0.5%) Pregnancy2,471 (12.7%)1,648 (11.0%)Symptoms at hospital admisssion** < 0.001** Abdominal Pain (%)7822 (10.0)9510 (9.3) Altered Consciousness/Confusion (%)13,259 (17.7)22,477 (21.2) Asymptomatic (%)2386 (4.6)1973 (2.7) Bleeding (%)1407 (1.8)1735 (1.7) Chest Pain (%)13,443 (17.0)14,960 (14.4) Conjunctivitis (%)327 (0.4)374 (0.4) Cough (%)49,945 (58.7)76,617 (67.1) Diarrhoea (%)12,996 (16.2)19,947 (18.8) Ear Pain (%)305 (0.5)312 (0.4) Fatigue/Malaise (%)29,943 (38.7)46,663 (45.7) Headache (%)9787 (13.1)11,586 (11.8) History of Fever (%)44,881 (53.2)73,516 (64.8) Lost/Altered Sense of Smell (%)5255 (8.1)6014 (7.5) Lost/Altered Sense of Taste (%)5801 (9.2)7420 (9.5) Lymphadenopathy (%)366 (0.5)486 (0.5) Muscle Aches/Joint Pain (%)13,836 (18.6)19,434 (19.8) Runny Nose (%)2710 (3.8)2606 (2.8) Seizures (%)1038 (1.4)1084 (1.1) Severe Dehydration (%)4308 (11.1)7032 (13.9) Shortness of Breath (%)50,301 (58.9)81,392 (70.6) Skin Rash (%)1639 (2.2)2362 (2.4) Sore Throat (%)5747 (7.9)6506 (6.9) Vomiting/Nausea (%)15,177 (19.0)20,961 (19.9) Wheezing (%)4550 (6.0)7141 (7.3)Complications during hospital stay** < 0.001** Acute Kidney Injury (%)10,223 (12.4)20,689 (18.4) Anemia (%)8833 (10.7)18,178 (16.3) ARDS (%)7481 (9.1)18,587 (16.8) Bacteremia (%)2370 (2.9)6134 (5.5) Bacterial Pneumonia (%)8590 (10.6)17,623 (16.2) Bleeding (%)17 (0.8)13 (0.9) Cardiac Arrest (%)1549 (1.9)3731 (3.4) Cardiac Arrhythmia (%)4450 (5.6)8883 (8.4) Cardiac Ischemia (%)901 (1.1)1690 (1.5) Cardiomyopathy (%)273 (0.4)593 (0.6) Coagulation Disorder (%)2673 (3.3)5628 (5.1) Congestive Heart Failure (%)1818 (2.2)3629 (3.3) Cryptogenic Organizing Pneumonia (%)250 (0.3)644 (0.6) Deep Vein Thrombosis (%)281 (0.7)445 (0.8) DIC (%)2 (0.8)0 (0.0) Endocarditis (%)48 (0.4)86 (0.4) GI Bleeding (%)919 (1.1)1538 (1.4) Hemodynamic Decompensation (%)159 (8.1)178 (12.8) Hyperglycemia (%)8259 (10.1)15,559 (14.1) Liver Dysfunction (%)4902 (6.0)9333 (8.4) Meningitis/Encephalitis (%)172 (0.2)249 (0.2) Myocardial Infarction (%)98 (0.9)217 (1.2) Neurological Complication (%)1351 (2.5)2136 (2.8) Other Complications (%)17,013 (23.1)27,324 (26.8) Pleural Effusion (%)3227 (3.9)6809 (6.1) Pneumothorax (%)754 (0.9)2121 (1.9) Pulmonary Embolism (%)1736 (3.5)2929 (4.1) Pulmonary Embolism/DVT (%)34 (12.5)86 (15.0) Rhabdomyolysis (%)341 (0.4)762 (0.7) Seizures (%)850 (1.0)961 (0.9) Stroke (%)1130 (1.4)1460 (1.3) Supraventricular Arrhythmia (%)45 (2.2)61 (4.3) Thromboembolism (%)9 (0.8)38 (1.9) Thrombosis (%)84 (4.1)109 (7.7) VAP (%)99 (36.4)264 (46.2) Viral Pneumonia (%)38,493 (47.1)66,165 (59.3)Main outcomes ICU Admission17,183 (17.6%)35,281 (27.7%)** < 0.001** Duration of IMV, days (median [IQR])6.0 [3.0, 12.0]7.0 [4.0, 14.0]** < 0.001** Duration of Prone Ventilation, days (median [IQR])4.0 [2.0, 8.0]4.0 [2.0, 7.0]0.055 Duration of HFNC, days (median [IQR])4.0 [2.0, 7.0]5.0 [3.0, 7.0]0.226 Duration of ECMO, days (median [IQR])9.0 [3.0, 11.5]8.0 [4.0, 13.8]0.756 Duration from Admission to ICU, days (median [IQR])1.0 [0.0, 3.0]1.0 [0.0, 3.0]** < 0.001** Duration from Admission to IMV, days (median [IQR])1.0 [0.0, 5.0]2.0 [0.0, 5.0]** < 0.001** Duration of ICU (median [IQR])7.0 [3.0, 13.0]9.0 [4.0, 17.0]** < 0.001** Duration of Hospital Stay (median [IQR])7.0 [3.0, 13.0]9.0 [4.0, 16.0]** < 0.001In-Hospital outcome Death12,654 (12.6)32,653 (24.9) < 0.001** Discharge74,361 (73.9)79,969 (61.0)** < 0.001** Ongoing Care1,593 (1.6)2,968 (2.3)** < 0.001** Transferred4,975 (4.9)6,684 (5.1)0.124Data is median [IQR] or n (%). DIC Disseminated intravascular coagulation disorder, GI Gastrointestinal, VAP Ventilator-acquired pneumonia, ICU intensive care unit, IMV Invasive mechanical ventilation, HFNC High-flow nasal cannula, ECMO extracorporal membrane oxygenationFig. 2Comparison of absolute lymphocyte count between patients in the Lymphopenia and non-Lymphopenia groups. ^#^Values are expressed in × 10^9^ cells/L
Primary outcomes and survival analysis
The adjusted multivariable Cox proportional hazards regression demonstrated that lower lymphocyte counts were independently associated with increased risk of death (HR = 1.33 per 1 × 10^9^ cells/L, 95% CI 1.28–1.38, p < 0.001). Increasing age (HR = 1.05 per year, 95% CI 1.05–1.06, p < 0.001), male sex (HR = 1.22, 95% CI 1.20–1.24, p < 0.001), corticosteroid use (HR = 1.05, 95% CI 1.03–1.07, p < 0.001) and vasopressor, mechanical ventilation and renal replacement therapy requirements (all p < 0.001) were also significantly associated with increased hazard of death. A forest plot of hazard ratios is presented in Fig. 1 ESM. These results were consistent with the survival estimates by lymphocyte status, illustrated with a Kaplan–Meier curve in Fig. 3, with differences in survival confirmed by the log-rank test (p < 0.001).Fig. 3. Kaplan–Meier survival curves and analysis of cumulative survival, including log-rank test, between Lymphopenia and non-Lymphopenia groups
We also performed a multivariable logistic regression to identify independent predictors associated with the all-cause in-hospital mortality (Table 2). After adjustment for key confounders, lymphopenia status was independently associated with a significantly increased odds of the adverse outcome (OR 1.52, 95% CI 1.48–1.55, p < 0.001). Other significant predictors included advancing age (OR 1.07 per year increase, 95% CI 1.07–1.07, p < 0.001) and male sex (OR 1.29, 95% CI 1.26–1.32, p < 0.001). Use of corticosteroids (OR 1.20, 95% CI 1.17–1.23, p < 0.001) and organ support requirements were also linked to higher odds of the outcome.Table 2. Multivariable logistic regression predicting all-cause in-hospital mortalityVariableOdds Ratio (OR)95% Confidence Intervalp-valueLymphopenia group (yes)1.521.48–1.55 < 0.001Age (years, continuous)1.071.03–1.12 < 0.001Gender (Male)1.291.26–1.32 < 0.001Corticosteroid treatment (yes)1.201.17–1.23 < 0.001Inotropes/Vasopressors requirement (yes)1.391.31–1.47 < 0.001Renal replacement therapy requirement (yes)2.552.38–2.73 < 0.001Invasive mechanical ventilation requirement (yes)3.513.33–3.70 < 0.001Non-invasive ventilation requirement (yes)1.911.84–1.99 < 0.001
Estimated transition intensities between states of our multistate Markov model are depicted in Table 3. Patients in the non-Lymphopenia state transitioned to the Lymphopenia state at a rate of 1.2% per day (95% CI 1.18–1.23) and to death at a rate of 2.0% per day (95% CI 1.99–2.07). From the Lymphopenia state, the transition intensity back to the non-Lymphopenia state was 1.6% per day (95% CI 1.54–1.61), while the transition to death occurred at a markedly higher rate of 4.3% per day (95% CI 4.26–4.36). All transitions were statistically significant (p < 0.001). Mean expected duration spent in a state before transitioning were 30.9 days for the non-Lymphopenia state and 17.1 days for the Lymphopenia state. These estimates suggest differing stability across immune states, with shorter durations observed in lymphopenia patients. In a covariate-adjusted multistate model including corticosteroid exposure, corticosteroid use was associated with increased hazard of transitioning from the non-Lymphopenia state to Lymphopenia (HR = 1.13, 95% CI 1.08–1.18) and from non-Lymphopenia to death (HR = 1.16, 95% CI 1.12–1.20). Conversely, corticosteroid use was associated with a reduced hazard of transitioning from the Lymphopenia to the non-Lymphopenia state (HR = 0.71, 95% CI 0.68–0.74), with no significant effect on transitions from Lymphopenia to death (HR = 0.94, 95% CI 0.92–1.06) (Fig. 4, Fig. 2 ESM).Table 3. Estimated transition intensities between immune states per dayFrom → ToNon-lymphopenicLymphopenicDeathNon-lymphopenic–1.205 (1.177–1.233)2.030 (1.995–2.066)Lymphopenic1.574 (1.544–1.605)–4.311 (4.262–4.362)Death (absorbing state)–––Values represent estimated transition intensities (hazard rates per day) with 95% confidence intervals. They reflect the relative speed of transitions rather than absolute transition probabilitiesFig. 4Modified alluvial plot depicting transition rates of Lymphocyte status and mortality outcomes overtime, in patients untreated and treated with corticosteroids. The figure illustrates transitions between three clinical states—lymphopenia, non-lymphopenia, and death. Each flow represents a dynamic variable assessed longitudinally, defined by the percentage of patients moving from one state to another in accordance with the group of origin, with the width of the stream proportional to that percentage of individuals. Transitions culminating in death are shown as terminal flows representing an absorbing state. * represents a significant difference between groups for the referred transition
Longitudinal absolute lymphocyte serum count trajectories and impact of corticosteroids
Using a joint modeling approach, our data revealed multiple significant predictors of lymphocyte trajectories. Increasing age and male sex were associated with lower lymphocyte counts, corresponding to relative decreases of approximately 13% per scaled year of age (95% CI: 11% to 15%) and 11% lower counts in males compared to females (9% to 14% decrease; both p < 0.001). Corticosteroid treatment was linked to a significant 10% reduction in lymphocyte counts over time (95% CI: 7% to 13% decrease, p < 0.001). Additional factors such as inotropes/vasopressors (approximately 10% decrease), renal replacement therapy (approximately 12% increase), and non-invasive ventilation (approximately 15% decrease) also showed significant effects on lymphocyte trajectories. Among survivors, lymphocyte values were significantly influenced by time since admission, corticosteroid treatment, and their interaction (p < 0.005 for all), indicating that corticosteroids modulate lymphocyte dynamics over time in this group. In non-survivors, corticosteroid treatment and its interaction with time were not significant, though lymphocyte counts still changed significantly over time (p = 0.0007). Overall, survivors and non-survivors differed significantly in lymphocyte counts, with the interaction between time and outcome being more pronounced in patients not receiving corticosteroids (Fig. 5).Fig. 5. Joint model combining a linear mixed-effects model and Cox regression, depicting the impact of corticosteroid therapy on predicted absolute lymphocyte counts (× 10⁹ cells/L) over time, in surviving and non-surviving patients
Discussion
Our findings robustly position lymphopenia as a prevalent and clinically meaningful marker of immune dysregulation in hospitalized patients with COVID-19. This study also documents that the presence and persistence of lymphopenia were independently associated with a markedly increased risk of adverse outcomes, including ICU admission, requirement of organ support, and higher in-hospital mortality. It also supports that patients who developed progressive or sustained lymphopenia, largely regardless of their initial lymphocyte count at admission, faced significantly higher mortality risk. These results suggest lymphopenia not merely as an epiphenomenon of critical illness but as a dynamic, prognostically relevant immunological signature.
Lymphopenia has long been proposed as a marker of immune dysregulation in sepsis and severe viral infections, despite the absence of definitive large-scale evidence support [22]. Our findings confirm and extend prior observations by providing multivariable-adjusted analyses that consistently link lower lymphocyte counts with increased hazard of in-hospital complications (across nearly every organ system), ICU admission rates, organ support requirements, and death. Although with a pragmatic and far less restrictive definition of lymphopenia status, demanding a single measurement during the first 28 days of hospital stay, our results show that over half of COVID-19 hospitalized patients (56%) met criteria for lymphopenia, exceeding prevalence estimates from earlier studies [15, 23, 24].
Patients who exhibit lymphopenia had significantly higher risk of adverse outcomes, even after adjustment for major clinical and treatment-related determinants, with 52% higher odds of in-hospital death compared to non-lymphopenia patients. These findings are consistent with previous studies, suggesting a potential dose–response relationship between lymphocyte depletion and poor prognosis [16, 25, 26]. These data support the inclusion of immune monitoring, specifically lymphocyte kinetics, as a critical parameter in the clinical assessment of hospitalized patients, comparable to the monitoring of other organ systems.
Our multistate model further reveals the temporal instability of immune states, showing that patients transitioning into lymphopenia face a markedly higher daily risk of death, while recovery from this state, or its complete absence, is associated with a survival advantage. These findings offer compelling support for the hypothesis that restoration of immune competence, supported by lymphocyte recovery, may represent a potentially critical inflection point in the trajectory of these hospitalized patients. Consistent with prior evidence, this dynamic is likely not limited to COVID-19, but may extend to other etiologies of sepsis, given the well-documented role of immune recovery in various infectious contexts [27–29].
Our data also reinforces the paradoxical role of corticosteroids, which were independently associated with both increased risk of transitioning into lymphopenia, impaired lymphocyte recovery and higher mortality. Considering their immunosuppressive properties, our results may reflect a potential unintended cost on immune resilience, particularly in patients with already compromised adaptive responses [29, 30]. Notably, in survivors, corticosteroids appeared to exert dynamic modulatory effects on lymphocyte trajectories. In contrast, in non-survivors, these modulatory effects appeared blunted, suggesting differential responsiveness based on host immune trajectory and possibly timing of administration. These results are consistent with recent data from several studies challenging the “one-size-fits-all” approach to corticosteroid therapy, specifically in COVID-19, and more broadly in sepsis [31–33]. A recent meta-analysis argues that the observed survival benefit of corticosteroids in COVID-19 appeared to be largely driven by the RECOVERY trial, as the effect was no longer statistically significant when this study was excluded [34, 35]. Another meta-analysis by Xiangrong Ye et al. demonstrated no significant difference in 28-day mortality among hospitalized COVID-19 patients receiving corticosteroids [36]. However, subgroup analyses suggested potential clinical benefit in moderate-to-severe cases, particularly in selected populations, thereby advocating for a personalized therapeutic approach aimed at minimizing adverse immunological consequences. Importantly, the absence of data on steroid treatment and lymphocyte trajectories in those analyses may limit the interpretation of these findings even on selected populations.
Collectively, all this data contributes to the growing body of evidence framing immune paralysis and dysfunction as a clinically relevant, and often underutilized, readily accessible surrogate for immune trajectory. This is particularly important in contexts where advanced immunophenotyping is unavailable [37]. Cautiously, our results also argue against a reductionist interpretation: lymphocyte counts alone cannot fully characterize the complexity of host immune response in sepsis and severe viral infections. Nevertheless, lymphocyte trajectories may serve as valuable biomarkers when interpreted within a broader immunological context, including patient age, comorbidities, disease phase, and therapeutic exposures, namely corticosteroids.
Our study benefits from several strengths. It is based on a large sample size, with granular temporal resolution of both laboratory and clinical variables. The application of advanced statistical methodologies, including multistate modeling and latent class mixed models to capture dynamic immunological transitions and associations between lymphocyte dynamics, treatment exposures, and outcomes. Furthermore, it uses a cohort with pragmatic data capturing across multiple countries that represents real-world reported observations.
However, some limitations merit consideration. First, the observational nature of the study precludes definitive causal inferences, and residual confounding cannot be fully excluded. Second, missing laboratory data led to the exclusion of a substantial number of patients, possibly limiting the power and generalizability of some of our more sophisticated analyses, such as LCMM. Also, most patients in this cohort were from high-income countries, which may further limit generalizability. Additionally, we cannot exclude that lymphocyte measurements may have been performed more frequently in patients with severe disease, which could introduce selection bias; however, our inclusion criteria requiring measurements on days 0, 1, 3, and 7 were applied consistently across all patients, in attempt to reduce this impact, although not fully eliminating this potential bias. To ensure the integrity of the dataset, we opted not to impute missing values in the primary analyses; sensitivity analyses using median imputation and last observation carried forward confirmed that our main findings were robust and did not materially change. We also acknowledge that requiring at least four lymphocyte measurements within the first week of hospitalization, to reliably characterize longitudinal trajectories and immune dysregulation, may have excluded patients who died, were discharged, or transferred early, introducing potential survivorship bias. Nevertheless, including patients with only one or two measurements would have resulted in misclassification of lymphocyte status and unreliable modeling of dynamic changes, which could have biased the study in other ways. This trade-off was an intentional methodological choice to ensure robustness of trajectory-based analyses. Third, we agree that the definition of lymphopenia employed, while intentionally inclusive, may lack sensitivity and specificity. We aimed to capture all plausible immune states consistent with lymphopenia in every patient. Additionally, we state that lymphocyte count is a crude proxy for immune function, and more refined markers (e.g., CD4 + T cells absolute count, mHLA-DR expression, PD-1 and PD-L1 serum levels or Ex-vivo LPS-induced tests) were not available. Also of note, the lack of granular data on corticosteroid type, cumulative dose, and duration limits the ability to explore dose-dependent effects and precludes direct comparison with standardized regimens such as those used in randomized trials. Data on antiviral therapies were also not uniformly available across participating sites and could not be reliably incorporated into adjusted analyses, precluding assessment of their potential impact on lymphocyte dynamics and outcomes. Lastly, our data reflect the COVID-19 era, and thus, extrapolation to non-COVID sepsis should be done with caution, though we emphasize that the underlying immunopathological mechanisms are likely to share significant overlap.
Conclusion
In this study, Lymphopenia was common in hospitalized COVID-19 patients and independently associated with worse clinical outcomes, with persistent or worsening lymphopenia identifying those at highest risk. Monitoring lymphocyte dynamics provides an accessible window into immune function and prognosis, particularly in resource-limited settings. Furthermore, corticosteroid exposure was associated with impaired lymphocyte recovery, urging the need for a more nuanced, immune-informed approach to immunomodulatory therapies, especially in patients with signs of adaptive immune suppression. These findings support immune-informed management strategies in sepsis and severe viral infections and highlight the potential for personalized therapeutic approaches based on immune trajectory.
Supplementary Information
Supplementary file 1.