Association of serum cotinine with phenotypic age acceleration and oxidative stress markers in US adults: A cross-sectional study
Hang Zhong, Shifu Bao, Wanquan Cao, Xin He, Zhaonan Ban

TL;DR
Higher levels of a tobacco exposure marker in blood are linked to faster biological aging and oxidative stress in US adults.
Contribution
This study provides population-level evidence that serum cotinine is associated with accelerated biological aging and identifies potential oxidative stress mechanisms.
Findings
Each doubling of serum cotinine was linked to a 0.22-year increase in phenotypic age acceleration.
Oxidative stress markers like GGT and uric acid partially explained the association between cotinine and aging.
The association was stronger in women and those with lower socioeconomic status.
Abstract
Tobacco exposure is a plausible accelerator of biological aging, yet population-level evidence and mechanisms remain insufficiently defined. We examined the association between serum cotinine and phenotypic age acceleration (PhenoAgeAccel), and assessed whether oxidative-stress biomarkers were related to the serum cotinine–PhenoAgeAccel association. We conducted a cross-sectional, survey-weighted analysis of n=19744 adults from NHANES 2011–2018. PhenoAgeAccel was computed as the residual from regressing PhenoAge on chronological age. Multivariable linear regressions related serum cotinine to PhenoAgeAccel across hierarchical adjustment models. Restricted cubic splines assessed non-linearity. Mediation analysis was conducted to quantify the extent to which oxidative-stress biomarkers contribute to this association. Higher serum cotinine was associated with accelerated biological aging:…
Genes, proteins, chemicals, diseases, species, mutations and cell lines named across the full text — each resolved to its canonical identifier and authoritative record.
Click any figure to enlarge with its caption.
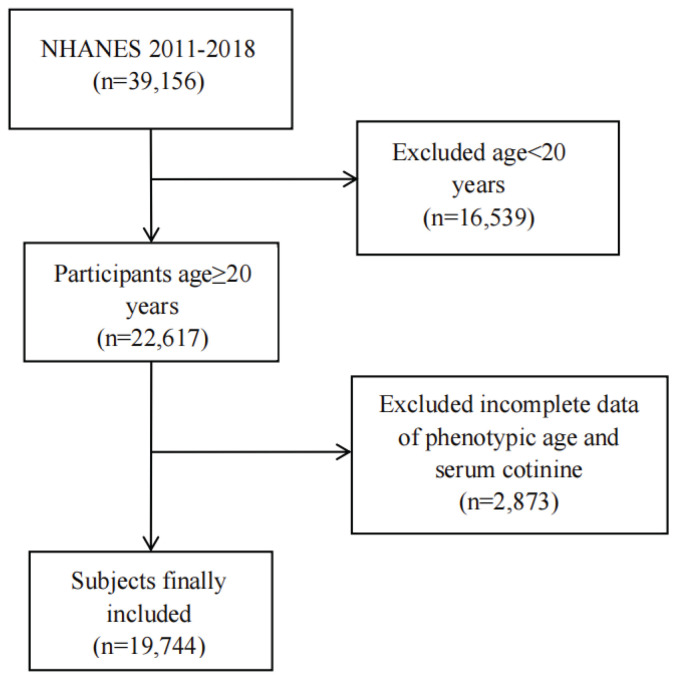 Figure 1
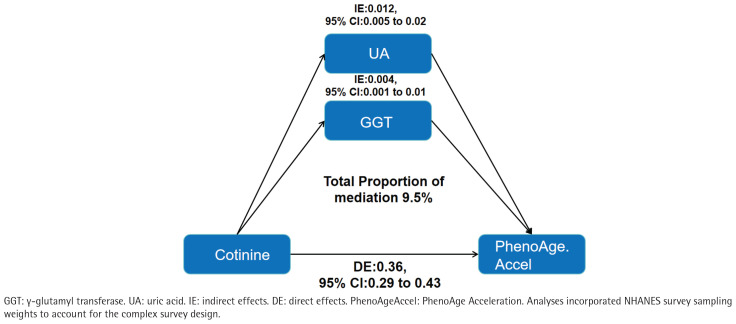 Figure 2
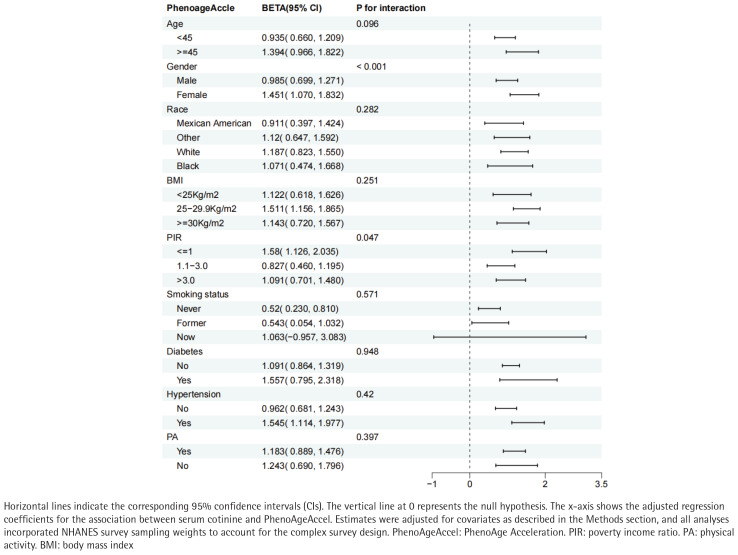 Figure 3
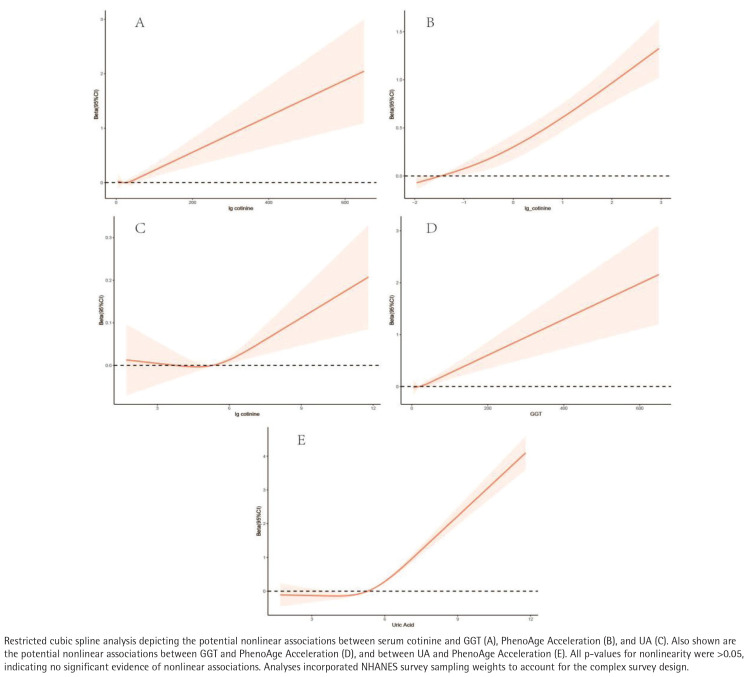 Figure 4
|
|
|
|
|
|
|
|---|---|---|---|---|---|
| 47.75 ± 0.30 | 51.49 ± 0.44 | 47.48 ± 0.40 | 43.47 ± 0.39 | <0.0001 | |
|
| <0.0001 | ||||
| Female | 10201 (51.76) | 4017 (57.98) | 3412 (53.13) | 2772 (42.98) | |
| Male | 9543 (48.24) | 2848 (42.02) | 2895 (46.87) | 3800 (57.02) | |
|
| <0.0001 | ||||
| Black | 4271 (10.62) | 833 (5.25) | 1366 (11.34) | 2072 (16.44) | |
| Mexican American | 2709 (8.68) | 1313 (10.25) | 818 (9.18) | 578 (6.33) | |
| Other | 5323 (15.22) | 1931 (13.87) | 2124 (19.40) | 1268 (12.99) | |
| White | 7441 (65.48) | 2788 (70.63) | 1999 (60.08) | 2654 (64.24) | |
|
| <0.0001 | ||||
| Lower than 12th grade | 4272 (14.05) | 1269 (9.82) | 1307 (13.53) | 1696 (19.62) | |
| High school grade or equivalent | 4386 (22.38) | 1164 (15.97) | 1324 (21.84) | 1898 (30.61) | |
| Some college or AA degree | 6114 (32.21) | 1960 (28.75) | 1920 (33.24) | 2234 (35.43) | |
| College graduate or higher | 4952 (31.31) | 2467 (45.42) | 1747 (31.30) | 738 (14.29) | |
|
| <0.0001 | ||||
| Divorced | 2151 (10.22) | 588 (8.32) | 667 (9.85) | 896 (12.84) | |
| Living with partner | 1654 (8.45) | 348 (4.47) | 461 (8.44) | 845 (13.25) | |
| Married | 10039 (54.68) | 4330 (67.35) | 3327 (54.44) | 2382 (39.60) | |
| Never married | 3748 (18.53) | 848 (11.86) | 1141 (18.95) | 1759 (26.18) | |
| Separated | 669 (2.44) | 151 (1.32) | 209 (2.36) | 309 (3.87) | |
| Widowed | 1483 (5.67) | 600 (6.66) | 502 (5.92) | 381 (4.24) | |
|
| <0.0001 | ||||
| Never | 11332 (56.61) | 5125 (73.85) | 4526 (70.37) | 1681 (23.20) | |
| Former | 4609 (24.65) | 1715 (25.81) | 1726 (28.77) | 1168 (19.50) | |
| Now | 3789 (18.70) | 21 (0.34) | 49 (0.86) | 3719 (57.29) | |
|
| <0.0001 | ||||
| Never | 2542 (9.70) | 1140 (13.85) | 1014 (13.19) | 388 (5.18) | |
| Former | 2301 (9.76) | 809 (10.67) | 773 (11.52) | 719 (10.86) | |
| Mild | 6087 (33.94) | 2475 (46.67) | 1967 (39.07) | 1645 (26.91) | |
| Moderate | 2782 (16.40) | 918 (18.11) | 814 (17.89) | 1050 (19.39) | |
| Heavy | 3401 (19.10) | 632 (10.70) | 845 (18.32) | 1924 (37.66) | |
|
| 0.004 | ||||
| No | 15793 (84.49) | 18230 (83.23) | 18436 (84.18) | 18615 (86.31) | |
| Yes | 3951 (15.51) | 1514 (16.77) | 1308 (15.82) | 1129 (13.69) | |
|
| 0.06 | ||||
| No | 11295 (61.54) | 3784 (60.09) | 3653 (62.42) | 3858 (62.47) | |
| Yes | 8449 (38.46) | 3081 (39.91) | 2654 (37.58) | 2714 (37.53) | |
|
| 0.11 | ||||
| No | 17638 (91.15) | 6149 (91.55) | 5676 (91.71) | 5811 (90.14) | |
| Yes | 2106 (8.85) | 716 (8.44) | 631 (8.29) | 761 (9.85) | |
|
| <0.001 | ||||
| no PA | 2711 (13.02) | 1035 (14.77) | 910 (12.98) | 766 (10.94) | |
| PA | 17033 (86.99) | 5830 (85.24) | 5397 (87.02) | 5806 (89.06) | |
| PIR, mean ± SE | 2.98 ± 0.05 | 3.46 ± 0.05 | 3.00 ± 0.05 | 2.38 ± 0.05 | <0.0001 |
|
|
|
|
| ||
| BMI (kg/m²) | 29.29 ± 0.11 | 29.12 ± 0.14 | 29.70 ± 0.18 | 29.12 ± 0.14 | 0.003 |
| PhenoAge | 45.42 ± 0.32 | 48.53 ± 0.46 | 44.74 ± 0.46 | 42.29 ± 0.40 | <0.0001 |
| PhenoAgeAccel | -2.33 ± 0.09 | -2.96 ± 0.11 | -2.74 ± 0.12 | -1.19 ± 0.11 | <0.0001 |
| Alkaline phosphatase (U/L) | 68.44 ± 0.32 | 67.26 ± 0.45 | 67.95 ± 0.43 | 70.32 ± 0.41 | <0.0001 |
| Serum creatinine (mg/dL) | 0.87 ± 0.00 | 0.86 ± 0.00 | 0.87 ± 0.00 | 0.88 ± 0.00 | 0.003 |
| Total protein (g/dL) | 7.08 ± 0.01 | 7.05 ± 0.01 | 7.11 ± 0.01 | 7.10 ± 0.01 | <0.0001 |
| Serum uric acid (mg/dL) | 5.39 ± 0.02 | 5.27 ± 0.02 | 5.45 ± 0.03 | 5.50 ± 0.03 | < 0.0001 |
| Blood urea nitrogen (mg/dL) | 13.93 ± 0.09 | 14.74 ± 0.14 | 14.09 ± 0.10 | 12.80 ± 0.09 | <0.0001 |
| Serum phosphorus (mg/dL) | 3.71 ± 0.01 | 3.70 ± 0.01 | 3.70 ± 0.01 | 3.72 ± 0.01 | 0.22 |
| Serum calcium (mg/dL) | 9.37 ± 0.01 | 9.37 ± 0.01 | 9.36 ± 0.01 | 9.38 ± 0.01 | 0.37 |
| γ-glutamyl transferase (U/L) | 27.43 ± 0.32 | 24.97 ± 0.56 | 25.98 ± 0.49 | 31.73 ± 0.63 | <0.0001 |
|
|
|
|
|
|---|---|---|---|
| Log10-transformed cotinine | 0.5 (0.44–0.57) <0.0001 | 0.54 (0.47–0.60) <0.0001 | 0.22 (0.16–0.29) <0.0001 |
|
| |||
| T1 (ref.) | |||
| T2 | 0.22 (-0.04–0.47) 0.10 | 0.31 (0.07–0.55) 0.01 | -0.04 (-0.24–0.15) 0.65 |
| T3 | 1.77 (1.52–2.02) <0.0001 | 1.94 (1.68–2.20) <0.0001 | 0.5 (0.29– 0.72) <0.0001 |
| p for trend | <0.0001 | <0.0001 | <0.001 |
|
|
|
| |
|---|---|---|---|
|
| |||
| Log10-transformed cotinine | 1.78 (1.31–2.25) <0.0001 | 1.72 ( 1.27–2.18) <0.0001 | 1.52 (1.16–2.21) <0.001 |
|
| |||
| T1 (ref.) | |||
| T2 | 1.01 (-0.40–2.42) 0.16 | 0.9 (-0.57–2.38) 0.23 | -0.33 (-1.88–1.22) 0.66 |
| T3 | 6.76 (4.95–8.57) <0.0001 | 6.59 (4.78–8.39) <0.0001 | 6.24 (4.11–8.58) <0.001 |
| p for trend | <0.0001 | <0.0001 | 0.17 |
|
| |||
| Log10-transformed cotinine | 0.03 (0.02–0.05) <0.001 | -0.01 (-0.02–0.01) 0.44 | 0.02 (0.01–0.05) 0.007 |
|
| |||
| T1 (ref.) | |||
| T2 | 0.18 (0.10–0.26) <0.0001 | 0.15 (0.09–0.21) <0.0001 | 0.08 (0.03–0.14) 0.01 |
| T3 | 0.23 (0.16–0.31) <0.0001 | 0.1 (0.04–0.16) 0.003 | 0.14 (0.05–0.22) 0.003 |
| p for trend | 0.11 | 0.09 | 0.74 |
|
|
|
| |
|---|---|---|---|
| 0.68 (0.61–0.75) <0.0001 | 0.63 (0.56–0.70) <0.0001 | 0.38 (0.31–0.45) <0.0001 | |
|
| |||
| Q1 (ref.) | |||
| Q2 | 0.58 (0.33–0.83) <0.0001 | 0.48 (0.23–0.74) <0.001 | 0.23 (0.03–0.43) 0.03 |
| Q3 | 0.95 (0.68–1.22) <0.0001 | 0.74 (0.46–1.02) <0.0001 | 0.26 (0.01–0.52) 0.05 |
| Q4 | 2.33 (2.06–2.60) <0.0001 | 2.05 (1.77–2.32) <0.0001 | 1.1 (0.83–1.37) <0.0001 |
| p for trend | <0.0001 | <0.0001 | <0.0001 |
| 0.02 (001–0.02) <0.0001 | 0.01 (0.0–0.02) <0.0001 | 0.01 (0.01–0.02) <0.001 | |
|
| |||
| Q1 (ref.) | |||
| Q2 | 0.72 (0.50–0.95) <0.0001 | 0.48 (0.26–0.70) <0.0001 | 0 (-0.18–0.19) 1.00 |
| Q3 | 1.43 (1.18–1.68) <0.0001 | 1.08 (0.81–1.34) <0.0001 | 0.14 (-0.06–0.34) 0.15 |
| Q4 | 2.23 (1.98–2.47) <0.0001 | 1.86 (1.61–2.10) <0.0001 | 0.28 (0.07–0.49) 0.01 |
| p for trend | <0.0001 | <0.0001 | 0.01 |
Peer Reviews
No public reviews on file for this paper yet. If you reviewed it on a platform where reviews are public (OpenReview, ICLR, NeurIPS, ICML), you can paste yours below so the community can read it here.
Videos
No videos yet. Explain this paper in a talk, walkthrough, or lecture? Add one.
Taxonomy
TopicsTryptophan and brain disorders · Nicotinic Acetylcholine Receptors Study · Circadian rhythm and melatonin
INTRODUCTION
Aging is a universal biological process accompanied by progressive functional decline and heightened vulnerability to disease. By 2030, approximately one-sixth of the global population will be aged ≥60 years^1^. Aging is inherently multifactorial, reflecting the concerted dysfunction of multiple physiological systems^2^. It is marked by cumulative molecular perturbations and the disruption of hallmark processes, including genomic instability, telomere attrition, and stem-cell exhaustion^3^. Accelerated aging confers increased susceptibility to chronic disease and elevates mortality risk. Although chronological age remains the dominant correlate of aging-related outcomes, pronounced inter-individual heterogeneity persists among people of the same chronological age^4^. Identifying determinants of accelerated aging and developing interventions to slow, halt, or reverse these trajectories are essential to reducing disease burden and extending lifespan.
Phenotypic age (PhenoAge) is a machine-learning–derived measure of biological aging that integrates routine clinical biomarkers to improve estimation of biological age and enhance prediction of age-related disease risk^4,5^. PhenoAge also captures morbidity and mortality risk across diverse populations^6^ and has been widely deployed in studies of health risk and longevity^7,8^. Its acceleration metric, phenotypic age acceleration (PhenoAgeAccel) – the difference between PhenoAge and chronological age – quantifies deviation from expected aging; positive values indicate accelerated aging and are associated with higher health risks^5^. PhenoAgeAccel has proven informative in investigations of environment-linked aging, enabling the identification of high-risk subpopulations and guiding targeted health interventions^9^.
Cotinine, a long-lived nicotine metabolite, is widely regarded as a key biomarker for quantifying tobacco-smoke exposure^10^. Owing to its greater temporal stability in blood than in urine, serum cotinine is considered a more reliable indicator of exposure^11^. Beyond indexing exposure, cotinine levels correlate with adverse sequelae of smoking, including heightened oxidative stress and impairment of mesenchymal stem-cell function – processes implicated in morbidity and mortality.
While the cardiopulmonary harms of smoking are well recognized, its accelerating effects on the nervous system and cognitive aging merit equal attention^12^. Convergent evidence indicates that smoking can propel aging processes across multiple biological domains^13^. First, smoking exacerbates cellular aging through the induction of oxidative stress. High-dose nicotine and other tobacco constituents elicit oxidative damage consistent with core mechanisms of aging; antioxidant treatment can mitigate nicotine-induced spatial memory deficits, underscoring the central role of oxidative stress in this pathway^14,15^. Second, smoking perturbs endocrine homeostasis, notably the thyroid-hormone signaling axis. Because thyroid hormones are essential for adult cognitive function, disruption of this pathway provides a mechanistic rationale for earlier cognitive decline reported in smokers – and potentially in their offspring^16,17^.
Independent lines of evidence link aging with elevated oxidative stress^18^, which in turn accelerates telomere attrition^19^. A plausible underpinning is mitochondrial dysfunction – a hallmark contributor to aging – that increases the generation of reactive oxygen species while impairing endogenous antioxidant defences^20^. Consistent with this model, antioxidant-rich diets can attenuate cellular oxidative stress and may slow biological aging^21^.
Although tobacco exposure is associated with oxidative stress and age-related morbidity, its relationship with biological aging at the population level remains unclear. Serum cotinine is a robust marker of tobacco exposure and has been linked to oxidative stress, which is implicated in phenotypic age acceleration. However, few population-based studies have jointly evaluated serum cotinine, oxidative-stress biomarkers, and phenotypic aging, especially in nationally representative samples.
Guided by these observations, we examined whether oxidative-stress biomarkers were statistically related to the association between serum cotinine and PhenoAgeAccel. Accordingly, we used data from the National Health and Nutrition Examination Survey (NHANES) to examine the relationship between serum cotinine and PhenoAgeAccel, and to test mediation by oxidative-stress biomarkers, specifically serum γ-glutamyl transferase (GGT) and uric acid (UA).
METHODS
This cross-sectional study draws on data from the NHANES, a nationally representative program that provides comprehensive information on the health and nutrition of the US population through standardized interviews and examinations^5^. The NHANES survey protocols were reviewed and approved by the NCHS Research Ethics Review Board (ERB). Specifically, the data used in this study were collected under Protocol #2011-17 (for 2011–2016 cycles) and Protocol #2018-01 (for 2017–2020 cycles). Participants were sampled from four NHANES cycles (2011–2018). Of 39156 individuals initially assessed, we excluded those younger than 20 years (n=16539), those missing PhenoAge data and cotinine data (n=2873), yielding a final analytical sample of 19744 adults aged ≥20 years. The screening flow is shown in Figure 1.
Flowchart for inclusion of participants, United States, NHANES 2011–2018 (N=19744)
Study variables
Serum cotinine
Venous blood was collected at mobile examination centers following NHANES standard operating procedures. Serum cotinine was quantified using isotope-dilution high-performance liquid chromatography with atmospheric-pressure chemical-ionization tandem mass spectrometry (ID HPLC–APCI–MS/MS).
PhenoAge and PhenoAgeAccel
PhenoAge was derived from nine clinical biomarkers – albumin, creatinine, fasting glucose, C-reactive protein (CRP), lymphocyte percentage, mean corpuscular volume, red cell distribution width, alkaline phosphatase and white blood cell count – together with chronological age^6^. We implemented the PhenoAge model trained on NHANES III using the BioAge R package and applied it to NHANES IV data (1999–2018). Because CRP was unavailable in NHANES 2011–2018, it was omitted; comparison of PhenoAge computed with versus without CRP using 1999–2010 data, demonstrated high concordance (correlation coefficient 0.959–0.996)^22^, indicating that exclusion of CRP does not materially affect the estimate.
PhenoAgeAccel was defined as the residual from a linear regression of PhenoAge on chronological age^8^. Participants with PhenoAgeAccel >0 were classified as phenotypically older, and those with PhenoAgeAccel <0 as phenotypically younger.
Oxidative-stress biomarkers
We considered GGT and UA as biomarkers linked to oxidative stress. Both were measured on a Beckman Coulter UniCel Dx800 analyser (Brea, CA, USA). GGT activity was assayed by an enzymatic-rate method, and UA by an endpoint method. Detailed laboratory protocols are available on the NHANES website.
Covariates
Referring to prior research and clinical insights, we accounted for covariates that could potentially impact the link between serum cotinine and Phenoage. The covariates in this study included age (years), gender (male, female), race (American, White, Black, other), marital status(married/living with a partner and widowed/divorced/separated/never married), education level (Lower than 12th grade, high school graduate or equivalent, some college or AA degree, and college graduate or higher), poverty income ratio (PIR), smoke(never, former and now), drinking status (never, former, mild, moderate, heavy), physical activity (yes, no), hypertension (yes, no), diabetes (yes, no), cardiovascular disease (yes, no), body mass index (BMI kg/m2), total protein(g/dL), blood urea nitrogen (mg/dL), serum creatinine (mg/dL), serum calcium (mg/dL), alkaline phosphatase (u/L), and serum phosphorus (mg/dL)^23^. Physical activity (PA) data were converted to metabolic equivalent minutes of moderate to vigorous physical activity per week (MET). Respondents were classified based on the criterion of meeting MET (≥600 MET-minutes/week, equivalent to 150 min/week of moderate-intensity or 75 min/week of vigorous-intensity physical activity) or not meeting the recommendation guidelines for adults (<600 MET-minutes/week)^24^.
Statistical analysis
All analyses incorporated the NHANES complex survey design – sampling weights, strata, and primary sampling units – in accordance with guidance from the Centers for Disease Control and Prevention (CDC) and the National Center for Health Statistics (NCHS). For multi-cycle analyses, sampling weights were re-derived following NCHS analytic guidelines. Continuous variables are expressed as means with standard error (SE), while categorical variables are represented as frequencies (n) and proportions (%). Baseline characteristics were compared using survey-weighted χ^2^ tests for categorical variables and survey-weighted one-way ANOVA for continuous variables. The association between serum cotinine and PhenoAgeAccel was examined using multivariable linear regression under three specifications. Model 1 was unadjusted. Model 2 adjusted for age, gender, and race. Model 3 further adjusted for marital status, education level, PIR, smoking status, drinking status, physical activity, hypertension, diabetes, CVD, BMI, total protein, blood urea nitrogen, serum creatinine, serum calcium, alkaline phosphatase (ALP), and serum phosphorus. Serum cotinine was analyzed both as a continuous variable and as categorical tertiles. Because cotinine was right-skewed, values were log10-transformed; regression coefficients therefore represent the change in PhenoAgeAccel per doubling of serum cotinine.
Prespecified subgroup analyses stratified the association by age (≤45 vs >45 years), gender (female vs male), race (White vs Black vs Mexican American vs other), PIR (<1 vs 1–3 vs >3), physical activity (no vs yes), smoking status (never vs former vs current), BMI (<25 vs 25–30 vs ≥30 kg/m^2^), hypertension (yes/no) and diabetes (yes, no). These factors were treated as potential effect modifiers^25^.
To assess mediation by oxidative-stress biomarkers, we used the mediation R package (version 4.1) with 5000 non-parametric bootstrap resamples. We estimated the total effect of the serum cotinine on PhenoAgeAccel, the average direct effect and the average causal mediation effect through oxidative-stress biomarkers; the proportion mediated was calculated as the indirect effect divided by the total effect. Restricted cubic spline models were additionally applied to explore potential nonlinear associations between serum cotinine and PhenoAgeAccel. All data processing and statistical analyses were conducted in R 4.1.3. Statistical significance was defined as two-sided p<0.05.
RESULTS
Baseline characteristics of participants
As shown in Table 1, participants were grouped by tertiles of serum cotinine. A total of 19744 individuals were included (48.24% male, 51.76% female; mean age 47.75 ± 0.30 years). Across the serum cotinine tertiles, we observed significant differences in age, gender, race, PIR, BMI, education level, marital status, smoking and drinking status, PA, PhenoAge, serum uric acid, blood urea nitrogen, ALP, and serum creatinine (all p<0.05). Individuals with higher cotinine concentrations tended to be younger, male, White, married, current smokers, from lower income strata, and to have higher BMI, ALP, serum creatinine, and uric acid; they also exhibited higher education level and greater physical activity.
Association between serum cotinine and PhenoAgeAccel
Table 2 summarizes multivariable survey-weighted regressions relating cotinine to PhenoAgeAccel. Higher cotinine was associated with greater PhenoAgeAccel. In the fully adjusted model (Model 3), each doubling of cotinine was associated with a 0.22-year increase in PhenoAgeAccel (β=0.22; 95% CI: 0.16–0.29, p<0.0001). Treating cotinine as tertiles for sensitivity analysis yielded consistent results: compared with tertile 1, tertile 3 showed an adjusted β of 0.50 years (95% CI: 0.29–0.72, p<0.0001).
Association between serum cotinine and GGT
Table 3 presents associations of cotinine with γ-glutamyl transferase (GGT). In Model 3, each doubling of cotinine corresponded to a 1.52-U/L higher GGT (β=1.52; 95% CI: 1.16–2.21, p<0.001). Categorizing cotinine into tertiles produced similar inferences: the highest tertile exhibited a 6.24-U/L higher GGT relative to the lowest (β=6.24; 95% CI: 4.11–8.58, p<0.001).
Association between serum cotinine and UA
Table 3 also shows associations of cotinine with serum uric acid. In Model 3, each doubling of cotinine was associated with a 0.02 mg/dL higher uric acid (β=0.02; 95% CI: 0.01–0.05, p=0.007). In tertile analyses, the highest versus lowest cotinine tertile was associated with a 0.14 mg/dL higher uric acid (β=0.14; 95% CI: 0.05–0.22, p<0.001).
Associations of GGT and UA with PhenoAgeAccel
As reported in Table 4, both biomarkers were positively related to PhenoAgeAccel. For GGT, each 1-U/L increment corresponded to a 0.01-year higher PhenoAgeAccel (β=0.01; 95% CI: 0.01–0.02, p<0.001). In quartile analyses, participants in the highest GGT quartile (Q4) had significantly higher PhenoAgeAccel compared with those in the lowest quartile (Q1) (β=0.28; 95% CI: 0.07–0.49, p=0.01), whereas no statistically significant differences were observed for the second (Q2) or third (Q3) quartiles. For uric acid, each 1 mg/dL increment corresponded to a 0.38-year higher PhenoAgeAccel (β=0.38; 95% CI: 0.31–0.45, p<0.0001). In quartile-based analyses, compared with participants in the lowest quartile (Q1), those in the highest quartile (Q4) had substantially higher PhenoAgeAccel (β=1.10; 95% CI: 0.83–1.37, p<0.001), whereas smaller effect sizes were observed for the second (Q2) and third (Q3) quartiles. A significant dose–response trend across quartiles was observed (p for trend <0.001).
Mediation analyses
Parallel mediation analyses evaluated oxidative-stress pathways. The direct effect of serum cotinine on PhenoAgeAccel remained statistically significant (direct effect =0.36; 95% CI: 0.29–0.43). Individually, both GGT and uric acid showed significant mediation of the cotinine–PhenoAgeAccel association, with mediation proportions of 3.5% and 6.0%, respectively (both p<0.05). In a multivariable model including both mediators, the combined indirect effect remained significant, accounting for 9.5% of the total effect (Figure 2).
Indirect effects of oxidative-stress biomarkers in the association between serum cotinine and PhenoAgeAccel , United States, NHANES 2011–2018 (N=19744)
Subgroup analyses
We detected significant effect modification by sex (interaction p<0.001) and PIR (interaction p=0.047). The cotinine–PhenoAgeAccel association was more pronounced among women and among participants with lower socioeconomic status. (Figure 3).
Subgroup analysis for the association between serum cotinine and PhenoAgeAccel, United States, NHANES 2011–2018 (N=19744)
Restricted cubic splines
After multivariable adjustment, there was no evidence of non-linearity in the relationships of the serum cotinine with GGT, PhenoAgeAccel or UA (all p for non-linearity >0.05). Each outcome increased monotonically with higher serum cotinine (Figure 4).
Restricted cubic spline analyses of serum cotinine, γ-glutamyl transferase (GGT), uric acid (UA), and PhenoAge Acceleration, United States, NHANES 2011–2018 (N=19744)
DISCUSSION
Our novel study examined the association between serum cotinine and PhenoAgeAccel in a nationally representative US population. We observed a robust positive association: in fully adjusted models, each doubling of serum cotinine corresponded to a 0.22-year increase in PhenoAgeAccel. Mediation analyses further supported a contributory role for oxidative stress, with GGT and UA jointly mediating part of the serum cotinine–PhenoAgeAccel association. Subgroup analyses further indicated stronger associations among women and participants with lower socioeconomic status. This heterogeneity may reflect differences in vulnerability, exposure patterns, or unmeasured social and behavioral factors, warranting further investigation. These findings contribute to understanding the population-level associations between tobacco exposure and phenotypic aging.
Cotinine is the biomarker of choice for tobacco exposure assessment owing to its higher concentrations and longer elimination half-life relative to nicotine^11,26^. Smoking accelerates aging through convergent molecular and cellular pathways with systemic and persistent effects. First, smoking provokes chronic inflammation and immune activation, yielding molecular features that recapitulate aspects of normative aging. A study reported hypomethylation and upregulation of immune-related regulatory elements alongside hypermethylation at Polycomb repressive complex (PRC) targets, perturbing epigenetic homeostasis and promoting sustained inflammation and tissue damage^13^. Second, tobacco toxins activate the aryl-hydrocarbon-receptor (AHR) axis (including AHRR, CYP1A1 and CYP1B1), escalating oxidative stress and DNA damage; the cumulative changes trigger DNA-repair–linked methylation shifts and advance epigenetic age^12,27^. In smokers, epigenetic age in airway and lung tissues is accelerated by 4–5 years, and lifelong exposure is associated with higher GrimAge and PhenoAge estimates and increased risks of cancer, cardiovascular and pulmonary disease^28^. At the vascular interface, prior work indicates that tobacco smoke suppresses collagen synthesis, induces matrix metalloproteinases and damages elastic fibers; reactive oxygen species (ROS) accumulation further accelerates extracellular-matrix degradation^28^. Collectively, smoking reshapes the tissue microenvironment and hastens aging via amplification of inflammation, oxidative stress, DNA-damage/repair imbalance and epigenetic drift.
Oxidative stress is a hallmark correlate of aging and is linked to telomere attrition and vulnerability to age-related disease^29^. It also impairs mitochondrial function, increasing ROS generation, mitochondrial dysfunction is a central driver of aging biology^30^. Our results align with prior evidence that higher PhenoAgeAccel tracks with GGT and UA levels^31^. Emerging data suggest that improving cardiovascular risk profiles – healthy diet, smoking cessation, adequate sleep, and control of BMI, glycaemia and blood pressure – can lower systemic oxidative stress^32,33^, underscoring the modifiability of these pathways.
To date, no epidemiological evidence suggests that cigarette smoking slows biological aging. A small body of preclinical research has reported potential anti-aging effects of low-dose nicotine in animal models, primarily through metabolic regulation and neuroprotective pathways^34^. However, these findings differ fundamentally from population-based studies of cigarette smoking, as they typically involve isolated nicotine administration under controlled conditions and do not account for the complex mixture of toxicants present in tobacco smoke. Moreover, evidence derived from animal experiments or short-term interventions cannot be directly extrapolated to long-term human exposure. Differences in exposure source (nicotine vs cigarette smoke), dosage, duration, and outcome definitions (molecular or functional aging markers vs composite biological aging indices) may therefore explain the discrepancies between these experimental findings and the present population-level results. In addition, large-scale epidemiological studies consistently report accelerated epigenetic aging, increased morbidity, and reduced healthspan among smokers, further supporting the population-level relevance of our findings.
Strengths and limitations
Strengths include the nationally representative design, large sample size and integration of oxidative-stress biomarkers with formal mediation analysis. We show that serum cotinine is positively associated with both GGT and UA and that these biomarkers partially mediate the serum cotinine–PhenoAge relationship, offering mechanistic insight. Limitations merit consideration. First, PhenoAgeAccel, while validated, is not the sole index of biological aging; complementary measures warrant evaluation. Second, our oxidative-stress panel was restricted to GGT and UA and did not incorporate thresholds or additional markers that distinguish oxidative-stress subtypes (e.g. acute vs chronic). Broader biomarker panels (e.g. lipid peroxidation products, antioxidant capacity, mitochondrial function assays) could refine phenotyping. Third, the cross-sectional design limits causal interpretation of the observed associations and precludes establishing temporal ordering between exposure, oxidative-stress biomarkers, and phenotypic age acceleration. Accordingly, the mediation analyses should be regarded as hypothesis-generating rather than confirmatory. Fourth, participants with missing data were excluded from the analysis. If these data were not missing completely at random, selection bias may have occurred. In addition, serum cotinine reflects recent tobacco exposure and may misclassify occasional or intermittent smokers, particularly in cross-sectional settings, potentially leading to exposure misclassification. Finally, despite extensive covariate adjustment, residual confounding by unmeasured factors cannot be excluded. These include dietary patterns and antioxidant intake (e.g. fruit and vegetable consumption)^35^ and sleep patterns^36^.
CONCLUSIONS
Among US adults, higher serum cotinine levels were associated with greater phenotypic age acceleration, as indexed by PhenoAgeAccel. Mediation analyses suggested that oxidative-stress biomarkers were statistically related to this association, indicating a potential mechanistic link between tobacco exposure and biological aging processes. These findings provide population-level evidence describing the relationships among tobacco exposure, oxidative stress, and phenotypic aging, while longitudinal studies are needed to clarify temporality and underlying mechanisms.
The reference list from the paper itself. Each links out to its DOI / PubMed record.
- 1Dzau VJ, Inouye SK, Rowe JW, Finkelman E, Yamada T. Enabling healthful aging for all. The National Academy of medicine grand challenge in healthy longevity. N Engl J Med. 2019;381(18):1699-1701. doi:10.1056/NEJ Mp 191229831633895 · doi ↗ · pubmed ↗
- 2Kennedy BK, Berger SL, Brunet A, et al. Geroscience: linking aging to chronic disease. Cell. 2014;159(4):709-713. doi:10.1016/j.cell.2014.10.03925417146 PMC 4852871 · doi ↗ · pubmed ↗
- 3López-Otín C, Blasco MA, Partridge L, Serrano M, Kroemer G. Hallmarks of aging: an expanding universe. Cell. 2023;186(2):243-278. doi:10.1016/j.cell.2022.11.00136599349 · doi ↗ · pubmed ↗
- 4Levine ME, Crimmins EM. Is 60 the new 50? Examining changes in biological age over the past two decades. Demography. 2018;55(2):387-402. doi:10.1007/s 13524-017-0644-529511995 PMC 5897168 · doi ↗ · pubmed ↗
- 5Liu Z, Kuo PL, Horvath S, Crimmins E, Ferrucci L, Levine M. A new aging measure captures morbidity and mortality risk across diverse subpopulations from NHANES IV: a cohort study. P Lo S Med. 2018;15(12):e 1002718. doi:10.1371/journal.pmed.100271830596641 PMC 6312200 · doi ↗ · pubmed ↗
- 6Levine ME, Lu AT, Quach A, et al. An epigenetic biomarker of aging for lifespan and healthspan. Aging (Albany NY). 2018;10(4):573-591. doi:10.18632/aging.10141429676998 PMC 5940111 · doi ↗ · pubmed ↗
- 7Jin S, Li C, Cao X, Chen C, Ye Z, Liu Z. Association of lifestyle with mortality and the mediating role of aging among older adults in China. Arch Gerontol Geriatr. 2022;98:104559. doi:10.1016/j.archger.2021.10455934741896 · doi ↗ · pubmed ↗
- 8Yang Z, Pu F, Cao X, et al. Does healthy lifestyle attenuate the detrimental effects of urinary polycyclic aromatic hydrocarbons on phenotypic aging? An analysis from NHANES 2001-2010. Ecotoxicol Environ Saf. 2022;237:113542. doi:10.1016/j.ecoenv.2022.11354235468442 · doi ↗ · pubmed ↗