Medical trainees' emotions and their effects on perceptions of performance and team mood in team‐based simulations
Keerat Grewal, Sayed Azher, Matthew Moreno, Reinhard Pekrun, Jeffrey Wiseman, Jessica Flake, Susanne Lajoie, Ning‐Zi Sun, Gerald M. Fried, Elene Khalil, Jason M. Harley

TL;DR
This study explores how emotions experienced by medical trainees during team-based simulations affect their perceptions of performance and team mood.
Contribution
The study introduces and validates a new self-report tool (SERQ) to assess emotions in medical trainees during simulations.
Findings
Team leaders reported higher levels of shame post-simulation compared to team members.
Post-simulation happiness and hopefulness predicted perceptions of team performance and mood.
Frustration after simulations predicted perceptions of team mood.
Abstract
Emotions affect performance in learning contexts; however, their effects on medical trainees' performance in highly ecologically valid settings, like team‐based simulation training, are not well understood. It is therefore imperative to know which emotions are experienced by medical trainees and the impacts of these emotions on perceptions of performance and team mood. To extend the understanding of medical trainees' emotions in the context of team‐based medical simulations using a new self‐report tool (Situated Emotion Regulation Questionnaire; SERQ). Participants were 106 medical trainees participating in team‐based simulations. Seventy‐one participated in multiple simulations. A field‐based, mixed‐methods methodology was used. Medical trainees self‐reported their emotions and perceptions of individual performance, team performance and team mood. Multi‐level analyses were used to…
Genes, proteins, chemicals, diseases, species, mutations and cell lines named across the full text — each resolved to its canonical identifier and authoritative record.
Click any figure to enlarge with its caption.
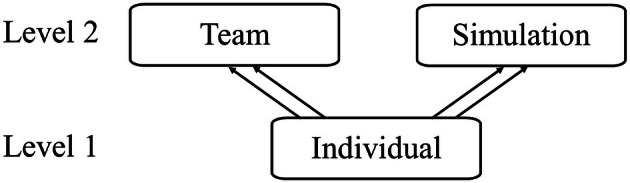 FIGURE 1
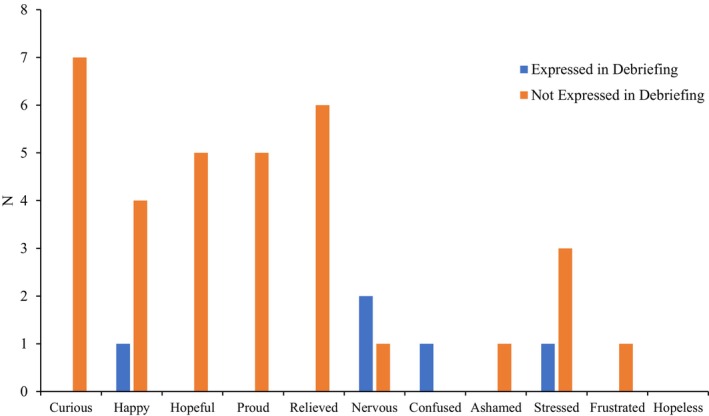 FIGURE 2
| Leader ( | Member ( | |||
|---|---|---|---|---|
|
| SD |
| SD | |
|
| ||||
| Positive activating emotions | ||||
| Curiosity | 3.35 | .97 | 3.19 | .98 |
| Happiness | 2.60 | .90 | 2.78 | .96 |
| Hopefulness | 2.72 | .96 | 2.83 | .99 |
| Pride | 2.32 | .98 | 2.52 | 1.16 |
| Positive deactivating emotions | ||||
| Relief | 1.75 | .83 | 2.03 | 1.06 |
| Negative activating emotions | ||||
| Confusion | 2.04 | .87 | 1.95 | .89 |
| Shame | 1.60 | .82 | 1.50 | .84 |
| Stress (affective state) | 3.05 | .95 | 2.49 | .95 |
| Frustration | 1.58 | .78 | 1.50 | .73 |
| Nervousness | 3.19 | 1.13 | 2.62 | 1.04 |
| Negative deactivating emotions | ||||
| Hopelessness | 1.49 | .76 | 1.48 | .76 |
|
| ||||
| Positive activating emotions | ||||
| Curiosity | 2.79 | 1.06 | 2.97 | 1.08 |
| Happiness | 2.88 | .85 | 2.78 | 1.01 |
| Hopefulness | 2.77 | .96 | 2.90 | 1.07 |
| Pride | 2.70 | .82 | 2.64 | 1.05 |
| Positive deactivating emotions | ||||
| Relief | 3.23 | 1.07 | 2.84 | 1.06 |
| Negative activating emotions | ||||
| Confusion | 2.39 | .98 | 2.21 | 1.05 |
| Shame | 2.09 | 1.01 | 1.60 | .91 |
| Stress (affective state) | 2.47 | .98 | 2.05 | .88 |
| Frustration | 2.18 | 1.05 | 1.85 | 1.02 |
| Nervousness | 2.35 | .79 | 2.10 | .97 |
| Negative deactivating emotions | ||||
| Hopelessness | 1.63 | .86 | 1.47 | .79 |
|
| 3.12 | .71 | 3.19 | .83 |
|
| 3.58 | .78 | 3.53 | .87 |
|
| 3.77 | .71 | 3.81 | .78 |
| Curiosity | Confused | Ashamed | Frustrated | Proud | Nervous | Happy and hopeful | |
|---|---|---|---|---|---|---|---|
| Intercept | 1.462** | 2.426** | 1.297** | 1.289** | 1.331** | 1.638** | −.077 |
| Simulation role | −.226 | .049 | .383* | .285 | .154 | .008 | .155 |
| Presimulation emotion | .415** | .191 | .503** | .529** | .534** | .306** | .604** |
| PGY | .067 | −.114 | −.068 | −.027 | .018 | −.114 | −.111 |
| Specialty | |||||||
| Internal medicine | .112 | −.178 | −.348 | .023 | −.142 | .223 | .153 |
| Emergency medicine | .088 | −.367 | −.157 | −.381 | −.040 | −.303 | .554 |
| Critical care | −.388 | −.273 | −.448 | −.356 | −.189 | .423 | .837 |
| OBGYN | −.039 | −.070 | −.061 | −.182 | −.169 | .240 | .427 |
| Variance components | |||||||
| Simulation variance | – | .263 | .195 | – | – | .072 | – |
| Team variance | – | – | – | .048 | – | – | – |
| Individual variance | .097 | .066 | .040 | .124 | <.001 | .183 | .003 |
| Pseudo | .096 | .063 | .272 | .207 | .340 | .332 | .385 |
| Null | Null + post‐simulation emotions | Full model with covariates | |
|---|---|---|---|
| Intercept | 3.163** | 3.215** | 3.081** |
| Post‐simulation emotions | |||
| Curiosity | .003 | −.005 | |
| Confused | −.069 | −.061 | |
| Ashamed | −.041 | −.101 | |
| Frustrated | −.178 | −.160 | |
| Proud | .251* | .187 | |
| Nervous | −.060 | −.012 | |
| Happy + Hopeful | .020 | .094 | |
| Presimulation emotions | |||
| Curiosity | −.007 | ||
| Confused | .064 | ||
| Ashamed | .047 | ||
| Frustrated | −.091 | ||
| Proud | .168 | ||
| Nervous | −.052 | ||
| Happy+Hopeful | −.170* | ||
| Simulation role | .041 | ||
| PGY | .005 | ||
| Specialty | |||
| Internal medicine | −.121 | ||
| Emergency medicine | .080 | ||
| Critical care | −.372 | ||
| OBGYN | −.120 | ||
| Variance components | |||
| Team variance | .073 | .021 | <.001 |
| Individual variance | .046 | .016 | <.001 |
| ICCT | .114 | ||
| ICCI>T | .186 |
| Null | Null + post‐simulation emotions | Full model with covariates | |
|---|---|---|---|
| Intercept | 3.779** | 4.631** | 4.810** |
| Post‐simulation emotions | |||
| Curiosity | −.034 | −.005 | |
| Confused | −.052 | −.041 | |
| Ashamed | −.108 | −.188 | |
| Frustrated | −.187* | −.187* | |
| Proud | .012 | .057 | |
| Nervous | −.040 | −.067 | |
| Happy + Hopeful | .189** | .183* | |
| Presimulation emotions | |||
| Curiosity | −.054 | ||
| Confused | .050 | ||
| Ashamed | .119 | ||
| Frustrated | −.013 | ||
| Proud | −.113 | ||
| Nervous | .018 | ||
| Happy + Hopeful | .031 | ||
| Simulation role | .096 | ||
| PGY | −.056 | ||
| Specialty | |||
| Internal medicine | −.058 | ||
| Emergency medicine | .215 | ||
| Critical care | .065 | ||
| OBGYN | .159 | ||
| Variance components | |||
| Simulation variance | .085 | .047 | .036 |
| Team variance | .025 | <.001 | <.001 |
| Individual variance | .044 | .021 | .012 |
| ICCS | .150 | ||
| ICCT>S | .194 | ||
| ICCI>T>S | .271 |
| Null | Null + post‐simulation emotions | Full model with covariates | |
|---|---|---|---|
| Intercept | 3.577** | 4.286** | 4.508** |
| Post‐simulation emotions | |||
| Curious | −.030 | −.033 | |
| Confused | −.117 | −.112 | |
| Ashamed | −.138 | −.179 | |
| Frustrated | −.067 | −.058 | |
| Proud | −.032 | −.046 | |
| Nervous | .057 | .035 | |
| Happy‐Hopeful | .205** | .219* | |
| Presimulation emotions | |||
| Curious | −.072 | ||
| Confused | .175 | ||
| Ashamed | −.041 | ||
| Frustrated | −.222 | ||
| Proud | .052 | ||
| Nervous | .087 | ||
| Happy‐Hopeful | −.042 | ||
| Simulation role | .140 | ||
| PGY | −.094 | ||
| Specialty | |||
| Internal medicine | −.137 | ||
| Emergency medicine | .255 | ||
| Critical care | .044 | ||
| OBGYN | .249 | ||
| Variance components | |||
| Simulation variance | .064 | .027 | .032 |
| Team variance | .110 | .055 | .050 |
| Individual variance | .147 | .142 | .123 |
| ICCS | .091 | ||
| ICCT>S | .249 | ||
| ICCI>T>S | .384 |
| Observations ( | ||
|---|---|---|
| Debriefing | SERQ | |
| Participants' observations | ||
| Positive activating emotions | ||
| Curious | 0 | 14 |
| Happy | 2 | 12 |
| Hopeful | 0 | 15 |
| Proud | 0 | 12 |
| Positive deactivating emotions | ||
| Relieved | 0 | 14 |
| Negative activating emotions | ||
| Nervous | 2 | 6 |
| Confused | 10 | 3 |
| Ashamed | 0 | 4 |
| Stressed | 5 | 8 |
| Frustrated | 0 | 6 |
| Negative deactivating emotions | ||
| Hopeless | 0 | 4 |
| Individual performance | ||
| Positive perceptions | 0 | 31 |
| Mixed perceptions | 4 | – |
| Negative perceptions | 8 | 15 |
| Team performance | ||
| Positive perceptions | 32 | 34 |
| Mixed perceptions | 5 | – |
| Negative perceptions | 1 | 12 |
| Team mood | ||
| Positive perceptions | 14 | 38 |
| Mixed perceptions | 0 | – |
| Negative perceptions | 2 | 8 |
| External observers' observations | ||
| Individual performance | ||
| Positive perceptions | 25 | |
| Mixed perceptions | 6 | |
| Negative perceptions | 1 | |
| Team performance | ||
| Positive perceptions | 39 | |
| Mixed perceptions | 0 | |
| Negative perceptions | 0 | |
| Team mood | ||
| Positive perceptions | 31 | |
| Mixed perceptions | 0 | |
| Negative perceptions | 0 | |
| SERQ responses | Positive perceptions in debriefing | Mixed perceptions in debriefing | Negative perceptions in debriefing |
|---|---|---|---|
| Participants' observations | |||
| Individual performance | |||
| Positive perceptions | 0 | 2 | 4 |
| Negative perceptions | 0 | 2 | 4 |
| Team performance | |||
| Positive perceptions | 24 | 3 | 1 |
| Negative perceptions | 8 | 2 | 0 |
| Team mood | |||
| Positive perceptions | 13 | 0 | 0 |
| Negative perceptions | 1 | 0 | 2 |
| External observers' observations | |||
| Individual performance | |||
| Positive perceptions | 18 | 3 | 0 |
| Negative perceptions | 7 | 3 | 1 |
| Team performance | |||
| Positive perceptions | 28 | 0 | 0 |
| Negative perceptions | 11 | 0 | 0 |
| Team mood | |||
| Positive perceptions | 27 | 0 | 0 |
| Negative perceptions | 4 | 0 | 0 |
| Aligned ( | Not aligned ( | χ2 | Cramer's | |
|---|---|---|---|---|
| Participants' observations | ||||
| Post‐simulation emotions | 6 | 8 | .29 | .14 |
| Post‐simulation emotion quadrants | 8 | 6 | .29 | .14 |
| Perceptions of individual performance | 4 | 4 | <.01 | <.01 |
| Perceptions of team performance | 24 | 9 | 6.82* | .45 |
| Perceptions of team mood | 15 | 1 | 12.25** | .88 |
| External observers' observations | ||||
| Perceptions of individual performance | 19 | 7 | 5.54* | .46 |
| Perceptions of team performance | 28 | 11 | 7.41* | .44 |
| Perceptions of team mood | 27 | 4 | 17.07** | .74 |
- —Social Sciences and Humanities Research Council of Canada10.13039/501100000155
- —Fonds de Recherche du Québec‐Société et Culture10.13039/100008240
Peer Reviews
No public reviews on file for this paper yet. If you reviewed it on a platform where reviews are public (OpenReview, ICLR, NeurIPS, ICML), you can paste yours below so the community can read it here.
Videos
No videos yet. Explain this paper in a talk, walkthrough, or lecture? Add one.
Taxonomy
TopicsSimulation-Based Education in Healthcare · Team Dynamics and Performance · Human Resource Development and Performance Evaluation
INTRODUCTION
Emotions can affect psychophysiological processes, thereby influencing learning and performance (Camacho‐Morles et al., 2021; Frenzel et al., 2023; Gross, 2024). Higher education learners reporting pleasant emotions (e.g. happiness) are typically more engaged, perform better and attend class more than students reporting unpleasant emotions (e.g. frustration) (Earl et al., 2024; Parker et al., 2021; Pekrun et al., 2023; Robinson et al., 2017; Tze et al., 2022; Wortha et al., 2019). However, emotional effects are nuanced. For example, Jarrell et al. (2016) found that students experiencing pleasant emotions rated their performance higher, despite no objective performance differences from those experiencing unpleasant emotions. These findings suggest that emotional valence can influence self‐perceptions differently from objective outcomes, highlighting the need to further investigate the role of emotions within specific contexts (Camacho‐Morles et al., 2021; Gross, 2024; Pekrun & Linnenbrink‐Garcia, 2022).
For example, medical trainees in simulation‐based educational environments may have their emotions influenced by many factors, including if they are the team leader (in the ‘hot seat’; their performance is usually evaluated) or team member and the information they are given beforehand (Duque et al., 2023; Harley & Pekrun, 2024; Mueller et al., 2022). Since well‐designed simulations replicate realistic environments to prepare medical trainees for emotion‐evoking situations, trainees may experience simulations and related emotions as if facing real cases (Gaba, 2004; Macdougall et al., 2013). Emotions can also spread to other team members through mechanisms such as emotional contagion, where one person's emotional state can influence the emotions of others, affecting team performance and mood (Herrando & Constantinides, 2021; Mitchell & Boyle, 2019; Yang et al., 2021). Compared to emotions, moods typically last longer, are less intense and ‘often do not have specific object [foci]’ (Gross, 2024). Positive team moods can enhance teamwork, thereby improving quality of care and patient safety (Forsyth, 2021; Rosen et al., 2018; Varpio & Teunissen, 2021).
Post‐simulation debriefings allow trainees to reflect on their performance and experiences in the simulation and/or discuss the scenario's real‐life applicability (Sawyer et al., 2016). Many debriefing frameworks dedicate a phase to discuss trainees' emotions and reactions (e.g. Bajaj et al., 2018; Kolbe et al., 2013; Zigmont et al., 2011). Understanding trainees' simulation‐induced emotions is essential, as these may influence decision‐making and their team's emotions (Herrando & Constantinides, 2021; LeBlanc & Posner, 2022; Madsgaard et al., 2022; Yang et al., 2021).
This study uses a novel self‐report tool to examine emotions in team‐based medical simulations. Emotions immediately before and after each simulation were the foci of the study as collecting self‐report data on emotions during the simulation would interfere with the educational opportunity. As such, this study examines if participants' roles during simulations influence the emotions experienced after the simulation while controlling for emotions before the simulation, the relationship of post‐simulation emotions with performance and team mood, and provides validity evidence for the self‐report tool. This study also explores how participants discuss their emotions and perceptions during debriefings, which has not previously been done in the medical simulation training context. The theoretical frameworks that guided our study and a brief overview of the literature of emotions in medical education are presented below, followed by a brief overview of the current study.
Theoretical framework
We used the control‐value theory of achievement emotions (CVT; Pekrun, 2024), which is widely used in academic achievement research (Shao et al., 2023; Tze et al., 2023). CVT characterizes emotions by pleasantness (valence; positive to negative), degree of physiological arousal (activation; activating to deactivating), the stimuli triggering the emotion (object focus; task‐related or outcome‐related) and the place in time the emotion was directed to (time frame; retrospective, concurrent or prospective; Pekrun et al., 2023). For example, a cardiac arrest simulation may induce frustration triggered by missing equipment (concurrent, activity‐related).
Positive activating emotions (e.g. excitement) are typically associated with increased achievement, whereas negative deactivating emotions (e.g. hopelessness) are associated with impaired achievement (Madsgaard et al., 2022; Pekrun & Linnenbrink‐Garcia, 2022; Vogl et al., 2020). However, some studies have found evidence that diverges from this general pattern (e.g. Jarrell et al., 2016; McConnell et al., 2016). For example, McConnell and colleagues found that students experiencing either positive or negative emotions when learning about physiological concepts performed worse than those who were in an emotionally more neutral state, suggesting that heightened emotional intensity, regardless of valence, may interfere with cognitive processing. Jarrell and colleagues found that students who experienced positive emotions had similar objective performance on a diagnostic reasoning task compared to those experiencing negative emotions. As predicted by CVT, these findings challenge the assumption that positive emotions universally enhance and negative emotions impair performance (Pekrun, 2006, 2024). The findings indicate that there is a need to explore the effects of different emotions within the categories of positive and negative emotions. They also suggested that research should attend to possible differences of emotion effects across different academic tasks, different learner populations and different contexts, as the findings of previous studies may not be generalizable to all tasks, populations and contexts. As such, identifying the differences in emotion effects for medical learners engaging in team‐based medical simulations extends and addresses a gap within the literature.
We used The Standards for Educational and Psychological Testing (American Educational Research Association, American Psychological Association, & National Council on Measurement in Education, 2014) to guide validity evidence collection and argumentation for the self‐report tool, particularly for evidence based on content, internal structure, response processes and relations to other variables (descriptions can be found in Data S1: Material I).
Trainees' emotions in medical simulations
Literature regarding emotions in medical simulations is often limited to only negative activating emotions (e.g. anxiety), which may be due, in part, to medical simulations being designed to allow trainees to practise managing specific negative emotions that are commonly experienced in real‐life scenarios (Ahn et al., 2023). However, simulations can also evoke positive and deactivating emotions (Keskitalo & Ruokamo, 2021; Madsgaard et al., 2022; Yang et al., 2021). For example, Keskitalo and Ruokamo (2021) found that medical trainees experienced higher levels of positive emotions and lower levels of negative emotions post‐simulation compared with presimulation.
Additionally, previous studies do not account for the nesting (e.g. trainees nested in teams) often present during simulation training, which may lead to errors in interpreting results (Leppink, 2015; Zyphur et al., 2008), especially for studies examining the effects of emotions on performance and learning (e.g. Behrens et al., 2019; Duffy et al., 2015, 2020). Thus, the understanding of the role(s) of emotions in team‐based medical simulations is incomplete as the nesting effects of the team and simulation scenario have not been considered. Trainees may respond differently across teams and simulation scenarios. Before understanding how emotions affect performance and team dynamics in simulation training, we need to identify the emotions experienced in team‐based simulations while accounting for the effects of nesting caused by team compositions and simulation scenarios.
Research objectives
We examined medical trainees' emotions and their effects on perceived performance and team mood during nested, team‐based medical simulations. To do so, we developed and collected the first evidence of validity for a novel self‐report tool (Situated Emotion Regulation Questionnaire; SERQ) capable of examining current emotional states, and perceptions of performance and team mood in one self‐report measure. We sought to answer the following research questions (RQs):
- RQ1. Which current emotions are reported by medical trainees after participating in a team‐based medical simulation?
- Expectation: As simulations are designed to be realistic, it is anticipated that medical trainees report experiencing a wide range of emotions after a simulation (positive, negative, activating and deactivating emotions; Madsgaard et al., 2022).
- RQ2. When accounting for nesting caused by variations in simulation scenarios, team compositions and repeated observations from individuals, how does medical trainees' reported intensity of current emotions after a team‐based medical simulation vary between team leaders and team members?
- Hypothesis: As team leaders are usually evaluated by medical experts as part of their curriculum, it is expected that team leaders will have higher intensities of negative activating emotions (Madsgaard et al., 2022).
- RQ3. When accounting for nesting (simulation, team, individual), do the current emotions after a team‐based medical simulation predict medical trainees' perceived (a) team mood, (b) team performance or (c) individual performance?
- Hypothesis: Positive emotions are expected to increase trainees' perceptions of performance and team mood as trainees may be more overconfident in their perceived simulation performance and team dynamics due to their current emotional state (Kensinger & Ford, 2020). Negative emotions are expected to impair perceptions as trainees may recall their errors during the simulation more accurately (Kensinger & Ford, 2020). Deactivating emotions are expected to be experienced at low intensities due to the high‐stakes nature of the simulations and are therefore expected to have minimal effects on participants' perceptions (Macdougall et al., 2013; Pekrun, 2024).
- RQ4. How do medical trainees discuss (a) emotions, (b) perceived performance and (c) team mood during post‐simulation debriefings?
- Hypothesis: As debriefings provide participants with a chance to reflect on their performance and experiences in the simulation, including their emotional reactions, we anticipated that participants would also discuss their concurrent emotions and perceptions of performance and team mood following the simulation.
- RQ5. How aligned are medical trainees' reported emotions and perceptions of performance between their self‐report tool responses and their post‐simulation debriefing responses?
- Hypothesis: Emotions reported in the SERQ are expected to capture medical trainees' emotions and therefore be in alignment with their responses during the debriefing period regarding their emotions. Perceptions of performance reported in the SERQ are expected to be in alignment with medical trainees' debriefing responses regarding their performance.
METHODS
A field‐based, observational, mixed‐methods study was conducted in a medical simulation training environment. Such a study is akin to a classroom study, but for physicians in training. The SERQ was completed immediately before and after the team‐based medical simulation. Audio‐video data were collected from simulations and debriefings. Informed consent was collected for all participants.
Participants
Data were collected from 106 residents (medical trainees) at two simulation centres at a North American medical university and affiliated hospital (Appendix A). Data were collected from 69 teams and 69 simulations. There was variance in how many teams participated in each simulation. Teams were not assigned by the researchers to minimize any interference with the simulation educational opportunity. Teams comprised of 2–8 residents (M = 3.37), typically with one leader. 71 residents participated in multiple simulations, playing the same or different roles, resulting in multiple datapoints for these participants. Overall, there were 242 datapoints collected from participants. From these, 79 datapoints were from leaders, while 163 were from team members. After applying listwise deletion to remove cases with missing data (n datapoint = 69; 28.5%), 173 datapoints from 85 participants were used for analyses (see Data S1: Material II).
Simulation environment
Presimulation, medical trainees were assigned or elected to be leaders or team members. Leaders were summatively assessed by medical experts, though these data were not collected. Simulations used high‐fidelity manikins (capable of responding to actions) with some also using confederates (e.g. medical professionals role‐playing in the simulation). On average, simulations were 14 minutes and 20 s long, ranging from 5 to 36 min. Debriefings were held after each simulation by medical experts (debriefers) where simulation content was discussed (M = 27 min and 21 s, range: 6–59 min). Audio‐video equipment present in the simulation centres recorded the simulation scenarios and debriefings.
The study did not interfere with the manner in which simulations were used in the curriculum. Thus, there was heterogeneity in the simulations, including the team size and difficulty, as well as the debriefings, including the number of debriefers, the quality of the debriefings and the debriefing framework (if any were used at all).
Situated Emotion Regulation Questionnaire (SERQ)
For information regarding the development goals of the SERQ, see Data S1: Material III. The SERQ provides a narrative‐style summary of participants' responses (Appendix B) that is automatically emailed to participants to encourage reflection and potentially increase the quality of the emotions phase of debriefings (beyond the scope of this study, but a future aim). The SERQ (Data S1: Material IV) includes a modified version of the Medical Emotion Scale (MES; Duffy et al., 2020), drawing upon 9 items and adding 2 more items (stress and nervousness). Further justification and validity evidence the SERQ draws from can be found in Data S1: Material I.
Performance‐ and team mood‐related items were adapted from Webster and Hadwin's Socio‐Emotional Sampling Tool (2014) and Socio‐Emotional Reflection Tool (2012) to fit a medical education context. This allowed participants to receive a self‐narrative‐style summary immediately after completing the SERQ that would capture their perceptions and possibly support further self‐reflection. The adapted items were single‐item responses which allowed for brevity to accommodate the logistical constraints of medical training. Four external medical experts provided feedback on the SERQ during its development.
In the SERQ, participants indicated the intensity (i.e. ‘Please indicate how you feel right now […]’ for each affective state; 1 = not at all, 2 = a little, 3 = moderately, 4 = strongly, 5 = very strongly) of 11 affective states while thinking about the simulation that was upcoming (pre‐SERQ) or had already been completed (i.e. after the simulation; post‐SERQ). The affective states were: curiosity, confusion, shame, relief, stress, frustration, hopelessness, happiness, hopefulness, pride and nervousness. Due to limited sample size and power constraints, item removal and reduction were conducted, reducing the number of items to 7 emotions (see Data S1: Material V–IX for justification). The items used for the analyses were: curiosity, confusion, shame, frustration, pride, nervousness and a variable comprising the average of ratings of happiness and hopefulness.
The post‐SERQ also measures participants' perceptions of team performance (i.e. satisfaction with the team's performance; 1 = very unsatisfied, 5 = very satisfied), individual performance (i.e. satisfaction with their own performance; 1 = very unsatisfied, 5 = very satisfied) and team mood during the simulation (1 = very negative, 5 = very positive). It also contains items related to emotion regulation strategies; however, these were not used in the presented analyses because they were beyond the scope of our research questions.
Qualitative content analysis: Source of validity evidence (RQs 4–5)
We expected participants' spontaneous debriefing responses related to their current emotions post‐simulation and perceptions of individual performance, team performance and team mood to align with their post‐SERQ responses. Qualitative content analysis was conducted in accordance with Mayring's (2014) guidelines to determine if participants' responses were aligned between the debriefings and self‐reports to ascertain the first evidence of validity for the SERQ. From 69 debriefings, 13 were identified where all participants had consented and provided audio‐video and self‐report data. Notably, 13 of the 32 participants were in multiple debriefings. The first author deidentified the debriefing audios. Trained undergraduate volunteers transcribed the deidentified audios, and the first author reviewed the transcriptions. The first author, in consultation with the senior author, iteratively developed and applied the coding scheme to the transcriptions.
Codes were developed deductively and inductively, using items in the SERQ and any debriefing responses that were not in the SERQ (Appendix C). Details related to observer/debriefer coding and findings can be found in Data S1: Material X.
An observation was defined as the presence of a specific code for each participant during a debriefing. For example, if a participant had 2 ‘confused’ codes during one debriefing and 3 ‘confused’ codes for another debriefing, they would be considered 2 ‘confused’ observations as they had ‘confused’ codes present across two different debriefings. Observations were compared with SERQ responses. In total, 40 observations from 32 participants were used for analysis.
Comments about team mood or performance made by a team member regarding another member of the team were considered proxies for perceptions of team mood or team performance, even if the comment was made only in reference to a single member rather than the entire team (Shapiro et al., 2008). Performance‐ and team mood‐related observations were based on the number of positively‐ and negatively‐oriented codes for each participant. Participants were categorized into ‘positive perceptions’, ‘negative perceptions’ and ‘mixed perceptions’ observations based on verbal statements made across the entire debriefing session. Participants categorized into ‘positive perceptions’ had greater than 50% of their coded debriefing statements be positively‐oriented. For example, if a participant had expressed 3 statements during the debriefing indicating that they believed they performed well (positively‐oriented response) and one statement indicating that they believed they did not perform well (negatively‐oriented response), they would be categorized as having ‘positive perceptions’ since 75% of their debriefing statements were positively‐oriented. ‘Negative perceptions’ were those with greater than 50% of their debriefing statements coded as negatively‐oriented. ‘Mixed perceptions’ had mixed debriefing responses and included those with 50% or less of their statements coded as negatively‐ or positively‐oriented. For example, if a participant had 2 statements during the debriefing indicating that they believed they performed well, 2 statements indicating they believed they performed poorly and 1 statement where it was unclear how they felt about their performance (e.g. a neutral statement), they were categorized as ‘mixed perceptions’ as < 50% of their statements were positively‐ or negatively‐oriented.
Information on alignment can be found in Data S1: Material XI.
Statistical analysis (RQs 1–5)
Data were analysed using Stata BE 18.0 (StataCorp, 2023) and IBM SPSS Statistics, Version 28. All Likert‐type scale responses (1–5 or 1–7) were treated as continuous, as literature suggests that Likert‐type scales with five or more categories can reasonably approximate interval‐level data (Norman, 2010). To account for simulation and team heterogeneity and ensure type I error rates were not inflated from downwardly biased standard errors, multi‐level modelling analyses with a cross‐classified, multiple membership design were used, with simulation (e.g. unique simulation scenarios) and team (e.g. the unique composition of individuals within teams) as the second levels, and individuals (e.g. individual participants) as the first level (Figure 1). When the variance accounted for by the nesting was negligible for certain levels (ICCs < .05), those levels were removed from the final models. No multi‐collinearity was found between the independent variables across all models (Data S1: Material XII–XIII). Multi‐level models with additional covariates (gender and racialized minority status) were also conducted (Data S1: Material XIV) but raised concerns about power, as there were an inadequate number of observations for the number of variables in the model. Bonferroni corrections were used to account for family‐wise error rates. Codes for analyses are provided in Data S1: Material XV.
Schematic of the multiple membership model of the dataset. Arrows indicate the nesting present in the dataset. Double arrows indicate multiple membership. Level 1 (individuals) is nested within level 2 (teams and simulations).
RESULTS
Medical trainees' reported emotions (RQ1)
Descriptive statistics are provided in Table 1. Compared to team members after a team‐based medical simulation, leaders reported descriptively higher mean intensities of happiness, pride, relief and all negatively valenced emotions than team members. Conversely, the mean intensities for curiosity and hopefulness were lower for leaders than for team members.
Comparing leaders' and team members' emotions (RQ2)
Seven multi‐level model analyses were conducted to determine differences in emotions between team leaders and team members after a team‐based medical simulation. The multi‐level models were constructed with the emotion as the dependent variable at the individual level (null and predictor‐only models: Appendices D and E). For all full models, simulation role (i.e. team leader vs. team member) was entered as a predictor while presimulation emotion intensity, training level (i.e. PGY) and specialty (e.g. internal medicine, anaesthesiology) were entered as covariates (Table 2). To account for the family‐wise error rate using Bonferroni corrections, significance was defined at the p < .007 level. The post‐simulation shame model indicated significant differences between team leaders and team members. Specifically, team leaders reported higher levels of shame after a simulation as compared to team members (b = .38, p = .001, η ^2^ = .04, power = .99).
Individual performance predictors (RQ3)
A multi‐level model analysis was conducted to determine whether emotion intensities after the simulation are predictors of perceived individual performance for medical trainees. Post‐simulation curiosity, confusion, shame, frustration, pride, nervousness and a happiness and hopefulness variable (see Data S1: Material V–IX for more information on these variables) were entered as predictors while presimulation emotions, simulation role, training level and specialty were entered as covariates. To account for the family‐wise error rate, significance was defined at the p < .007 level. The results of the null, predictor‐only and full model are reported (Table 3). While the predictor‐only model revealed that post‐simulation pride was a significant positive predictor of perceived individual performance (b = .25, p = .001, η ^2^ = .06, power > .99); once covariates were added to create the full model, and no post‐simulation emotion was a significant predictor of perceived individual performance.
Team perception models (RQ3)
The following analyses used multi‐level model analyses. Post‐simulation curiosity, confusion, shame, frustration, pride, nervousness and a happiness and hopefulness variable were entered as predictors while presimulation emotions, simulation role, training level and specialty were entered as covariates. To account for the family‐wise error rate, significance was defined at the p < .007 level.
Team performance predictors
A multi‐level model analysis was conducted to determine whether emotion intensities after the simulation are predictors of perceived team performance for medical trainees. The results of the null, predictor‐only and full model are reported (Table 4). From the model, the post‐simulation happiness and hopefulness variable was a significant predictor at the individual level for perceptions of team performance. As scores for the post‐simulation happiness and hopefulness variable increased, perceptions of team performance increased, b = .22; p = .001; η ^2^ = .08; power > .99.
Team mood predictors
A multi‐level model was conducted to determine whether emotion intensities after the simulation are predictors of perceived team mood (measured in the post‐SERQ). The results of the null, predictor‐only and full model are reported (Table 5). Post‐simulation frustration and the post‐simulation happiness and hopefulness variable were both significant predictors for perceptions of team mood. Higher scores for the happiness and hopefulness variable were associated with more positive perceptions of team mood, b = .18, p = .001, η ^2^ = .06, power > .99. Conversely, when ratings of post‐simulation frustration were higher, perceptions of team mood were lower, b = −.19, p = .003, η ^2^ = .04, power = .96.
Debriefing responses (RQ4)
Out of 16 observations of affective states expressed spontaneously during the debriefing and used in the analysis, 8 observations were confusion, 4 were stress, 2 were happiness and 2 were nervousness (Table 6). When looking at emotion quadrants, no deactivating emotions (positive or negative), 2 positive activating emotions and 14 negative activating emotions were expressed during the debriefing. All 8 debriefing observations of participants who commented on their own performance were negative perceptions. From the 33 debriefing team performance observations, all but one were positive perceptions. For perceptions of team mood, 13 observations were positive perceptions and 2 were negative perceptions.
Debriefing and SERQ alignment (RQ5)
From the observations of discrete affective states during the debriefing, 4 were in alignment with their SERQ responses while 8 were not in alignment (Table 6). However, when comparing the quadrants of emotions between the debriefing and the SERQ, 6 observations out of 14 were in alignment. When comparing affective states expressed during the debriefing to those which were reported in the SERQ as being moderate or higher in intensity, there was only 1 positive activating emotion observation (happiness) during the debriefing compared with the 22 in the SERQ, and 4 negative activating emotion debriefing observations compared with the 10 in the SERQ (Figure 2).
Discrete affective states reported by participants (N) in the SERQ as being moderately intense or higher compared with their expression during debriefing sessions.
Alignment of perceptions for performance and team mood can be found in Table 7. Out of the 8 debriefing observations of individual performance, 4 were in alignment with their post‐SERQ perception of individual performance response. From the 33 observations of team performance, 24 were in alignment with their SERQ perception of team performance responses while 9 were not. For perceptions of team mood, 15 observations out of 16 were in alignment with participants' post‐SERQ responses.
Chi‐square tests (Table 8) found statistically significant associations between medical trainees' responses in the SERQ and their debriefing responses for participants' perceptions of team performance (χ^2^(1) = 6.82, p = .009, V = .45, power = .97) and team mood (χ^2^(1) = 12.25, p < .001, V = .88, power > .99), specifically with the SERQ and debriefing responses being significantly aligned.
DISCUSSION
This study examined medical trainees' emotions after team‐based medical simulations and their effects on perceptions of performance and team mood while accounting for nesting effects. Multi‐level model analyses revealed differences between team leaders and members in their post‐simulation emotions, and significant effects on team performance and mood. Debriefing observations indicated potential limitations in how medical trainees discuss emotions, performance and team mood during debriefings, indicating potential gaps in current debriefing frameworks or their applications. The first evidence of validity for the SERQ is promising, indicating its potential use in future research and educational endeavours with revisions. These findings can inform training strategies for medical trainees to facilitate success in simulations and future practice.
Medical trainees' emotions and effects on performance and mood
When comparing the self‐reported emotions of team leaders and team members, leaders reported significantly higher levels of post‐simulation shame in the SERQ. In the medical education literature, shame has emerged as an emotion of interest due to its associations with mental health and learning (e.g. Bynum et al., 2019; Nomura et al., 2021). Leaders may be more self‐critical compared with their team members due to being in the ‘hot seat’. The findings on shame align with prior research suggesting that leadership roles heighten emotional vulnerability due to increased responsibility and perceived scrutiny (Madsgaard et al., 2022). Thus, the discrepancy between leaders' and team members' shame indicates there may be a need to better support trainees as they transition into leadership roles to help them manage the increased responsibility and perceived scrutiny of individuals in their role.
None of the post‐simulation emotions significantly predicted perceived individual performance. However, post‐simulation happiness and hopefulness, categorized as positive activating emotions in CVT, were positively associated with perceived team performance. Similar findings have been reported for university students, where their task‐related emotions were associated with team rather than individual performance (Heerdink & Homan, 2024). This may suggest that post‐simulation positive activating emotions are more strongly linked to group‐level evaluations, like perceived team performance, which are often more salient in team‐based scenarios as outcomes are shared by team members. Individual performance, by comparison, may exert less influence on or be less influenced by emotions in these settings. These findings highlight that the effects of emotions are context‐dependent and shaped by the social and contextual factors.
The findings for perceived team performance align with CVT, which postulates that positive activating emotions tend to improve performance. Our findings add to prior work by highlighting the role of positive emotions in medical simulation contexts. Duffy et al. (2020) found that negative activating and deactivating emotions were negatively correlated with performance. Their study used emotion quadrants to analyse all emotions instead of discrete emotions, which may have obscured the results of individual emotions, including specific positive emotions. Our results show that discrete positive emotions also matter and warrant further study, possibly due to the approach of analysing most emotions discretely.
Next, it was found that trainees' post‐simulation frustration (negative predictor) and the post‐simulation happiness and hopefulness variable (positive predictor) were significant predictors for ratings of team mood. By contrast, other post‐simulation emotions were not significant predictors of team mood, which may reflect these emotions focus on the individual and centre on personal outcomes or internal states rather than interpersonal dynamics. As such, these emotions may be less likely to contribute to emotional contagion, aligning with prior literature suggesting that socially oriented emotions that have more outward expressions (e.g. happiness, frustration) are more likely to contribute to emotional contagion and be perceived by others in group settings (Barsade, 2002; van Kleef & Côté, 2022). It is also possible that some of the emotion predictors in the models exhibited multi‐collinearity, despite our best efforts, which contributed to the non‐significance of individual predictors despite the models overall explaining substantial variance.
The significant predictors of perceived team mood revealed that, consistent with CVT, the valence of emotions is associated with how trainees perceive their team's mood. These findings also align with and extend the current understanding of emotion transmission in educational settings (Herrando & Constantinides, 2021; Mitchell & Boyle, 2019; Yang et al., 2021), suggesting that individuals' emotional states can influence and be influenced by the emotional expressions of their teammates and influence team dynamics in team‐based medical simulations. The findings suggest that positive emotional states in one team member may contribute to an overall positive team mood, emphasizing the interpersonal and socially contagious nature of emotions in team‐based simulation contexts. These findings also suggest simulation design could incorporate training strategies to foster positive emotions and enhance team mood and performance; however, further research on the directionality of the relationship between emotions and these constructs is needed.
Although only a subset of emotion predictors emerged as statistically significant in the multi‐level models, the models overall explained a meaningful portion of variance in the outcome measures (with the majority exceeding 20.0% of the explained variance). This suggests that, despite a limited number of individual predictors reaching significance, the combination of fixed and random effects meaningfully captured how participants emotionally responded to and evaluated the simulation experience. Thus, these results accounting for the nestedness in simulations (as accounted for by the random effects) indicate that there is a non‐negligible relationship between emotions and context (e.g. individual participant, team composition, simulation scenario) in simulation‐based education. These results reinforce the importance of ecological validity in studying complex educational environments (Markauskaite et al., 2024) and the potential influence of emotions on how trainees evaluate simulation outcomes.
The multiple membership cross‐classified structure of the dataset was captured in the multi‐level models, allowing for the real‐world training environment of medical trainees to be accounted for. This approach accounted for variation across individuals, teams and simulations, reflecting the complexity of simulation‐based medical training. All multi‐level models had at least the individual level accounting for meaningful variance. For team performance and team mood, multiple levels (e.g. individual, team, simulation) explained non‐negligible variation (ICC > .05). By including all available datapoints, regardless of repetition from the same participant, we preserved the richness of the dataset and ensured that the diversity of trainees' experiences was represented in the analysis. The meaningful variance accounted for by the multi‐level models highlights the importance of considering nestedness, especially the nestedness of multiple occasions within individuals, for emotions. Previous studies that had nestedness but did not account for it within their analyses (e.g. Keskitalo & Ruokamo, 2021) could possibly have generated incomplete conclusions.
Our multi‐level approach provides a methodological advance for emotion research in medical education by enabling a more context‐sensitive and ecologically valid understanding of medical trainees' emotions regarding team‐based simulations. This matters because it allows us to capture influences from the nestedness of the data that other studies may have missed. As a result, our findings offer a more complete picture of emotions in medical education. Thus, our findings help advance the understanding of emotions and their effects in medical education towards being more accurate of real‐world medical education environments and encourage others to use similar approaches in their research.
Medical trainees' expressions during debriefings and validity evidence
The first evidence of validity gathered for the SERQ demonstrated validity evidence based on content, response processes, internal structure and relations to other variables, particularly with post‐simulation emotions. From the debriefings, while a majority of the emotion quadrants (57%) were aligned between participants' SERQ and debriefing responses, only 43% of discrete emotions (i.e. confusion) were aligned, which may be indicative that the SERQ may not capture or accurately reflect specific emotions experienced by participants right after the simulation but may capture more general emotional states (i.e. emotion quadrants). Non‐researcher controlled debriefings may explain mismatches with SERQ data as debriefers may not have prompted participants to elaborate on the full range of emotional experiences the participants had or the participants may not have felt comfortable sharing their emotions with the medical expert debriefer due to perceived scrutiny. Other explanations for misalignment could be that the wording in the SERQ prompted a different time frame than the debriefing (i.e. current in the SERQ, retrospective in the debriefing), the debriefing specified tasks or outcomes (different object foci), debriefing responses were influenced by the trajectory or comments made by others or that participants felt more comfortable discussing certain emotions over their most intense emotions.
Though debriefing frameworks explore trainees' emotional reactions, negative activating emotions were found to be expressed the most during the debriefings despite positive activating emotions being the most reported at intensities of moderate or higher in the SERQ. This may be due to debriefings focusing on challenges or issues that occurred during the simulation to teach trainees how to navigate those particular tasks or timepoints. However, there may also be a gap in debriefing frameworks or in the training debriefers and/or trainees receive such that positive emotions are not being discussed to the degree they should be, especially if these emotions relate to critical points during the simulations. Existing debriefing models, like PEARLS (Bajaj et al., 2018), may unintentionally prioritize reflections on performance over emotional reflections. This warrants a larger focus on all emotions participants experience, especially positive ones, aligning with multi‐level analyses results.
It is also interesting to note the discrepancy in how many perceptions of individual performance debriefing observations there were (n = 8) compared with perceptions of team performance and team mood. The small number of observations limited the ability to assess alignment between individual performance debriefing observations and SERQ responses statistically. Additionally, individual performance may be discussed more critically during debriefings to identify areas of improvement, rather than what went well. With only half of the individual performance debriefing observations aligning with the SERQ responses, it is possible that the current wording of the SERQ asking participants to reflect on their satisfaction with their performance may be interpreted differently from how participants perceived their own performance. For example, a participant may be satisfied with their performance given their skill level and prior knowledge or performance in a critical task during the simulation but may not have perceived that their performance was satisfactory in terms of competence.
With 73% of participants' perceptions of team performance debriefing responses significantly aligned with their SERQ responses, the SERQ demonstrates promising validity evidence based on content and relations to other variables for perceptions of team performance. Perceptions of team mood were also significantly aligned between participants' debriefing responses and SERQ responses, with only one participant observation (6%) being misaligned. With such high rates of alignment, the SERQ exhibits promising validity evidence of relation to other variables for capturing participants' perceptions of team mood and perceptions of team performance.
Overall, the SERQ exhibited promising validity evidence based on content and relations to other variables as demonstrated by the alignment between debriefing and self‐report responses, especially for the single‐item responses for perceptions of team performance and mood. The current validity evidence for the post‐SERQ emotion items and perceptions of individual performance indicates that these items, while capturing participants' experiences to some extent, may require further revisions. Alternatively, and we believe more likely, they may indicate that the unscripted debriefings in this study alone are not sufficient to accurately obtain participants' experiences regarding simulations, with other methods, such as semi‐structured interviews or retrospective video reviews, possibly allowing for richer data sources for validity evidence. With additional sources of validity evidence, the SERQ shows promise as a research and educational tool.
Limitations and future directions
The study was conducted in a single North American institution, which may limit the generalizability of the findings to other cultural or institutional contexts. Participants may have difficulty accurately identifying their emotions, perceptions or distinguishing between an emotion for a given subtask at a given time in the simulation scenario versus emotions over the entire set of subtasks in the simulation scenarios. Participants had to accomplish multiple subtasks throughout the simulations, and some tasks at a given time in the simulation may have been more important and more emotion‐generating than others. Participants were also asked to report their current emotional state immediately after the simulation, which did not provide participants the opportunity to report on their dynamic emotional fluctuations during the simulation. It should also be noted that simulations varied in presimulation procedures, with some allowing residents to volunteer for roles, others being preassigned but notified in advance and others finding out their role right before entering the simulation. This could have led to significant variance in the reported presimulation emotions and therefore affected the models.
Methodologically, one limitation was power constraints limiting our ability to include all emotions and covariates in our statistical analysis. Despite these constraints, we conducted multi‐level modelling with all emotions and covariates and discovered similar results (Data S1: Material XVIII–XX). We also used listwise deletion to handle missing data, which may have introduced bias if the data were not truly missing completely at random and may have affected our findings. Furthermore, Likert‐scale items were treated as continuous. However, this approach may not fully reflect the ordinal nature of the data, which could bias results. Future studies should explore methods that reflect the ordinal nature of self‐report data.
The validity evidence presented also draws into question the strength of our findings as it is possible the SERQ does not adequately capture perceptions of concurrent emotions after the simulation or individual performance. However, the validity evidence was limited by non‐researcher controlled or led debriefings and a lack of probing. Expert debriefers largely did not directly probe participants regarding the extent of post‐simulation emotions or tease apart perceptions of individual performance from team performance. Participants were also not asked about their teammates' feelings, which may have limited elaboration, affecting alignment with their SERQ responses.
Future research should use multi‐level models, especially when in hierarchical or team‐based situations. Further research should examine additional measures of emotion to help overcome the limitations of self‐report measures, including those with good evidence of validity (Duffy et al., 2020). Additional validity evidence should be collected, ideally including other data channels (e.g. semi‐structured interviews). As effective emotion regulation can improve team members' and leaders' perceptions of team mood and performance, medical trainees' emotion regulation strategies should also be examined to determine their effectiveness and impact on performance.
CONCLUSIONS
Our multi‐level analyses revealed the importance of accounting for nesting within team‐based simulations, specifically at the individual, team composition and simulation scenario levels, potentially challenging the strength of previous related work. Our results provide insight into potential areas to expand medical training, specifically regarding which emotions to target for regulation to possibly improve perceptions of team mood and team performance. Importantly, our work lays the foundation for future medical education multi‐level analyses on emotions and related constructs, which may lead to adjustments in the medical curricula research and also provides evidence that team members' self‐reported emotions are at least as important to consider in research and simulation training as team leaders'.
Additionally, the items for emotions, perceptions of team performance and team mood in the SERQ have demonstrated promising validity evidence within team‐based medical simulations. With the SERQ's narrative‐style summary sent directly to participants and its potential to serve as a reflective tool, the SERQ may be used in the future as a research and educational tool, especially as efforts are underway to provide further validity evidence from additional data channels and participant populations (i.e. interprofessional medical teams).
AUTHOR CONTRIBUTIONS
Keerat Grewal: Conceptualization; software; data curation; formal analysis; investigation; funding acquisition; methodology; project administration; visualization; writing – original draft. Sayed Azher: Software; methodology; investigation; writing – review and editing. Matthew Moreno: Methodology; investigation; project administration; writing – review and editing. Reinhard Pekrun: Funding acquisition; methodology; writing – review and editing. Jeffrey Wiseman: Funding acquisition; writing – review and editing; methodology. Jessica Flake: Formal analysis; writing – review and editing; resources. Susanne Lajoie: Funding acquisition; methodology; writing – review and editing. Ning‐Zi Sun: Methodology; resources; writing – review and editing. Gerald M. Fried: Funding acquisition; writing – review and editing; methodology. Elene Khalil: Methodology; resources; writing – review and editing. Jason M. Harley: Conceptualization; funding acquisition; methodology; project administration; resources; supervision; formal analysis; investigation; writing – review and editing.
FUNDING INFORMATION
This work was supported by a Partnership Development Grant from the Social Sciences and Humanities Research Council of Canada [grant number: 890‐2020‐0060] awarded to the senior author and P.I., J.M. Harley. This work was also supported by a doctoral research scholarship from the Fonds de recherche du Québec—Société et culture (330021) and the Social Sciences and Humanities Research Council of Canada (752–2024‐1350) awarded to the first author, K. Grewal.
CONFLICT OF INTEREST STATEMENT
The authors report no conflicts of interest.
CONSENT
Prior to data collection, participants provided informed consent and were informed of their right to freely withdraw consent at any time during the data collection. Consent was obtained via a signature and written approval on a consent form approved by our institutional research ethics board.
Supporting information
Data S1.
The reference list from the paper itself. Each links out to its DOI / PubMed record.
- 1Ahn, B. , Maurice‐Ventouris, M. , Bilgic, E. , Yang, A. , Lau, C. H.‐H. , Peters, H. , Li, K. , Chang‐Ou, D. , & Harley, J. M. (2023). A scoping review of emotions and related constructs in simulation‐based education research articles. Advances in Simulation, 8(1), 22. 10.1186/s 41077-023-00258-z 37717029 PMC 10505334 · doi ↗ · pubmed ↗
- 2American Educational Research Association, American Psychological Association, & National Council on Measurement in Education . (2014). Standards for educational and psychological testing. American Educational Research Association.
- 3Bajaj, K. , Meguerdichian, M. , Thoma, B. , Huang, S. , Eppich, W. , & Cheng, A. (2018). The PEARLS healthcare debriefing tool. Academic Medicine, 93(2), 336. 10.1097/ACM.0000000000002035 29381495 · doi ↗ · pubmed ↗
- 4Barsade, S. G. (2002). The ripple effect: Emotional contagion and its influence on group behavior. Administrative Science Quarterly, 47(4), 644–675. 10.2307/3094912 · doi ↗
- 5Behrens, C. C. , Dolmans, D. H. , Gormley, G. J. , & Driessen, E. W. (2019). Exploring undergraduate students achievement emotions during ward round simulation: A mixed‐method study. BMC Medical Education, 19(1), 316. 10.1186/s 12909-019-1753-1 31438939 PMC 6704623 · doi ↗ · pubmed ↗
- 6Bynum, W. E. I. , Artino, A. R. J. , Uijtdehaage, S. , Webb, A. M. B. , & Varpio, L. (2019). Sentinel emotional events: The nature, triggers, and effects of shame experiences in medical residents. Academic Medicine, 94(1), 85–93. 10.1097/ACM.0000000000002479 30277959 · doi ↗ · pubmed ↗
- 7Camacho‐Morles, J. , Slemp, G. R. , Pekrun, R. , Loderer, K. , Hou, H. , & Oades, L. G. (2021). Activity achievement emotions and academic performance: A meta‐analysis. Educational Psychology Review, 33(3), 1051–1095. 10.1007/s 10648-020-09585-3 · doi ↗
- 8Duffy, M. C. , Azevedo, R. , Sun, N.‐Z. , Griscom, S. E. , Stead, V. , Crelinsten, L. , Wiseman, J. , Maniatis, T. , & Lachapelle, K. (2015). Team regulation in a simulated medical emergency: An in‐depth analysis of cognitive, metacognitive, and affective processes. Instructional Science, 43(3), 401–426. 10.1007/s 11251-014-9333-6 · doi ↗