Prevalence of Illicit Drug Detection in 5 US Cities Among Out-of-Treatment People Who Inject Drugs
Nabila El-Bassel, Steven Shoptaw, Timothy Skalland, Brett Hanscom, William Clarke, Mark A. Marzinke, Jessica M. Fogel, Paul Richardson, Rahul Paul Choudhury, Cecile Denis, David Goodman-Meza, Irene Kuo, Jordan E. Lake, Ellen A. B. Morrison, Amy M. Richards

TL;DR
This study finds high rates of fentanyl and xylazine use among drug users in 5 US cities, stressing the need for better drug surveillance and harm reduction.
Contribution
The study provides new insights into drug use patterns among marginalized populations and highlights geographic and demographic variations in illicit drug detection.
Findings
Fentanyl was detected in 93% of participants, with high prevalence across all cities.
Xylazine detection increased over time in New York City and remained high in Philadelphia.
Unhoused individuals had higher cocaine detection, and recently incarcerated individuals had higher stimulant detection.
Abstract
This cross-sectional study examines prevalence of and trends in illicit drugs detected over 2 years in 5 US cities among individuals who inject drugs and are not engaged in medical care. What is the prevalence of illicit drug detection among people who inject drugs who are not engaged in medical care across 5 US cities? In this cross-sectional study of 444 people who inject drugs, fentanyl was detected among 93%, xylazine among 53%, polysubstance drugs among 95%, and amphetamine among 67%; unhoused and recently incarcerated individuals had higher prevalence of cocaine and stimulant detection, respectively. Amphetamine prevalence increased over time in Washington, DC, and Philadelphia had the highest prevalence of xylazine detection. The findings suggest localized, real-time drug surveillance for out-of-treatment individuals who inject drugs, often missed by traditional public health…
Genes, proteins, chemicals, diseases, species, mutations and cell lines named across the full text — each resolved to its canonical identifier and authoritative record.
Click any figure to enlarge with its caption.
 Figure
| Characteristic | Participants, No. (%) | |||||
|---|---|---|---|---|---|---|
| Overall (N = 444) | New York City (n = 94) | Los Angeles (n = 93) | Washington, DC (n = 41) | Houston (n = 104) | Philadelphia (n = 112) | |
| Age group, y | ||||||
| <30 | 49 (11.0) | 4 (4.3) | 9 (9.7) | 3 (7.3) | 18 (17.3) | 15 (13.4) |
| 30-49 | 267 (60.1) | 54 (57.4) | 51 (54.8) | 15 (36.6) | 64 (61.5) | 83 (74.1) |
| ≥50 | 128 (28.8) | 36 (38.3) | 33 (35.5) | 23 (56.1) | 22 (21.2) | 14 (12.5) |
| Sex assigned at birth | ||||||
| Female | 141 (31.8) | 27 (28.7) | 26 (28.0) | 9 (22.0) | 36 (34.6) | 43 (38.4) |
| Male | 303 (68.2) | 67 (71.3) | 67 (72.0) | 32 (78.0) | 68 (65.4) | 69 (61.6) |
| Ethnicity and race | ||||||
| Hispanic or Latino | 145 (32.7) | 51 (54.3) | 51 (54.8) | 3 (7.3) | 30 (28.8) | 10 (8.9) |
| Non-Hispanic Black or African American | 83 (18.7) | 24 (25.5) | 4 (4.3) | 33 (80.5) | 8 (7.7) | 14 (12.5) |
| Non-Hispanic White | 199 (44.8) | 16 (17.0) | 35 (37.6) | 0 | 63 (60.6) | 85 (75.9) |
| Other non-Hispanic race | 17 (3.8) | 3 (3.2) | 3 (3.2) | 5 (12.2) | 3 (2.9) | 3 (2.7) |
| Current housing status, No./total No. (%) | ||||||
| Housed | 237/440 (53.9) | 38/94 (40.4) | 77/93 (82.8) | 29/40 (72.5) | 57/101 (56.4) | 36/112 (32.1) |
| Unhoused | 203/440 (46.1) | 56/94 (59.6) | 16/93 (17.2) | 11/40 (27.5) | 44/101 (43.6) | 76/112 (67.9) |
| Missing data | 4 | 0 | 0 | 1 | 3 | 0 |
| Incarceration in the past 6 mo, No./total No. (%) | ||||||
| No | 351/442 (79.4) | 74/93 (79.6) | 76/93 (81.7) | 34/41 (82.9) | 73/103 (70.9) | 94/112 (83.9) |
| Yes | 91/442 (20.6) | 19/93 (20.4) | 17/93 (18.3) | 7/41 (17.1) | 30/103 (29.1) | 18/112 (16.1) |
| Missing | 2 | 1 | 0 | 0 | 1 | 0 |
| Ever taken MOUD | ||||||
| No | 164 (36.9) | 90 (95.7) | 27 (29.0) | 13 (31.7) | 30 (28.8) | 4 (3.6) |
| Yes | 280 (63.1) | 4 (4.3) | 66 (71.0) | 28 (68.3) | 74 (71.2) | 108 (96.4) |
| Methadone treatment program in the past year, No./total No. (%) | ||||||
| No | 383/441 (86.8) | 91/93 (97.8) | 80/92 (87.0) | 36/41 (87.8) | 87/103 (84.5) | 89/112 (79.5) |
| Yes | 58/441 (13.2) | 2/93 (2.2) | 12/92 (13.0) | 5/41 (12.2) | 16/103 (15.5) | 23/112 (20.5) |
| Missing, not known, or declined to answer | 3 | 1 | 1 | 0 | 1 | 0 |
| Engaged with harm reduction in the past year, No./total No. (%) | ||||||
| No | 7/443 (1.6) | 1/93 (1.1) | 2/93 (2.2) | 0 | 3/104 (2.9) | 1/112 (0.9) |
| Yes | 436/443 (98.4) | 92/93 (98.9) | 91/93 (97.8) | 41/41 (100) | 101/104 (97.1) | 111/112 (99.1) |
| Missing, not known, or declined to answer | 1 | 1 | 0 | 0 | 0 | 0 |
| Drug | Participants, No. (%) | |||||
|---|---|---|---|---|---|---|
| Overall (N = 444) | New York City (n = 94) | Los Angeles (n = 93) | Washington, DC (n = 41) | Houston (n = 104) | Philadelphia (n = 112) | |
| Amphetamine-type stimulants | 299 (67.3) | 25 (26.6) | 87 (93.6) | 12 (29.3) | 84 (80.8) | 91 (81.3) |
| Benzodiazepines | 36 (8.1) | 8 (8.5) | 13 (14.0) | 0 | 12 (11.5) | 3 (2.7) |
| Buprenorphine | 23 (5.2) | 1 (1.1) | 8 (8.6) | 2 (4.9) | 8 (7.7) | 4 (3.6) |
| Cannabis | 28 (6.3) | 3 (3.2) | 6 (6.5) | 5 (12.2) | 10 (9.6) | 4 (3.6) |
| Cocaine | 328 (73.9) | 86 (91.5) | 28 (30.1) | 36 (87.8) | 73 (70.2) | 105 (93.8) |
| Fentanyl | 414 (93.2) | 91 (96.8) | 87 (93.6) | 40 (97.6) | 85 (81.7) | 111 (99.1) |
| Methadone | 102 (23.0) | 46 (48.9) | 7 (7.5) | 12 (29.3) | 20 (19.2) | 17 (15.2) |
| Opiates | 272 (61.3) | 80 (85.1) | 42 (45.2) | 21 (51.2) | 81 (77.9) | 48 (42.9) |
| Synthetic opioids | 273 (61.5) | 56 (59.6) | 32 (34.4) | 29 (70.7) | 69 (66.3) | 87 (77.7) |
| Xylazine | 234 (52.7) | 68 (72.3) | 6 (6.5) | 31 (75.6) | 18 (17.3) | 111 (99.1) |
| Polysubstance use | 421 (94.8) | 87 (92.6) | 89 (95.7) | 39 (95.1) | 95 (91.4) | 111 (99.1) |
| Drug | Participants, No./total No. (%) | Age 30-49 y vs <30 y | Age ≥50 y vs < 30 y | Age ≥50 y vs 30-49 y | |||
|---|---|---|---|---|---|---|---|
| Estimated difference (95% CI), % | Estimated difference (95% CI), % | Estimated difference (95% CI), % | |||||
| Amphetamine-type stimulants | |||||||
| <30 y | 31/49 (63.3) | 16.4 (4.6 to 28.3) | .007 | 7.7 (−5.7 to 21.0) | .26 | −8.8 (−17.5 to −0.04) | .049 |
| 30-49 y | 197/267 (73.8) | ||||||
| ≥50 y | 71/128 (55.5) | ||||||
| Cocaine | |||||||
| <30 y | 28/49 (57.1) | 17.0 (4.8 to 29.1) | .006 | 17.1 (4.0 to 30.2) | .01 | 0.1 (−7.5 to 7.7) | .98 |
| 30-49 y | 206/267 (77.2) | ||||||
| ≥50 y | 94/128 (73.4) | ||||||
| Methadone | |||||||
| <30 y | 6/49 (12.2) | 5.2 (−6.1 to 16.5) | .37 | 16.2 (3.0 to 29.3) | .02 | 10.9 (1.7 to 20.2) | .02 |
| 30-49 y | 53/267 (19.9) | ||||||
| ≥50 y | 43/128 (33.6) | ||||||
| Xylazine | |||||||
| <30 y | 19/49 (38.8) | 14.5 (3.0 to 26.0) | .01 | 13.5 (1.4 to 25.6) | .03 | −1.1 (−7.9 to 5.7) | .76 |
| 30-49 y | 151/267 (56.6) | ||||||
| ≥50 y | 64/128 (50.0) | ||||||
| Polysubstance use | |||||||
| <30 y | 43/49 (87.8) | 9.8 (0.1 to 19.5) | .047 | 5.4 (−5.3 to 16.0) | .32 | −4.4 (−9.3 to 0.4) | .07 |
| 30-49 y | 260/267 (97.4) | ||||||
| ≥50 y | 118/128 (92.2) | ||||||
| Drug and site | Change over 6 mo of enrollment period (95 CI), % | |
|---|---|---|
| Amphetamine-type stimulants | ||
| New York City | 1.5 (−5.5 to 8.5) | .68 |
| Los Angeles | 1.7 (3.3 to 6.7) | .50 |
| Washington, DC | 15.0 (2.9 to 27.1) | .02 |
| Houston | −3.0 (−8.8 to 2.7) | .30 |
| Philadelphia | 4.5 (−1.1 to 10.1) | .12 |
| Fentanyl | ||
| New York City | 0.2 (−2.6 to 3.1) | .86 |
| Los Angeles | −0.6 (−5.4 to 4.2) | .81 |
| Washington, DC | −0.8 (−5.8 to 4.2) | .76 |
| Houston | −4.3 (−10.0 to 1.4) | .14 |
| Philadelphia | −0.9 (−3.3 to 1.5) | .25 |
| Xylazine | ||
| New York City | 10.3 (4.0 to 16.5) | .001 |
| Los Angeles | 0.6 (−4.2 to 5.4) | .81 |
| Washington, DC | 4.8 (−6.6 to 16.1) | .41 |
| Houston | 1.3 (−4.1 to 6.8) | .63 |
| Philadelphia | −0.9 (−3.3 to 1.5) | .25 |
| Polysubstance | ||
| New York City | 5.1 (−0.6 to 10.8) | .08 |
| Los Angeles | 7.1 (−0.5 to 14.8) | .07 |
| Washington, DC | 3.0 (−3.6 to 9.6) | .37 |
| Houston | 1.6 (−2.4 to 5.6) | .44 |
| Philadelphia | −0.9 (−3.3 to 1.5) | .25 |
Peer Reviews
No public reviews on file for this paper yet. If you reviewed it on a platform where reviews are public (OpenReview, ICLR, NeurIPS, ICML), you can paste yours below so the community can read it here.
Videos
No videos yet. Explain this paper in a talk, walkthrough, or lecture? Add one.
Taxonomy
TopicsHIV, Drug Use, Sexual Risk · Opioid Use Disorder Treatment · Forensic Toxicology and Drug Analysis
Introduction
The prevalence of injection drug use in the US remains a significant public health problem. The most recent prevalence estimates (2018) suggest there are 3.7 million people who inject drugs, or 1.5% of the US population, with the greatest burden on males and young populations aged 18 to 29 years.^1^ The overdose crisis disproportionately affects Black or African American adults, particularly those aged 35 to 54 years.^2,3^ Adults aged 55 years or older have experienced the steepest increases in overdose mortality.^2,3^
Incarceration significantly increases overdose vulnerability by disrupting opioid tolerance, limiting access to medications for opioid use disorder (MOUD), and creating a heightened risk of return to drug use upon release.^4^ Overdose death rates peak during the first 2 weeks after release from incarceration among people who use drugs, with overdose risk up to 40-fold greater compared with the general population.^5,6^ Postrelease stressors including housing instability and pervasive drug availability further exacerbate return to drug use.^7,8^ Homelessness is associated with overdose vulnerability, with several studies across the US indicating that homelessness is significantly and positively associated with opioid-involved overdose.^9,10,11^ Research also shows a direct association between the proportion of a population that is unhoused, prevalence of drug use, and overdose mortality, particularly in areas with widespread fentanyl exposure.^10,12^
Extensive research shows that injection drug use is associated with transmission of HIV, sexually transmitted infections, hepatitis C, and fatal and nonfatal overdose.^13,14,15^ Provisional data from the Centers for Disease Control and Prevention (CDC) National Center for Health Statistics indicated a 26.9% decrease in drug overdose deaths across all US regions in 2024 (80 391) compared with 2023 (110 037).^16^ Increased overdose fatality rates among people who use drugs (either injected or noninjected), however, have evolved into the fourth wave of the US drug overdose crisis.^17,18^ The current wave is strongly characterized by polysubstance use, defined as the use of fentanyl, opiates, or synthetic opioids with any amphetamine-type stimulants, benzodiazepines, cocaine, and/or xylazine—an α2 adrenergic agonist and veterinary anesthetic.^17,19^ Most fatalities in the fourth wave are attributed to fentanyl, with or without stimulant use,^19^ and methamphetamines remain a major drug of choice in the western US.^20^ Another important phenomenon of the fourth wave is the transition to smoking or inhaling drugs rather than injecting. Smoking has now surpassed injection as the leading route of ingestion for overdose fatalities.^20,21^
HIV Prevention Trials Network (HPTN) 094 was a randomized clinical trial evaluating an integrated mobile unit to engage people with opioid use disorder who inject drugs and increase use of MOUD and HIV prevention and treatment services in 5 cities (New York City; Houston, Texas; Los Angeles, California; Philadelphia, Pennsylvania; and Washington, DC).^22^ In this study, we examined the toxicologic detection of different types of illicit drugs overall and across the duration of HPTN 094 enrollment. We also examined variations in the prevalence of detected drugs by age, race and ethnicity, sex assignment at birth, geographic location, being unhoused, and history of incarceration. Based on local drug trends,^17,19^ we hypothesized a high prevalence of fentanyl and xylazine detection among participants in the eastern cities (Philadelphia, New York City, and Washington, DC) earlier than participants in the western cities (Houston and Los Angeles).
Methods
Study Participants
Inclusion and Exclusion Criteria
This cross-sectional study used data from HPTN 094. Participants who met eligibility criteria were invited to participate in a baseline interview and were enrolled between June 2021 and September 2023. All participants completed written informed consent prior to participating in study procedures, and a single institutional review board (Advarra) provided ethical approval for HPTN 094; this cross-sectional analysis was exempt from additional IRB approval. The current study was conducted and reported in accordance with the Strengthening the Reporting of Observational Studies in Epidemiology (STROBE) reporting guideline.^23^
Participants were required to meet the following criteria: (1) be at least 18 years of age, (2) have a urine test positive for recent opioid use and evidence of recent injection drug use (visible venipuncture marks), (3) meet diagnostic criteria for opioid use disorder, (4) be able to give informed consent, (5) be willing to start MOUD treatment, (6) complete an assessment of understanding, (7) have confirmed HIV seropositivity or self-reported sharing of injection equipment and/or condomless sex in the past 3 months with partners living with HIV or with unknown HIV status, and (8) provide locator information. Participants were excluded if they (1) self-reported being prescribed MOUD in the 30 days prior to screening, (2) had a urine test positive for methadone (with the exception of verified hospitalization), or (3) were enrolled in another study.
Recruitment Strategies
Prior to study launch, mobile unit study locations were identified using a data-informed, community-centered strategy.^22^ Using local administrative data, neighborhoods were selected based on high overdose rates, significant unhoused populations, and limited access to services for drug use treatment. Surveillance data and a web-based mapping tool allowed sites to analyze local HIV and opioid epidemics and map neighborhood boundaries to determine mobile clinic locations. Field staff visited known hot spots, including locations outside jails; community supervision programs; shelters; syringe exchange sites; detox centers; emergency departments; hospitals; and street-based areas such as tourist areas, parks, and strolling areas.^22^ Although only individuals meeting study eligibility were enrolled, mobile units routinely provided harm-reduction materials, naloxone, and service referrals to all community members regardless of eligibility. These outreach activities were critical to maintaining trust and community engagement.
Study Assessments
Research staff conducted the baseline interview and collected urine samples. Self-reported sociodemographic characteristics were captured on case report forms. Urine samples collected at enrollment were analyzed at the HPTN Laboratory Center (Johns Hopkins University, Baltimore, Maryland) using liquid chromatography–high resolution mass spectrometry (LC-HRMS) with MS2 library matching (Thermo Fisher Scientific) to assess the presence of methamphetamine or amphetamine, benzodiazepines, buprenorphine, cannabis, cocaine, fentanyl, methadone, opiates, synthetic opioids, and xylazine. Fentanyl was categorized separately from other opiates and synthetic opioids. The “opiate” category included morphine, codeine, and heroin metabolites, while “synthetic opioids” referred to nonfentanyl compounds such as tramadol, U-series analogs, and nitazenes.
Positive results using LC-HRMS testing were defined as any presence of drug detection above the cutoff or limit of detection (more details are provided in the eAppendix in Supplement 1). All results refer to toxicologic detection using LC-HRMS, which indicates exposure rather than self-reported or intentional use.
Statistical Analysis
Descriptive statistics were used to summarize the prevalence of drugs detected overall, by city, and by sociodemographic characteristic (age, sex at birth, race and ethnicity, current housing status, and incarceration within the past 6 months). Self-reported race and ethnicity categories were Hispanic or Latino, non-Hispanic Black/African American (hereafter, Black), non-Hispanic White (hereafter, White), and other non-Hispanic race (included American Indian or Alaska Native, Asian, Native Hawaiian or Other Pacific Islander, and multiracial). To compare drug use across demographic groups, binomial generalized linear models (GLMs), adjusted for study site, were used and risk differences were estimated. Participants missing housing status and participants reporting “other” as their race and ethnicity were not included in analyses of drug detection by those factors due to their small sample sizes. Pairwise comparisons were conducted for each drug type and demographic variable, with no multiple-testing adjustments. P values are intended to be descriptive and are presented alongside effect sizes (differences in drug-detection rates) and 95% CIs. Two-sided P < .05 was considered significant.
To evaluate trends in drugs detected, the enrollment period was subdivided into four 6-month periods (June 2021 to January 2022, February to August 2022, September 2022 to March 2023, and April to September 2023). Binomial GLMs estimating risk differences by city and by drug type were used to assess changes in drugs detected over time. For Philadelphia, the GLMs for fentanyl, xylazine, and polysubstance use over time did not converge due to near 100% prevalence across all enrollment periods for these drugs. In these 3 analyses, normal linear regression models of grouped proportions by enrollment period were used. All analyses were completed between August 2021 and August 2025 using SAS, version 9.0 (SAS Institute Inc).
Results
Baseline Sociodemographic Characteristics of Study Participants
Of 447 individuals invited to participate, 3 did not provide a baseline urine specimen, leaving 444 participants for this analysis overall. Across all participants, 141 (31.8%) were female and 303 (68.2%) were male. Of 440 participants with housing data, 203 (46.1%) were unhoused, and 91 of 442 participants with incarceration data (20.6%) had a recent incarceration history (Table 1). Enrollment by city was 94 in New York City (21.2%), 104 in Houston (23.4%), 93 in Los Angeles (20.9%), 112 in Philadelphia (25.2%), and 41 in Washington, DC (9.2%). Most participants were aged 30 to 49 years (267 [60.1%]), ranging from 15 (36.6%) within the Washington DC sample to 83 (74.1%) in the Philadelphia sample. Black individuals (n = 83) made up 18.7% of the participants, with particularly high representation in Washington, DC (33 of 41 participants [80.5%]). Hispanic or Latino individuals comprised one-third of the total enrolled study population (145 [32.7%]), 199 participants (44.8%) were White, and 17 (3.8%) were other non-Hispanic race.
Across all sites, approximately half of participants with housing data (203 of 440 [46.1%]) were unhoused at the time of enrollment, with higher rates in Philadelphia (76 of 112 [67.9%]) and New York City (56 of 94 [59.6%]). In contrast, Los Angeles had the lowest rate of homelessness, at 16 of 93 (17.2%). Recent incarceration was reported by 91 of 442 participants (20.6%) across all sites, with the highest rate in Houston (30 of 103 [29.1%]) and lowest in Philadelphia (18 of 112 [16.1%]). Nearly two-thirds of participants (280 [63.1%]) had ever taken MOUD, with 58 of 441 (13.2%) reporting being in a methadone treatment program within the past year and 436 of 443 (98.4%) reporting engaging with harm-reduction services in the year prior to enrollment (Table 1).
Prevalence of Drugs Detected
Table 2 shows the prevalence of drugs detected across the study sites. Fentanyl was the most prevalent drug detected among all participants (414 [93.2%]). Use rates of cocaine (328 participants [73.9%]), methamphetamine or amphetamine (299 [67.3%]), and synthetic opiates (272 [61.3%]) were also high. Xylazine was detected in over half of participants (234 [52.7%]), and polysubstance use was detected among nearly all participants (421 [94.8%]), highlighting the complexity of toxicologic detection among participants.
Notable differences in drug detection were observed by study site. Amphetamine-type stimulants were most prevalent in Los Angeles (87 of 93 [93.6%]) and Philadelphia (91 of 112 [81.3%]) but much lower in New York City (25 of 94 [26.6%]) and Washington, DC (12 of 41 [29.3%]). New York City (86 of 94 [91.5%]) and Philadelphia (105 of 112 [93.8%]) had the highest prevalence of cocaine detection, and Los Angeles (28 of 93 [30.1%]) had the lowest. Fentanyl detection was high across all cities, with the highest in Philadelphia (111 of 112 [99.1%]). Methadone detection was most prevalent in New York City (46 of 94 [48.9%]) and less common elsewhere (<30%). Xylazine was particularly prevalent in Philadelphia (111 of 112 [99.1%]), New York City (68 of 94 [72.3%]), and Washington, DC (31 of 41 [75.6%]), compared with low levels observed in Los Angeles (6 of 93 [6.5%]) and Houston (18 of 104 [17.3%]) (Table 2).
Drug Detection by Age and Sex
No differences were noted by sex (eTable 1 in Supplement 1). A lower prevalence of methamphetamine or amphetamine was detected among participants younger than 30 years (31 of 49 [63.3%]) vs those aged 30 to 49 years (197 of 267 [73.8%]); difference, 16.4% (95% CI, 4.6%-28.3%; P = .007) (Table 3). A lower prevalence of stimulants was also detected among participants aged 50 years or older (71 of 128 [55.5%]) compared with those aged 30 to 49 years (difference, −8.8%; 95% CI, −17.5% to −0.04%; P = .049). For participants younger than 30 years, cocaine was detected in 28 of the 49 samples tested (57.1%), which was lower than among those aged 30 to 49 years (206 of 267 [77.2%]; difference, 17.0%; 95% CI, 4.8%-29.1%; P = .006) and those aged 50 years or older (94 of 128 [73.4%]; difference, 17.1%; 95% CI, 4.0%-30.2%; P = .01). Xylazine was more prevalent among participants aged 30 to 49 years (151 of 267 [56.6%]) compared with those younger than 30 years (19 of 49 [38.8%]; difference, 14.5%; 95% CI, 3.0%-26.0%; P = .01) and those aged 50 years or older (64 of 128 [50.0%]; difference, 13.5%; 95% CI, 1.4%-25.6%; P = .03). Methadone prevalence was highest in the eldest age group and ranged from 6 of 49 (12.2%) in participants younger than 30 years to 43 of 128 (33.6%) among those aged 50 years or older (difference, 16.2%; 95% CI, 3.0%-29.3%; P = .02).
Polysubstance drugs were ubiquitous in all age groups, but use was most prevalent among those aged 30 to 49 years (260 of 267 [97.4%]) and least prevalent among participants younger than 30 years (43 of 49 [87.8%]; difference, 9.8%; 95% CI, 0.1%-19.5%; P = .047). In contrast, prevalence of benzodiazepines, buprenorphine, cannabis, fentanyl, opiates, and synthetic opioids was comparatively consistent across all age groups, with no notable differences (eTable 2 in Supplement 1).
Drug Detection by Race and Ethnicity
White participants had higher prevalence of benzodiazepines compared with Hispanic or Latino participants (difference, 7.5%; 95% CI, 1.6%-13.3%; P = .01). Conversely, White participants had lower prevalence of opiate detection compared with Hispanic or Latino participants (difference, −14.3%; 95% CI, −25.3% to −3.3%; P = .01). Compared with White participants, Black participants had a lower prevalence of buprenorphine detection (difference, −6.8%; 95% CI, −13.4% to −0.1%; P = .050) (eTable 3 in Supplement 1). There were no differences in drug detection by race and ethnicity for other drug categories (eTable 3 in Supplement 1). Participants of other non-Hispanic race were excluded from this analysis due to small sample size.
Drug Detection by Housing Status and Recent Incarceration
Drug detection by housing status and recent incarceration are shown in eTables 4 and 5 in Supplement 1. In brief, unhoused individuals had higher prevalence of cocaine detection compared with participants with housing (difference, 11.4%; 95% CI, 3.6%-19.2%; P = .004). Conversely, detection of benzodiazepines was lower among unhoused compared with housed individuals (difference, −5.7%; 95% CI, −10.9% to −0.5%; P = .03). Recently incarcerated individuals had a higher prevalence of amphetamine-type stimulant detection compared with those who had not been incarcerated (difference, 9.9%; 95% CI, 1.4%-18.5%; P = .02). We also observed lower prevalence of cannabis detection for those with no recent incarceration (difference, −7.8%; 95% CI, −10.6% to −5.0%; P < .01).
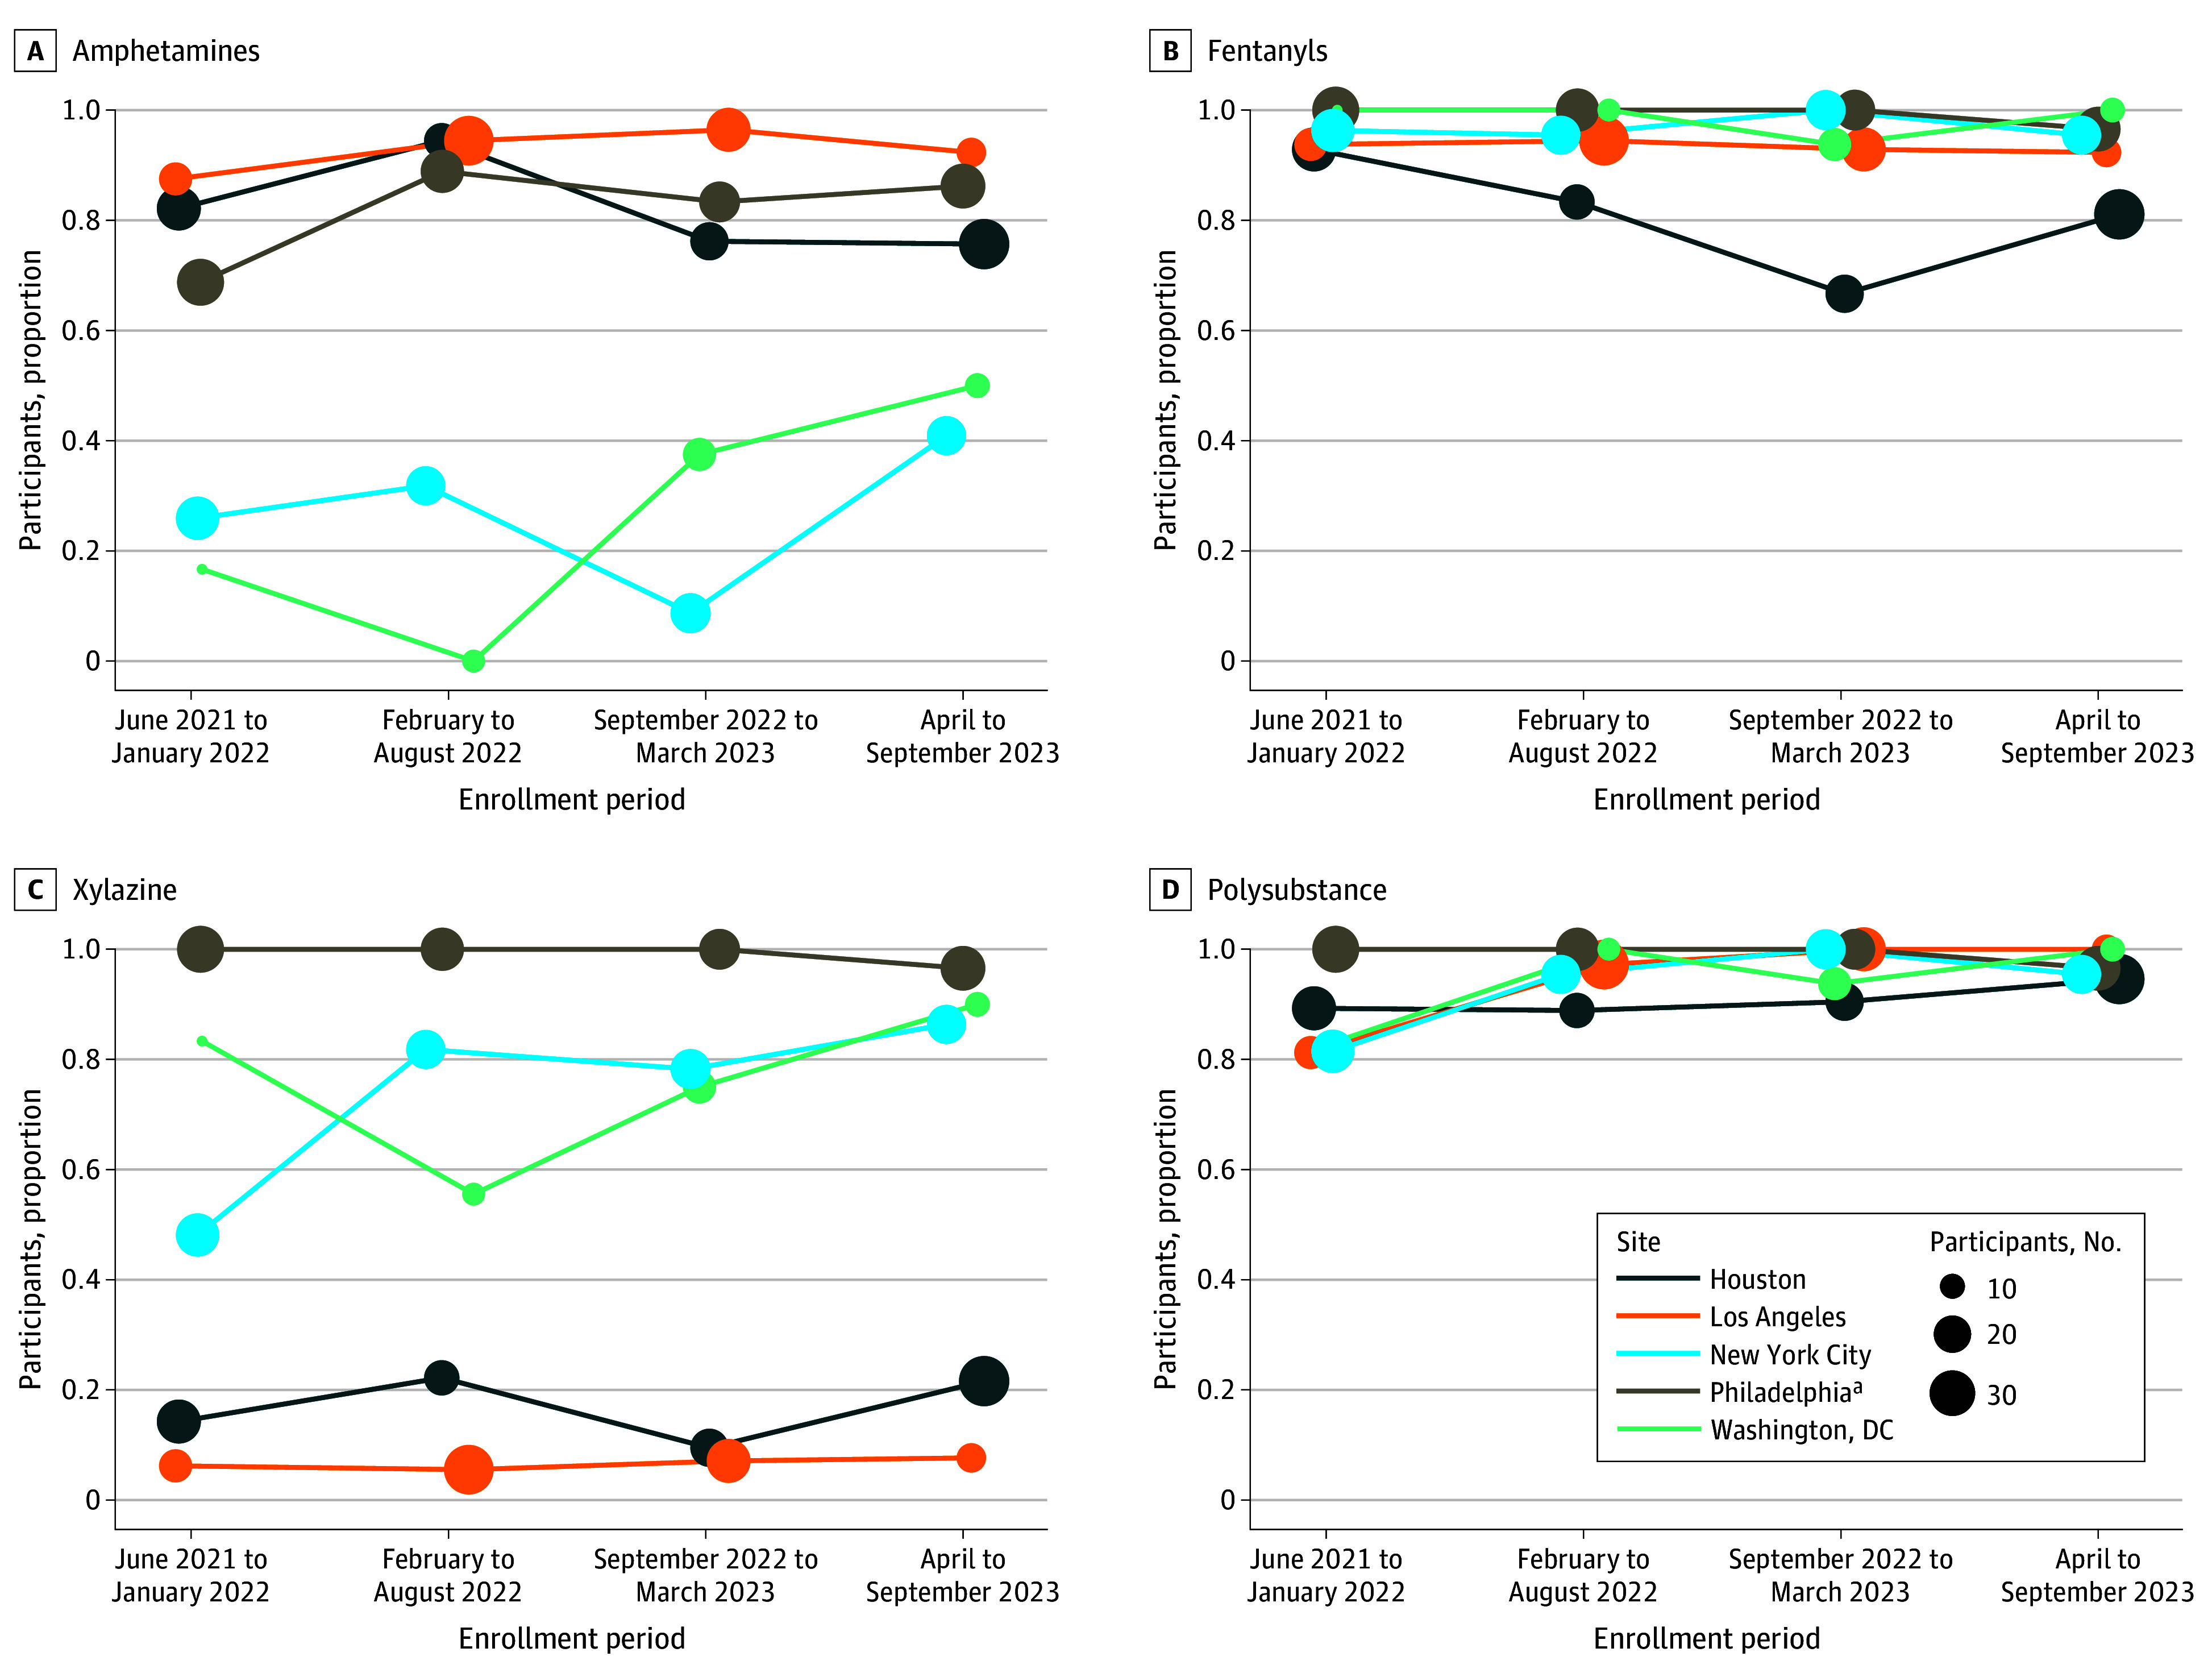
Trends in Drug Detection Over Time Across the 5 Cities
Table 4 and the Figure show trends in amphetamine-type stimulants, fentanyl, xylazine, and polysubstance detection across the 5 study cities. Table 4 shows a modeled average change per 6-month period across the entire enrollment window, whereas the Figure shows the raw 6-month period-specific prevalence. of amphetamine-type stimulants, fentanyl, xylazine, and polysubstance detection across the 5 study cities. Although the sample size for Washington, DC, was small (n = 41), stimulants showed the most notable change over time, with an increase every 6 months of 15.0% (95% CI, 2.9%-27.1%; P = .02). While other sites showed mild fluctuations in stimulant detection, none were statistically significant. Fentanyl detection remained persistently high across all sites, typically near or above 90%, with no changes over time.
Frequency Graphs of Amphetamine, Fentanyl, Xylazine, and Polysubstance Drug Detection Over Enrollment Periods and by SiteaPhiladelphia had nearly 100% fentanyl, xylazine, and polysubstance drug detection over the entire enrollment period. Change over time was estimated using period-specific proportions.
New York City showed an upward trend in xylazine detection, with an increase of 10.3% (95% CI, 4.0%-16.5%) every 6 months (P = .001). Other sites showed no meaningful shifts in xylazine detection, with Philadelphia participants having nearly 100% xylazine detection and Los Angeles and Houston having low detection across all enrollment periods. Polysubstance detection remained high across all sites throughout the enrollment period, with prevalence typically exceeding 90%. While no city showed statistically significant changes in the detection of polysubstance drugs over time, New York City and Los Angeles exhibited upward trends.
Discussion
This study offers a unique and timely contribution by mapping the toxicologic illicit drug detection across 5 diverse US cities participating in the HPTN 094 study. Despite regional differences in prevalence and types of drugs, fentanyl and polysubstance drug prevalence remained uniformly high, underscoring drug penetrance across urban US drug markets at the time of study enrollment. We also found increases in amphetamine-type stimulant detection in Washington, DC, xylazine in New York City, and polysubstance drugs in New York City and Los Angeles, highlighting important local shifts in drug trends that may inform targeted public health responses. We also note that the rise in polysubstance detection may be from adulteration within the unregulated supply rather than intentional co-use.
Using baseline data over time, a notable finding from this study was the apparent east-to-west diffusion of xylazine, which was initially concentrated in northeastern cities such as New York, Philadelphia, and Washington, DC, but showed signs of westward spread over time.^24^ The temporal rise in xylazine detection in these eastern cities, coupled with its lower baseline prevalence in western sites like Los Angeles and Houston, suggests that western regions may be in earlier phases of exposure. This geographic progression mirrors historical patterns seen with fentanyl and other synthetic drugs, where East Coast markets often serve as early indicators of broader national shifts.^17^ Such trends emphasize the importance of proactive drug surveillance systems capable of detecting and responding to emergent substances before they become entrenched in local drug supplies. The implications for public health and clinical response are important for locations that have not yet experienced high xylazine penetration and may still have a window of opportunity for targeted harm reduction, community education, and health care professional training on its unique toxicologic profile. More broadly, this east-to-west dynamic underscores the value of using geographically granular, time-sensitive data to forecast drug trends and prevent reactive policymaking.
Furthermore, our findings showed that xylazine positivity was commonly observed in participants aged 30 to 49 years, consistent with published reports indicating that xylazine use is more prevalent among younger individuals.^25^ The CDC and recent toxicology analyses have shown a growing prevalence of xylazine in overdose deaths among individuals aged in their 30s and 40s, particularly in regions heavily impacted by fentanyl-adulterated drug supplies.^24,26^ This demographic trend may reflect the intersection of younger age groups’ exposure to synthetic drug markets and polysubstance use patterns, suggesting an urgent need for targeted harm-reduction strategies that account for xylazine’s sedative effects and its combination with opioids in this population. The rise in amphetamine-type stimulant detection in Washington, DC, and xylazine in New York City aligns with national alerts and provides site-specific evidence useful for targeted interventions. Age-related differences in stimulant, methadone, and xylazine detection suggest distinct drug risk profiles.
When examining differences by housing status, unhoused individuals had higher prevalence of cocaine detection but lower benzodiazepine detection compared with housed individuals, possibly indicating patterns shaped by market access or preference. Ethnographic research also suggests that stimulant use among unhoused individuals may serve functional purposes such as maintaining alertness for safety in vulnerable environments, which aligns with our finding of higher cocaine detection among unhoused participants.^27^ People with recent history of incarceration had higher prevalence of stimulant detection but lower cannabis detection. These results call for regionally tailored harm-reduction strategies and drug supply monitoring systems that include real-time drug testing.^28^
The individuals reached in this study faced numerous challenges, including homelessness, lack of access to drug treatment and other health or social services, and a history of incarceration. The HPTN 094 qualitative findings revealed that participants represent a severely stigmatized population that is often excluded from drug treatment systems and other health care systems.^29,30^ Thus, the integrated approach within the mobile health unit used in the HPTN 094 study was critical for reaching this hard-to-reach key population.^30,31^
Strengths and Limitations
This study has several strengths. This study contributes participant-level, biomarker-verified drug detection data on people who inject drugs and are not engaged in medical care across 5 US cities, filling a gap left by population-based surveillance and drug-checking programs that rarely capture this subgroup.^32^ The study successfully reached a hard-to-reach population that is often disconnected from drug treatment services and health care and is underrepresented in research. We linked biomarker (LC-HRMS)–verified drug detection to sociodemographic and structural (housing status, incarceration) vulnerabilities, distinguishing it from aggregate drug-checking data.
This study also has limitations. First, although HPTN 094 was a randomized clinical trial targeting a very difficult-to-reach population of individuals who inject drugs and have opioid use disorders, random sampling was not feasible. Because all 5 sites were large urban centers and enrollment was restricted to people who inject drugs, findings may not reflect drug use patterns among rural populations or individuals who smoke or inhale drugs—the fastest-growing route of use nationally. As a result, the generalizability of our findings to the broader population of people who inject drugs is limited. Second, although HPTN 094 collected individual-level biomarker data over time, this analysis only used baseline biomarker data to assess what drugs were detected in the urine of people who inject drugs enrolled in HPTN 094 over calendar time. This analysis relied on a single-time-point toxicology assessment, which constrained our ability to determine causal relationships or observe changes in individual drug use patterns over time. Third, power for subgroup analyses was limited: some site-specific comparisons, such as those from Washington, DC (n = 41), may be underpowered due to small sample sizes, which limits the reliability and interpretability of those localized findings. Fourth, due to sample size constraints, we could not adequately adjust for potential confounders within each enrollment period to avoid unstable estimates and overfitting. The changes in drug detection over time should be interpreted as crude estimates, reflecting a combination of both compositional and temporal effects. Fifth, analyses presented did not account for possible correlations of individuals within communities. However, enrollments occurred across several locations within each study site, and estimated intraclass correlations were generally small. Sensitivity analyses were performed using logistic regression with exchangeable correlation within sites and yielded no significant changes to the analyses presented. Overall, our findings highlight variations in toxicologic detection by region and sociodemographic characteristics and changes in drug detection over time, which are important for informing tailored harm-reduction strategies.
Conclusions
This cross-sectional analysis of HPTN 094 data provided robust, geographically diverse data showing that fentanyl and polysubstance drugs continue to dominate the urban drug landscape. These findings offer a timely, comparative overview of individual-level illicit drug detection among non–medically engaged people who inject drugs and have opioid use disorders across 5 US cities, including a newly emerging illicit drug supply. The study’s multisite design was both novel and essential for understanding current injection drug trends in the US and implications for treatment services targeting this population. Despite national narratives emphasizing a shift toward drug inhalation, injection-related overdose deaths remain high, particularly due to rising use of dangerous combinations involving xylazine, stimulants, and polydrug use with fentanyl. These findings underscore an urgent need for real-time surveillance of the illicit drug supply to rapidly identify emerging threats. Furthermore, integrating harm-reduction and treatment approaches that address both substance use and underlying social determinants of health is essential to reduce overdose mortality, mitigate health disparities, and strengthen public health responses to evolving drug epidemics.
The reference list from the paper itself. Each links out to its DOI / PubMed record.
- 1Bradley H, Hall EW, Asher A, . Estimated number of people who inject drugs in the United States. Clin Infect Dis. 2023;76(1):96-102. doi:10.1093/cid/ciac 543 35791261 PMC 10202436 · doi ↗ · pubmed ↗
- 2Friedman J, Shover CL. Charting the fourth wave: geographic, temporal, race/ethnicity and demographic trends in polysubstance fentanyl overdose deaths in the United States, 2010-2021. Addiction. 2023;118(12):2477-2485. doi:10.1111/add.16318 37705148 · doi ↗ · pubmed ↗
- 3Garnett MF, Miniño AM. Drug overdose deaths in the United States, 2003-2023. National Center for Health Statistics data brief No. 522. December 2024. Accessed September 7, 2025. https://www.cdc.gov/nchs/products/databriefs/db 522.htm
- 4Berk J, South AM, Martin M, . Medication for opioid use disorder service delivery in carceral facilities: update and summary report. Health Justice. 2025;13(1):8. doi:10.1186/s 40352-025-00317-9 39891797 PMC 11786385 · doi ↗ · pubmed ↗
- 5Merrall EL, Kariminia A, Binswanger IA, . Meta-analysis of drug-related deaths soon after release from prison. Addiction. 2010;105(9):1545-1554. doi:10.1111/j.1360-0443.2010.02990.x 20579009 PMC 2955973 · doi ↗ · pubmed ↗
- 6Binswanger IA, Stern MF, Deyo RA, . Release from prison—a high risk of death for former inmates. N Engl J Med. 2007;356(2):157-165. doi:10.1056/NEJ Msa 064115 17215533 PMC 2836121 · doi ↗ · pubmed ↗
- 7Lee JD, Mc Donald R, Grossman E, . Opioid treatment at release from jail using extended-release naltrexone: a pilot proof-of-concept randomized effectiveness trial. Addiction. 2015;110(6):1008-1014. doi:10.1111/add.12894 25703440 · doi ↗ · pubmed ↗
- 8Ford JD, Trestman RL, Wiesbrock VH, Zhang W. Validation of a brief screening instrument for identifying psychiatric disorders among newly incarcerated adults. Psychiatr Serv. 2009;60(6):842-846. doi:10.1176/ps.2009.60.6.842 19487358 · doi ↗ · pubmed ↗