Life expectancy of people with intellectual disability: a retrospective cohort study from New South Wales, Australia
Preeyaporn Srasuebkul, Julian Trofimovs, Julian Trollor

TL;DR
People with intellectual disability in Australia live about 16 years less than the general population, with Down syndrome individuals living 54 years on average.
Contribution
This study provides the first comprehensive analysis of life expectancy for people with intellectual disability in Australia, including those with Down syndrome.
Findings
Life expectancy at birth for people with intellectual disability was 67 years, 16 years less than the NSW average.
Individuals with Down syndrome had a life expectancy of 54 years, significantly lower than those without Down syndrome.
The life expectancy gap for people with intellectual disability decreased as they aged.
Abstract
To comprehensively analyse the life expectancy at birth of people with intellectual disability, including people with Down syndrome, to inform health equity and service planning. Retrospective cohort study. Residents of New South Wales (NSW), Australia, with intellectual disability from birth onwards between 1 January 2001 and 31 December 2018. Our study sample comprised 100 089 individuals with intellectual disability in the dataset, spanning from birth onwards, between 1 January 2001 and 31 December 2018. All cause mortality. Life expectancy was estimated using ordinary and abridged life table methods, based on age-specific population count, and compared with the general NSW population. Life expectancy at birth of people with intellectual disability was 67 years, 16 years shorter than the NSW average. Males and females with intellectual disability had a similar life expectancy.…
Genes, proteins, chemicals, diseases, species, mutations and cell lines named across the full text — each resolved to its canonical identifier and authoritative record.
Click any figure to enlarge with its caption.
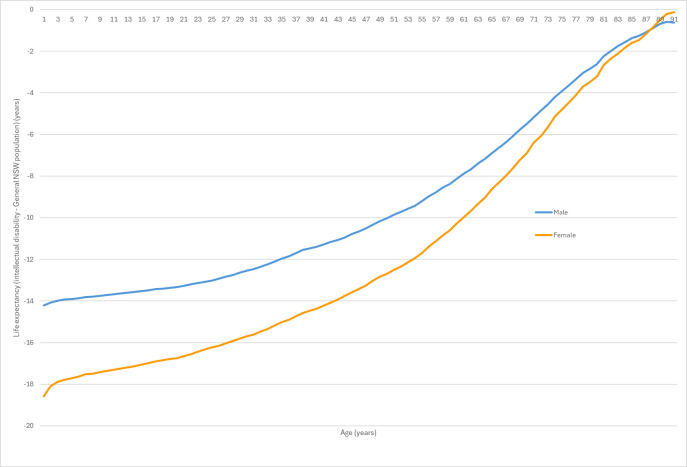 Figure 1
| Age | Number alive | Mortality rate | Number of person-years lived | Life expectancy |
|---|---|---|---|---|
| 0 | 100 000 | 0.00601 | 99 700 | 67.02669 |
| 1 | 99 401 | 0.00187 | 99 308 | 66.42740 |
| 2 | 99 215 | 0.00095 | 99 168 | 65.55109 |
| 3 | 99 121 | 0.00065 | 99 088 | 64.61318 |
| 4 | 99 056 | 0.00071 | 99 021 | 63.65494 |
| 5 | 98 985 | 0.00090 | 98 941 | 62.70007 |
| 6 | 98 896 | 0.00046 | 98 873 | 61.75626 |
| 7 | 98 850 | 0.00069 | 98 817 | 60.78444 |
| 8 | 98 783 | 0.00080 | 98 743 | 59.82584 |
| 9 | 98 704 | 0.00070 | 98 669 | 58.87321 |
| 10 | 98 635 | 0.00076 | 98 597 | 57.91407 |
| 11 | 98 559 | 0.00069 | 98 525 | 56.95794 |
| 12 | 98 491 | 0.00073 | 98 455 | 55.99707 |
| 13 | 98 419 | 0.00107 | 98 367 | 55.03768 |
| 14 | 98 314 | 0.00096 | 98 267 | 54.09579 |
| 15 | 98 220 | 0.00107 | 98 168 | 53.14729 |
| 16 | 98 115 | 0.00084 | 98 074 | 52.20339 |
| 17 | 98 033 | 0.00127 | 97 971 | 51.24693 |
| 18 | 97 908 | 0.00145 | 97 837 | 50.31147 |
| 19 | 97 766 | 0.00202 | 97 668 | 49.38390 |
| 20 | 97 569 | 0.00213 | 97 465 | 48.48251 |
| 21 | 97 362 | 0.00203 | 97 263 | 47.58498 |
| 22 | 97 164 | 0.00211 | 97 062 | 46.68056 |
| 23 | 96 960 | 0.00205 | 96 861 | 45.77794 |
| 24 | 96 761 | 0.00277 | 96 628 | 44.87085 |
| 25 | 96 494 | 0.00278 | 96 360 | 43.99380 |
| 26 | 96 226 | 0.00278 | 96 092 | 43.11496 |
| 27 | 95 959 | 0.00335 | 95 798 | 42.23354 |
| 28 | 95 638 | 0.00332 | 95 479 | 41.37356 |
| 29 | 95 321 | 0.00276 | 95 190 | 40.50949 |
| 30 | 95 059 | 0.00399 | 94 869 | 39.61990 |
| 31 | 94 680 | 0.00395 | 94 493 | 38.77646 |
| 32 | 94 306 | 0.00429 | 94 105 | 37.92796 |
| 33 | 93 903 | 0.00450 | 93 692 | 37.08875 |
| 34 | 93 481 | 0.00423 | 93 284 | 36.25393 |
| 35 | 93 087 | 0.00572 | 92 821 | 35.40541 |
| 36 | 92 556 | 0.00546 | 92 304 | 34.60548 |
| 37 | 92 052 | 0.00378 | 91 878 | 33.79235 |
| 38 | 91 704 | 0.00413 | 91 515 | 32.91845 |
| 39 | 91 326 | 0.00522 | 91 088 | 32.05269 |
| 40 | 90 850 | 0.00526 | 90 612 | 31.21799 |
| 41 | 90 374 | 0.00488 | 90 153 | 30.38006 |
| 42 | 89 934 | 0.00604 | 89 663 | 29.52617 |
| 43 | 89 392 | 0.00774 | 89 047 | 28.70203 |
| 44 | 88 703 | 0.00700 | 88 393 | 27.92127 |
| 45 | 88 084 | 0.00800 | 87 733 | 27.11378 |
| 46 | 87 382 | 0.00939 | 86 973 | 26.32761 |
| 47 | 86 566 | 0.00957 | 86 153 | 25.57115 |
| 48 | 85 742 | 0.00887 | 85 363 | 24.81219 |
| 49 | 84 985 | 0.01138 | 84 503 | 24.02877 |
| 50 | 84 023 | 0.00982 | 83 612 | 23.29800 |
| 51 | 83 202 | 0.01167 | 82 718 | 22.52300 |
| 52 | 82 237 | 0.01069 | 81 799 | 21.78152 |
| 53 | 81 363 | 0.01605 | 80 713 | 21.01020 |
| 54 | 80 067 | 0.01803 | 79 350 | 20.34203 |
| 55 | 78 637 | 0.01568 | 78 023 | 19.70300 |
| 56 | 77 413 | 0.01931 | 76 671 | 19.00650 |
| 57 | 75 933 | 0.01746 | 75 274 | 18.36743 |
| 58 | 74 618 | 0.02331 | 73 755 | 17.68214 |
| 59 | 72 899 | 0.02416 | 72 025 | 17.08749 |
| 60 | 71 158 | 0.02273 | 70 356 | 16.49323 |
| 61 | 69 559 | 0.02847 | 68 578 | 15.86097 |
| 62 | 67 607 | 0.02758 | 66 683 | 15.30471 |
| 63 | 65 767 | 0.03133 | 64 748 | 14.71880 |
| 64 | 63 739 | 0.03390 | 62 670 | 14.17143 |
| 65 | 61 614 | 0.03256 | 60 622 | 13.64295 |
| 66 | 59 640 | 0.04016 | 58 458 | 13.07807 |
| 67 | 57 292 | 0.04251 | 56 092 | 12.59366 |
| 68 | 54 908 | 0.04205 | 53 769 | 12.11895 |
| 69 | 52 647 | 0.04870 | 51 386 | 11.61811 |
| 70 | 50 145 | 0.05107 | 48 886 | 11.17311 |
| 71 | 47 648 | 0.05196 | 46 431 | 10.73256 |
| 72 | 45 235 | 0.06170 | 43 868 | 10.27854 |
| 73 | 42 529 | 0.05771 | 41 325 | 9.90122 |
| 74 | 40 144 | 0.06209 | 38 923 | 9.45999 |
| 75 | 37 727 | 0.06657 | 36 499 | 9.03425 |
| 76 | 35 298 | 0.07603 | 33 989 | 8.62208 |
| 77 | 32 714 | 0.06490 | 31 675 | 8.26415 |
| 78 | 30 658 | 0.07817 | 29 490 | 7.78514 |
| 79 | 28 353 | 0.10530 | 26 911 | 7.37799 |
| 80 | 25 519 | 0.09439 | 24 351 | 7.14276 |
| 81 | 23 220 | 0.09859 | 22 112 | 6.80109 |
| 82 | 21 040 | 0.10508 | 19 972 | 6.45483 |
| 83 | 18 941 | 0.11009 | 17 936 | 6.11560 |
| 84 | 16 967 | 0.11298 | 16 043 | 5.77022 |
| 85 | 15 154 | 0.13380 | 14 184 | 5.40169 |
| 86 | 13 256 | 0.15094 | 12 304 | 5.10505 |
| 87 | 11 399 | 0.16834 | 10 491 | 4.85741 |
| 88 | 9633 | 0.15839 | 8909 | 4.65887 |
| 89 | 8222 | 0.14760 | 7644 | 4.37487 |
| 90 | 7094 | 0.17273 | 6515 | 3.99312 |
| 91 | 5968 | 0.19048 | 5434 | 3.65443 |
| 92 | 4933 | 0.13077 | 4624 | 3.31964 |
| 93 | 4329 | 0.27778 | 3779 | 2.71508 |
| 94 | 3279 | 0.12346 | 3084 | 2.43174 |
| 95 | 2898 | 0.23077 | 2588 | 1.68692 |
| 96 | 2301 | 1 | 2301 | 1 |
| Female | Male | |||||||
|---|---|---|---|---|---|---|---|---|
| Number alive | Mortality rate | Number of person-years lived | Life expectancy | Number alive | Mortality rate | Number of person-years lived | Life expectancy | |
| 0 | 100 000 | 0.01080 | 99 459 | 66.81006 | 100 000 | 0.00418 | 99 791 | 66.94013 |
| 1 | 98 920 | 0.00328 | 98 757 | 66.53429 | 99 582 | 0.00135 | 99 514 | 66.21928 |
| 2 | 98 595 | 0.00159 | 98 517 | 65.75145 | 99 447 | 0.00071 | 99 412 | 65.30808 |
| 3 | 98 438 | 0.00142 | 98 368 | 64.85551 | 99 376 | 0.00036 | 99 358 | 64.35444 |
| 4 | 98 299 | 0.00127 | 98 236 | 63.94706 | 99 340 | 0.00050 | 99 315 | 63.37764 |
| 5 | 98 173 | 0.00208 | 98 071 | 63.02790 | 99 290 | 0.00046 | 99 267 | 62.40937 |
| 6 | 97 969 | 0.00039 | 97 950 | 62.15833 | 99 245 | 0.00049 | 99 220 | 61.43768 |
| 7 | 97 931 | 0.00118 | 97 874 | 61.18214 | 99 196 | 0.00050 | 99 171 | 60.46740 |
| 8 | 97 816 | 0.00115 | 97 760 | 60.25367 | 99 147 | 0.00066 | 99 114 | 59.49731 |
| 9 | 97 703 | 0.00097 | 97 656 | 59.32269 | 99 081 | 0.00059 | 99 052 | 58.53625 |
| 10 | 97 609 | 0.00103 | 97 558 | 58.37968 | 99 022 | 0.00066 | 98 990 | 57.57075 |
| 11 | 97 508 | 0.00110 | 97 454 | 57.43950 | 98 958 | 0.00052 | 98 932 | 56.60820 |
| 12 | 97 400 | 0.00112 | 97 345 | 56.50244 | 98 906 | 0.00057 | 98 877 | 55.63767 |
| 13 | 97 291 | 0.00155 | 97 215 | 55.56549 | 98 849 | 0.00086 | 98 807 | 54.66903 |
| 14 | 97 140 | 0.00154 | 97 065 | 54.65078 | 98 764 | 0.00071 | 98 729 | 53.71580 |
| 15 | 96 990 | 0.00155 | 96 915 | 53.73434 | 98 694 | 0.00085 | 98 652 | 52.75376 |
| 16 | 96 840 | 0.00140 | 96 772 | 52.81696 | 98 609 | 0.00059 | 98 580 | 51.79845 |
| 17 | 96 704 | 0.00156 | 96 629 | 51.89050 | 98 551 | 0.00114 | 98 495 | 50.82880 |
| 18 | 96 554 | 0.00107 | 96 502 | 50.97073 | 98 439 | 0.00163 | 98 358 | 49.88616 |
| 19 | 96 451 | 0.00192 | 96 358 | 50.02461 | 98 278 | 0.00206 | 98 177 | 48.96703 |
| 20 | 96 266 | 0.00241 | 96 150 | 49.11973 | 98 075 | 0.00199 | 97 978 | 48.06710 |
| 21 | 96 034 | 0.00258 | 95 910 | 48.23703 | 97 880 | 0.00173 | 97 795 | 47.16195 |
| 22 | 95 786 | 0.00273 | 95 656 | 47.36038 | 97 711 | 0.00176 | 97 625 | 46.24297 |
| 23 | 95 525 | 0.00246 | 95 407 | 46.48868 | 97 539 | 0.00181 | 97 451 | 45.32341 |
| 24 | 95 290 | 0.00214 | 95 188 | 45.60199 | 97 363 | 0.00314 | 97 210 | 44.40471 |
| 25 | 95 086 | 0.00278 | 94 954 | 44.69882 | 97 057 | 0.00278 | 96 922 | 43.54279 |
| 26 | 94 822 | 0.00298 | 94 680 | 43.82200 | 96 788 | 0.00264 | 96 660 | 42.66266 |
| 27 | 94 539 | 0.00302 | 94 396 | 42.95153 | 96 532 | 0.00356 | 96 360 | 41.77429 |
| 28 | 94 253 | 0.00329 | 94 098 | 42.08022 | 96 189 | 0.00333 | 96 028 | 40.92172 |
| 29 | 93 943 | 0.00233 | 93 833 | 41.21766 | 95 868 | 0.00305 | 95 722 | 40.05671 |
| 30 | 93 724 | 0.00400 | 93 536 | 40.31287 | 95 576 | 0.00398 | 95 386 | 39.17754 |
| 31 | 93 349 | 0.00330 | 93 195 | 39.47270 | 95 196 | 0.00440 | 94 987 | 38.33197 |
| 32 | 93 041 | 0.00520 | 92 799 | 38.60181 | 94 777 | 0.00360 | 94 607 | 37.49934 |
| 33 | 92 557 | 0.00448 | 92 349 | 37.80098 | 94 436 | 0.00450 | 94 223 | 36.63286 |
| 34 | 92 142 | 0.00386 | 91 964 | 36.96886 | 94 011 | 0.00449 | 93 800 | 35.79634 |
| 35 | 91 786 | 0.00554 | 91 532 | 36.11018 | 93 589 | 0.00582 | 93 316 | 34.95551 |
| 36 | 91 278 | 0.00509 | 91 046 | 35.30847 | 93 044 | 0.00572 | 92 778 | 34.15726 |
| 37 | 90 813 | 0.00408 | 90 628 | 34.48665 | 92 512 | 0.00354 | 92 348 | 33.35098 |
| 38 | 90 443 | 0.00372 | 90 275 | 33.62579 | 92 184 | 0.00443 | 91 980 | 32.46774 |
| 39 | 90 107 | 0.00541 | 89 862 | 32.74951 | 91 775 | 0.00505 | 91 543 | 31.61009 |
| 40 | 89 619 | 0.00524 | 89 384 | 31.92509 | 91 312 | 0.00526 | 91 071 | 30.76812 |
| 41 | 89 149 | 0.00640 | 88 864 | 31.09055 | 90 831 | 0.00367 | 90 665 | 29.92808 |
| 42 | 88 579 | 0.00681 | 88 277 | 30.28750 | 90 498 | 0.00541 | 90 253 | 29.03650 |
| 43 | 87 976 | 0.00698 | 87 669 | 29.49168 | 90 008 | 0.00829 | 89 634 | 28.19185 |
| 44 | 87 362 | 0.00703 | 87 054 | 28.69544 | 89 262 | 0.00692 | 88 953 | 27.42335 |
| 45 | 86 748 | 0.00761 | 86 417 | 27.89513 | 88 644 | 0.00826 | 88 277 | 26.61106 |
| 46 | 86 087 | 0.01034 | 85 641 | 27.10534 | 87 912 | 0.00853 | 87 537 | 25.82842 |
| 47 | 85 197 | 0.00916 | 84 806 | 26.38334 | 87 162 | 0.00982 | 86 733 | 25.04638 |
| 48 | 84 417 | 0.00732 | 84 108 | 25.62251 | 86 306 | 0.01007 | 85 871 | 24.28985 |
| 49 | 83 799 | 0.01064 | 83 352 | 24.80777 | 85 437 | 0.01187 | 84 929 | 23.53181 |
| 50 | 82 907 | 0.00842 | 82 558 | 24.06918 | 84 423 | 0.01088 | 83 963 | 22.80838 |
| 51 | 82 210 | 0.01168 | 81 729 | 23.26923 | 83 505 | 0.01154 | 83 022 | 22.05373 |
| 52 | 81 249 | 0.01199 | 80 761 | 22.53831 | 82 541 | 0.00951 | 82 148 | 21.30534 |
| 53 | 80 275 | 0.01498 | 79 672 | 21.80585 | 81 756 | 0.01669 | 81 072 | 20.50511 |
| 54 | 79 072 | 0.01829 | 78 347 | 21.12998 | 80 392 | 0.01752 | 79 686 | 19.84470 |
| 55 | 77 626 | 0.01720 | 76 957 | 20.51427 | 78 984 | 0.01418 | 78 422 | 19.18960 |
| 56 | 76 291 | 0.01770 | 75 613 | 19.86467 | 77 864 | 0.02033 | 77 070 | 18.45847 |
| 57 | 74 940 | 0.01700 | 74 301 | 19.21368 | 76 281 | 0.01757 | 75 609 | 17.83113 |
| 58 | 73 666 | 0.02323 | 72 807 | 18.53725 | 74 941 | 0.02289 | 74 080 | 17.14113 |
| 59 | 71 955 | 0.02268 | 71 136 | 17.96634 | 73 225 | 0.02489 | 72 310 | 16.53095 |
| 60 | 70 323 | 0.02302 | 69 510 | 17.37170 | 71 403 | 0.02201 | 70 614 | 15.94022 |
| 61 | 68 704 | 0.02671 | 67 783 | 16.76931 | 69 831 | 0.02923 | 68 806 | 15.28775 |
| 62 | 66 869 | 0.02574 | 66 005 | 16.21578 | 67 790 | 0.02844 | 66 821 | 14.73313 |
| 63 | 65 148 | 0.03379 | 64 041 | 15.63107 | 65 862 | 0.02838 | 64 923 | 14.14987 |
| 64 | 62 947 | 0.02986 | 62 002 | 15.16029 | 63 993 | 0.03619 | 62 828 | 13.54857 |
| 65 | 61 067 | 0.03029 | 60 138 | 14.61159 | 61 677 | 0.03350 | 60 638 | 13.03861 |
| 66 | 59 218 | 0.03578 | 58 152 | 14.05244 | 59 611 | 0.04233 | 58 340 | 12.47333 |
| 67 | 57 099 | 0.03917 | 55 973 | 13.55547 | 57 088 | 0.04364 | 55 833 | 12.00271 |
| 68 | 54 862 | 0.03813 | 53 809 | 13.08788 | 54 596 | 0.04374 | 53 393 | 11.52781 |
| 69 | 52 770 | 0.05177 | 51 392 | 12.58695 | 52 208 | 0.04390 | 51 054 | 11.03237 |
| 70 | 50 039 | 0.03988 | 49 034 | 12.24705 | 49 917 | 0.05813 | 48 451 | 10.51609 |
| 71 | 48 043 | 0.05078 | 46 813 | 11.73513 | 47 015 | 0.05050 | 45 817 | 10.13459 |
| 72 | 45 603 | 0.06178 | 44 180 | 11.33646 | 44 641 | 0.05810 | 43 331 | 9.64725 |
| 73 | 42 786 | 0.04837 | 41 743 | 11.05031 | 42 047 | 0.06286 | 40 711 | 9.21175 |
| 74 | 40 716 | 0.05296 | 39 629 | 10.58679 | 39 404 | 0.06656 | 38 077 | 8.79649 |
| 75 | 38 560 | 0.05661 | 37 458 | 10.15106 | 36 781 | 0.07136 | 35 453 | 8.38850 |
| 76 | 36 378 | 0.06863 | 35 114 | 9.73045 | 34 156 | 0.07735 | 32 818 | 7.99520 |
| 77 | 33 881 | 0.05043 | 33 019 | 9.41102 | 31 514 | 0.07448 | 30 326 | 7.62415 |
| 78 | 32 172 | 0.05991 | 31 199 | 8.88451 | 29 167 | 0.08965 | 27 839 | 7.19794 |
| 79 | 30 245 | 0.09684 | 28 756 | 8.41918 | 26 552 | 0.10322 | 25 157 | 6.85829 |
| 80 | 27 316 | 0.07453 | 26 285 | 8.26918 | 23 812 | 0.10644 | 22 521 | 6.59117 |
| 81 | 25 280 | 0.07283 | 24 348 | 7.89536 | 21 277 | 0.11727 | 20 004 | 6.31789 |
| 82 | 23 439 | 0.08531 | 22 424 | 7.47673 | 18 782 | 0.11666 | 17 664 | 6.09214 |
| 83 | 21 440 | 0.08729 | 20 490 | 7.12814 | 16 591 | 0.12535 | 15 528 | 5.83208 |
| 84 | 19 568 | 0.08076 | 18 767 | 6.76275 | 14 511 | 0.14164 | 13 457 | 5.59782 |
| 85 | 17 988 | 0.11392 | 16 943 | 6.31360 | 12 456 | 0.14173 | 11 551 | 5.44110 |
| 86 | 15 939 | 0.12503 | 14 920 | 6.06230 | 10 690 | 0.16337 | 9791 | 5.25916 |
| 87 | 13 946 | 0.13964 | 12 948 | 5.85870 | 8944 | 0.17911 | 8117 | 5.19141 |
| 88 | 11 998 | 0.13801 | 11 150 | 5.73048 | 7342 | 0.16054 | 6735 | 5.21863 |
| 89 | 10 343 | 0.11287 | 9747 | 5.56992 | 6163 | 0.17495 | 5607 | 5.12384 |
| 90 | 9175 | 1 | 47 860 | 5.21622 | 5085 | 1 | 25 973 | 5.10769 |
| Age | Without Down syndrome | With Down syndrome | ||||||
|---|---|---|---|---|---|---|---|---|
| Number alive | Mortality rate | Number of person-years lived | Life expectancy | Number alive | Mortality rate | Number of person-years lived | Life expectancy | |
| 0 | 100 000 | 0.00479 | 99 760 | 66.30850 | 100 000 | 0.03713 | 98 132 | 54.55145 |
| 1 | 99 521 | 0.00359 | 397 367 | 65.62552 | 96 287 | 0.01784 | 381 701 | 55.63616 |
| 5 | 99 163 | 0.00348 | 494 954 | 61.85476 | 94 569 | 0.00553 | 471 538 | 52.61034 |
| 10 | 98 818 | 0.00403 | 493 095 | 57.06191 | 94 047 | 0.00921 | 468 065 | 47.88879 |
| 15 | 98 420 | 0.00640 | 490 523 | 52.28282 | 93 181 | 0.00755 | 464 143 | 43.31060 |
| 20 | 97 790 | 0.01080 | 486 306 | 47.60350 | 92 477 | 0.01376 | 459 198 | 38.62102 |
| 25 | 96 734 | 0.01463 | 480 124 | 43.09594 | 91 205 | 0.01839 | 451 818 | 34.12505 |
| 30 | 95 319 | 0.02045 | 471 705 | 38.69868 | 89 527 | 0.02486 | 442 050 | 29.71774 |
| 35 | 93 370 | 0.02328 | 461 393 | 34.45454 | 87 302 | 0.03484 | 428 860 | 25.41188 |
| 40 | 91 196 | 0.02916 | 449 299 | 30.21646 | 84 260 | 0.04597 | 411 541 | 21.23947 |
| 45 | 88 537 | 0.04396 | 432 880 | 26.04933 | 80 386 | 0.06999 | 387 696 | 17.14345 |
| 50 | 84 644 | 0.05531 | 411 407 | 22.13309 | 74 760 | 0.15639 | 343 742 | 13.24779 |
| 55 | 79 963 | 0.08099 | 383 397 | 18.28392 | 63 068 | 0.25658 | 272 889 | 10.25341 |
| 60 | 73 487 | 0.11584 | 345 717 | 14.67796 | 46 886 | 0.38486 | 185 679 | 7.97197 |
| 65 | 64 975 | 0.16690 | 296 938 | 11.28013 | 28 841 | 0.52431 | 101 763 | 6.52172 |
| 70 | 54 130 | 0.23912 | 236 820 | 8.05434 | 13 719 | 0.47387 | 50 616 | 6.29269 |
| 75 | 41 187 | 0.31820 | 171 083 | 4.83566 | 7218 | 0.28888 | 30 583 | 4.94798 |
| 80 | 28 081 | 1 | 28 081 | 1 | 5133 | 1 | 5133 | 1 |
- —Addressing Health Inequality Experienced by People with Intellectual Disability
- —National Health and Medical Research Council Australia
Peer Reviews
No public reviews on file for this paper yet. If you reviewed it on a platform where reviews are public (OpenReview, ICLR, NeurIPS, ICML), you can paste yours below so the community can read it here.
Videos
No videos yet. Explain this paper in a talk, walkthrough, or lecture? Add one.
Taxonomy
TopicsDown syndrome and intellectual disability research · Disability Rights and Representation · Healthcare innovation and challenges
Introduction
Intellectual disability is a neurodevelopmental condition affecting 1–3% of the global population, characterised by significant limitations in intellectual functioning and adaptive behaviour before age 18.1 2 Individuals with intellectual disability experience markedly poorer health outcomes, including higher rates of chronic physical and mental health conditions and unmet healthcare needs driven by biological vulnerability, multimorbidity, socioeconomic disadvantage and systemic barriers to equitable healthcare.35 Although life expectancy has improved due to medical advances and community-based care, adults with intellectual disability still live approximately 12 years fewer than the general population.68
Mortality research in this population has traditionally relied on median or average age at death, summary measures that obscure age-specific mortality risks and fail to inform targeted interventions or resource planning. Life expectancy, which is derived from life table methodology, provides a more nuanced understanding of survival patterns across the life course. It enables age-specific analysis, identification of critical periods for intervention and calculation of years of life lost, insights that median or average age at death measures cannot offer.9
Recent findings have documented systemic neglect in healthcare provision for people with intellectual disability, evidenced by premature and preventable deaths, inadequate access to quality healthcare and persistent structural barriers within health systems. These investigations have highlighted the urgent need for robust monitoring mechanisms, with life tables serving as essential to enhance accountability and systematically track progress in addressing these profound health inequities.10
The impact of these barriers is exemplified by health outcomes among people with Down syndrome, the most common genetic cause of intellectual disability, who face increased risks of congenital heart defects, early-onset dementia and autoimmune conditions.11 While life expectancy has risen dramatically from 25 years in 1983 to nearly 60 years recently, substantial disparities persist compared with both the general population and people with intellectual disability without Down syndrome.7 12 13 Racial and ethnic minorities experience less pronounced survival improvements, and condition-specific risks continue to drive elevated mortality rates.14 15
While life table methods have been used internationally to estimate life expectancy in this population, no comprehensive analysis exists using Australian data. This study addresses this gap using linked administrative datasets from New South Wales (NSW) to estimate life expectancy for people with intellectual disability, including those with and without Down syndrome. This represents the first life table analysis of its kind in Australia, providing robust, policy-relevant estimates and highlighting the persistent disparities in the Australian context.1619
Methods
Data sources and cohort definition
We sourced data from a linked population-based data asset. This asset contains health and service records of people with intellectual disability and matched comparators without intellectual disability in NSW, Australia.20 The linked data set comprised 20 individual administrative data sets from health, disability and other services. Nine of these datasets were available for cohort identification at the time of the study: Disability Service Minimum Dataset (DSMDS); Admitted Patient Data Collection; Mental Health Ambulatory Data; Emergency Department Data Collection; NSW Department of Education (students who received targeted specialist support in public schools; Statewide Disability Services, Corrective Services NSW; NSW Public Guardian and NSW Ombudsman. These nine datasets contained specific diagnosis codes or service provision flags necessary to identify individuals with intellectual disability.
An individual was included in our study cohort if they were identified through at least one of the following pathways: (1) appearing in a disability service dataset with intellectual disability recorded as their primary or secondary disability and (2) appearing in a health administrative dataset with a recorded diagnosis of intellectual disability.
For this study, ‘appearing in a disability service dataset’ (eg, DSMDS) was defined as accessing one or more state-funded supports such as supported accommodation, community participation or respite care.
The remaining 11 datasets (eg, the NSW Registry of Births, Deaths and Marriages (RBDM) or Cancer Registry) were not used to identify individuals with intellectual disability as they do not contain these specific identifiers. Instead, these datasets were used to ascertain outcomes (ie, mortality or cancer incidence) and establish covariates. Specifically, date of death information from the NSW RBDM and the National Death Index (NDI) datasets was used to determine the end of follow-up.
Our study sample comprised 100 089 individuals with intellectual disability in the dataset, spanning from birth onwards, between 1 January 2001 and 31 December 2018. We excluded individuals who had died before 1 January 2001 and those born after 31 December 2018. The sample was stratified by sex and Down syndrome status. We identified a subpopulation of individuals with Down syndrome using diagnostic codes from the linked datasets (International Classification of Diseases (ICD)-9 code 758.0, ICD-10 code Q90 or ICD-10-AM code U88.2) or any flag of Down syndrome from disability service datasets.
Individuals entered the study cohort on 1 January 2001 or their date of birth, whichever occurred later. Follow-up for each individual continued from this entry date until their date of death (ascertained via linkage to the NSW RBDM and the NDI) or the end of the study period (31 December 2018), whichever occurred first. As our outcome (mortality) was ascertained through comprehensive registry linkage, there was no loss to follow-up.
Regarding missing data, variables essential for life table construction (date of birth, sex and date of death) were requisite for inclusion and were virtually complete. For the Down syndrome stratification, individuals were classified based on specific diagnostic codes or service flags; those without such a record were categorised as ‘intellectual disability without Down syndrome’.
Life expectancy estimation
Life expectancy refers to the predicted average number of additional years an individual is expected to live, given current age-specific and sex-specific mortality rates. We estimated life expectancy at birth for individuals with intellectual disability. These estimates were stratified by sex and Down syndrome status.
We constructed complete period life tables for our study cohort, using 1-year age intervals, for all individuals. This involves calculating the probability of dying within each age interval from the observed age-specific death rates within our cohort. From these probabilities, we then determined the number of survivors at each age and the total person-years lived.
These cohort-specific estimates were then compared with the general NSW population using standard life table methods based on publicly available data from the Australian Bureau of Statistics.21
Where small cell sizes necessitated aggregation, we generated abridged life tables for grouped age ranges (eg, 5-year intervals). For these abridged tables, we used standard actuarial techniques to estimate mortality probabilities from the grouped age data.22 23 Abridged life tables typically produce slightly lower life expectancy estimates due to methodological differences in age grouping and interpolation methods.
Finally, we derived life expectancy at birth and remaining life expectancy at selected ages (eg, 20, 40, 60) directly from these calculations. Given that the latest birth year included in our cohort was 2018, life expectancy at birth derived from these period life tables can be interpreted as the life expectancy for individuals with intellectual disability who were born in 2018, assuming they were subject to the mortality rates observed during the study period for their entire lives. We calculated 95% CIs for life expectancy at birth using the parametric bootstrap method, assuming a Poisson distribution of deaths in each group with 1000 replications.
To visually represent the disparities and trends in life expectancy across the lifespan, we generated figures illustrating the difference in remaining life expectancy. The plot shows the life expectancy of individuals with intellectual disability minus that of the general NSW population across different ages, stratified by sex. All analyses were performed using Stata V.18.0 (StataCorp, College Station, TX, USA).
Results
Detailed cohort characteristics have been reported previously.20 Briefly, the study included 100 089 individuals with intellectual disability, of whom 34% were female, and a median age at cohort entry of 3 years (IQR, 0–19). Down syndrome was present in 4% of the cohort, and 8911 deaths occurred during the study period.
Based on our life table (table 1), the life expectancy at birth for individuals with intellectual disability born in 2018 was 67.03 years (95% CI 60.0 to 73.6 years). This represents a substantial disparity compared with the 83.3 years of life expectancy at birth in the general NSW population born between 2018 and 2020.24
For females with intellectual disability born in 2018, life expectancy at birth was 66.81 years (95% CI 57.1 to 76.3 years), compared with 85.3 years for the general NSW female population.25 This represented a stark reduction of 18.49 years for females with intellectual disability at birth. Remaining life expectancy was 49.12 years at age 20 and 17.32 years at age 60 (table 2).
Males with intellectual disability born in 2018 had a life expectancy at birth of 66.94 years (95% CI 56.7 to 77.0 years), 14.26 years shorter than their peers in the general NSW male population. The life expectancy at birth for males in the general NSW population (2018–2020) was 81.2 years. Their remaining life expectancy was 49.18 years at age 20, and 16.54 years for those aged 60 (table 2).
Across all age cohorts, males and females with intellectual disability showed very similar life expectancies at birth, with females having a slightly lower life expectancy at birth. However, both sexes experienced significantly lower life expectancy at birth compared with their respective sex in the general NSW population.
While a substantial gap in life expectancy exists at birth compared with the general NSW population, this disparity tends to diminish with age for both sexes. For example, at age 65 years, the remaining life expectancy for females with intellectual disability was 14.61 years. When compared with females in the general NSW population at the same age, whose remaining life expectancy was typically 22.91 years, the initial broad gap seen at birth was reduced to 8.30 years. Similarly, for males with intellectual disability, remaining life expectancy at age 65 years was 13.04 years. Compared with males in the general NSW population at the same age, whose remaining life expectancy was typically 20.27 years, this initial gap was reduced to 6.62 years. This trend is further illustrated in figure 1, which plots the difference in life expectancy between individuals with intellectual disability and the general NSW population across the age spectrum, highlighting the reduction in disparity at older ages, stratified by sex.
Life expectancy deficit for individuals with intellectual disability (compared with the general NSW population). NSW, New South Wales.
Table 3 presents abridged life tables for individuals with intellectual disability stratified by Down syndrome status. For individuals with intellectual disability but without Down syndrome born in 2018, life expectancy at birth was 66.31 years (95% CI 45.4 to 91.0 years). Their remaining life expectancy was 47.60 years at age 20 and 11.28 years at age 65.
Individuals with intellectual disability and Down syndrome born in 2018 had a considerably lower life expectancy at birth of 54.55 years (95% CI 34.6 to 75.1 years). Their remaining life expectancy was 38.62 years at age 20. This represents an 11.76-year reduction in life expectancy at birth for individuals with Down syndrome compared with those with intellectual disability without Down syndrome.
DISCUSSION
This study provides contemporary and robust estimates of life expectancy for individuals with intellectual disability in NSW, Australia. We found a substantial 16-year reduction in life expectancy at birth (67 years) compared with the general NSW population, with particularly pronounced disparities for individuals with Down syndrome (54.55 years). While males and females with intellectual disability had similar life expectancy, the disparity with the general population was greater for females.26 The life expectancy gap diminished with age across all subgroups.
Our findings align with international literature from high-income countries reporting a 13–20 year reduction in life expectancy for people with intellectual disability. Studies from the UK, the USA and Canada have documented similar disparities, with some reporting gaps for up to 19.7 years at birth.14 27 This consistency across different healthcare systems and countries suggests our NSW findings may be generalisable to similar high-income settings with universal healthcare. The particularly stark reduction for Down syndrome reflects well-documented health vulnerabilities associated with this condition globally.12 Despite improvements over recent decades, significant disparities persist.28 29
The observed life expectancy for people with intellectual disability in NSW was comparable to the general population’s life expectancy in many low-income and middle-income countries, despite Australia’s universal healthcare system.30 This reflects systemic challenges in accessing appropriate healthcare and has been described as ‘systemic neglect’.4 31 Contributing factors include higher rates of avoidable deaths from treatable conditions, with respiratory and circulatory diseases being the leading causes of premature mortality.43235
These findings underscore the urgent need for comprehensive implementation of the National Roadmap for Improving the Health of People with Intellectual Disability, as well as the health-related recommendations from the Disability Royal Commission.36 For clinicians, the data highlight the need for enhanced training, proactive health surveillance and person-centred care models addressing the complex needs of individuals with intellectual disability across their lifespan. Social determinants of health also play a role, indicating the need for a multifaceted approach addressing both healthcare access and broader social factors.10
The convergence of life expectancy differences at older ages suggests that excess mortality is concentrated in earlier life, indicating opportunities for targeted interventions during critical periods. However, findings should be interpreted cautiously given the limitations of administrative data and our descriptive approach. While we cannot establish causal mechanisms, the magnitude and consistency of disparities across age groups suggest systematic factors beyond individual health conditions contribute to excess mortality, requiring comprehensive health system responses addressing both medical care and social determinants of health.
Limitations
This study has several notable strengths. We used a large population-based linked administrative dataset from NSW, Australia’s most populous state representing approximately one-third of the national population, providing robust and contemporary estimates. The application of formal life table methodology ensured transparency and direct comparable estimates. Our approach enabled detailed stratification by sex and Down syndrome status, yielding population-specific life expectancy estimates crucial for health planning and policy development.
However, a primary limitation is our reliance on administrative data for cohort formation. We acknowledge that our sample is an administrative cohort and not a complete population sample, as it does not capture the entire population of people with intellectual disability in NSW. This methodology likely underestimates the intellectual disability population, as individuals not accessing services, and those with intellectual disability who are not identified as such are excluded. The direction of this bias is uncertain: excluded individuals may have died before accessing services (leading to overestimated life expectancy) or may have mortality rates similar to the general population if their disability level does not require specialised services (leading to underestimated life expectancy disparities). The proportion of the intellectual disability population captured by administrative data is unknown, making it difficult to assess the magnitude and direction of potential bias.
Despite this limitation in generalisability, the use of life tables remains the gold standard and most statistically robust method for calculating and presenting age-specific mortality rates and life expectancy for any defined longitudinal cohort. A core objective of this study was to comprehensively analyse life expectancy for people with intellectual disability to inform health equity and service planning. This objective required the generation of robust, cohort-specific estimates, as applying general population tables would be inappropriate and misrepresent the true mortality burden for this population.
Our descriptive approach cannot establish causality or directly adjust for confounding factors such as socioeconomic status, comorbidities and healthcare access. The direction of residual confounding is unclear—while people with intellectual disability face socioeconomic disadvantages and increased mortality risk, they may receive enhanced healthcare monitoring that could be protective.
Geographic limitation to NSW limits external validity, as findings may not generalise to other Australian states with different population demographics or service models. Variations in disability services, healthcare access and socioeconomic contexts across countries further limit international generalisability. Period life tables reflect 2014–2018 mortality patterns rather than true cohort survival, and our general population comparison uses aggregate rather than individually matched data.
Conclusion
This study demonstrates significant life expectancy disparities for individuals with intellectual disability in NSW, with a 16-year reduction at birth and additional 12-year reduction for Down syndrome. These findings underscore persistent health inequities in a high-income country with universal healthcare and emphasise the urgent need for targeted interventions and healthcare system reforms to ensure equitable access to quality care throughout the lifespan.
The reference list from the paper itself. Each links out to its DOI / PubMed record.
- 1Schalock RL Borthwick-Duffy SA Bradley VJ et al Intellectual Disability: Definition, Classification, and Systems of Supports 11thedn Washington (DC)American Association on Intellectual and Developmental Disabilities 2010 Availablehttps://eric.ed.gov/?id=ED 509596
- 2Maulik PK Mascarenhas MN Mathers CD et al Prevalence of intellectual disability: a meta-analysis of population-based studies Res Dev Disabil 2011324193610.1016/j.ridd.2010.12.01821236634 · doi ↗ · pubmed ↗
- 3Hosking FJ Carey IM Shah SM et al Mortality Among Adults With Intellectual Disability in England: Comparisons With the General Population Am J Public Health 201610614839010.2105/AJPH.2016.30324027310347 PMC 4940652 · doi ↗ · pubmed ↗
- 4Trollor J Srasuebkul P Xu H et al Cause of death and potentially avoidable deaths in Australian adults with intellectual disability using retrospective linked data BMJ Open 20177 e 01348910.1136/bmjopen-2016-013489 PMC 530652528179413 · doi ↗ · pubmed ↗
- 5Emerson E Hatton C Socioeconomic disadvantage, social participation and networks and the self-rated health of English men and women with mild and moderate intellectual disabilities: cross sectional survey Eur J Public Health 20081831710.1093/eurpub/ckm 04117488752 · doi ↗ · pubmed ↗
- 6Landes SD Stevens JD Turk MA Cause of death in adults with intellectual disability in the United States J Intellect Disabil Res 202165475910.1111/jir.1279033043518 PMC 7710575 · doi ↗ · pubmed ↗
- 7Bittles AH Glasson EJ Clinical, social, and ethical implications of changing life expectancy in Down syndrome Dev Med Child Neurol 200446282610.1017/s 001216220400044115077706 · doi ↗ · pubmed ↗
- 8Lauer E Mc Callion P Mortality of People with Intellectual and Developmental Disabilities from Select US State Disability Service Systems and Medical Claims Data J Appl Res Intellect Disabil 20152839440510.1111/jar.1219125994364 · doi ↗ · pubmed ↗