Genetic monitoring of an endangered arable weed reveals local maintenance of genetic variation in times of land use and climate change
Ellen Gradl, Yoshiko Shimono, Daniela M. Listl, Lena Winkler, Christoph Reisch

TL;DR
This study tracks genetic diversity in an endangered weed over 13 years, finding that genetic variation is maintained despite population loss, likely due to long seed longevity.
Contribution
The study demonstrates that genetic diversity in arable weeds can be preserved over time despite population declines, challenging expectations.
Findings
Genetic diversity and differentiation remained nearly stable between 2007 and 2020 despite 25% population extinction.
Seed longevity in the soil likely maintains genetic variation by enabling population regeneration.
Effective population sizes showed some differences between study years depending on analysis methods.
Abstract
Genetic monitoring is a powerful tool to reveal human impact on genetic diversity and genetic differentiation in times of land use and climate change. Unfortunately, it is not yet frequently applied in wild plant nature conservation at present. Consequently, we conducted a genetic monitoring study of the rare and endangered arable weed Sherardia arvensis, which continuously decreased in the recent decades due to environmental changes. Therefore, detecting a possible shift in genetic diversity and differentiation is highly relevant for conservation. We applied multiplexed ISSR genotyping by sequencing (MIG-seq) to compare genetic variation within and among eight populations, as well as effective population size of the species using samples collected at the same sites in 2007 and 2020. We obtained 371 SNPs from 160 analysed individuals. In contrast to our expectations, we observed nearly…
Genes, proteins, chemicals, diseases, species, mutations and cell lines named across the full text — each resolved to its canonical identifier and authoritative record.
Click any figure to enlarge with its caption.
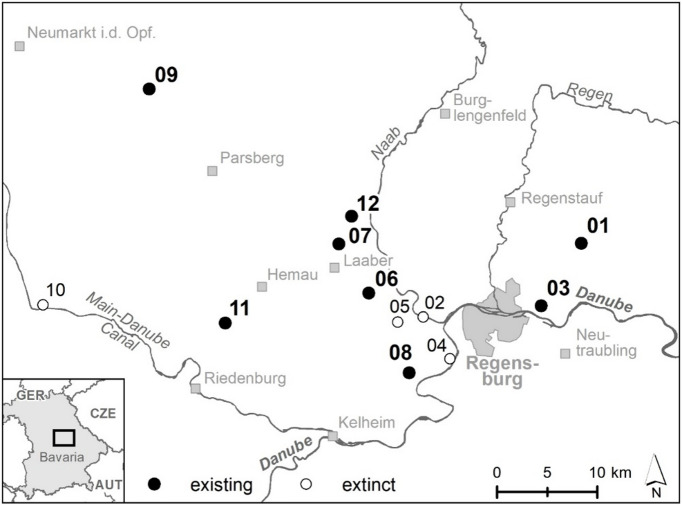 Figure 1
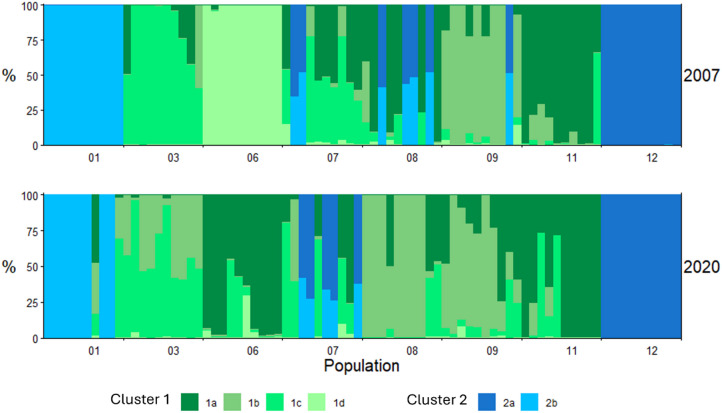 Figure 2
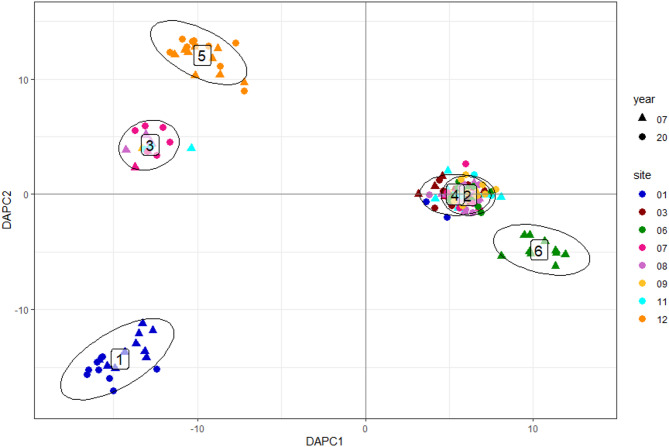 Figure 3
- —Universität Regensburg (3161)
Peer Reviews
No public reviews on file for this paper yet. If you reviewed it on a platform where reviews are public (OpenReview, ICLR, NeurIPS, ICML), you can paste yours below so the community can read it here.
Videos
No videos yet. Explain this paper in a talk, walkthrough, or lecture? Add one.
Taxonomy
TopicsGenetic diversity and population structure · Weed Control and Herbicide Applications · Biological Control of Invasive Species
Introduction
In the Anthropocene global biodiversity declined drastically due to human impact^1^. Indeed, a dramatic loss of diversity at the ecosystem, species and genetic level in recent decades has been observed and reported in a multitude of different scientific studies^2–5^. Among many others, habitat destruction, land use changes and climate change are the most important reasons for the loss of biological diversity^1^. These processes can cause an extinction vortex^6^, which strongly contributes to species loss. In this case, the progressively decreasing size of a species’ population, first leads to a loss of genetic diversity and increased genetic differentiation, followed by decreasing individual fitness and finally to population extinction. When this process continues, remnant populations become increasingly isolated and suffer from genetic drift and inbreeding, which in turn further increases the likelihood of extinction events^7^. Once started on this downwards spiral, possibilities to reverse the trend are limited. Consequently, for many declining and strongly endangered species, decreasing levels of genetic diversity within populations and increasing levels of differentiation between populations can be postulated nowadays. However genetic diversity is widely recognized as the basis for adaptation and is of high conservation concern. Next to classical genetic diversity and differentiation measures based on genetic markers like expected and observed heterozygosity, the effective population size has been identified as an important parameter by the Convention on Biological Diversity (CBD) in 2022^14–16^. It is particularly useful as a metric to monitor within population genetic diversity as it shows effects of genetic drift, inbreeding and adaptive potential^16,17^.
In this context monitoring, “the systemic and focused observation and measurement of present changes in biodiversity”^8^ is an impressive and effective approach to uncover human impact on the development of biodiversity at all levels^9–11^. At the ecosystem and the species level, monitoring is a well-established and regularly used nature conservation tool. Based upon historical and present maps or aerial photos, the loss and gain of specific ecosystems over time can be analysed^12^. Similarly, historical and present species lists, or vegetation surveys can be used to analyse the occurrence and distribution of species over time at the local, regional or even global level^2^. Genetic diversity and differentiation as an essential part of biodiversity has, however, been largely neglected in biodiversity monitoring up till now^13^.
So far, the genetic monitoring of plant species has mostly focused on crop species^18–20^ or on the effects of ex situ conservation and reintroduction on genetic variation^21–25^. However, genetic monitoring studies, comparing populations of rare and endangered plant species at different times in the field to uncover the temporal development of genetic diversity and differentiation have been conducted less frequently^26^. This can be traced back to several reasons. First, molecular and standardized methods to analyse genetic diversity and differentiation at a broader scale have only become available by and by in recent decades. Second, high quality DNA material, which can be used for genetic monitoring, is often not available. On the one hand, DNA from herbarium specimen is often degraded, in particular when vouchers are old, and cannot easily be used for genetic analyses. Moreover, the number of replications is often too limited for monitoring genetic diversity and differentiation at the population level. On the other hand, collections of DNA solutions are rare and often not old or large enough to study changes in genetic diversity and differentiation over time. Consequently, genetic monitoring studies of rare and endangered plant species are urgently required in conservation^27–29^ and highly significant to analyse changes of genetic diversity and differentiation in a conservation context.
Arable weeds, plant species growing in cultivated fields alongside the crop species, belong to the most endangered plant species in Central Europe^30–34^and are, therefore, highly interesting for genetic monitoring studies. In the modern agricultural landscape, arable weeds strongly declined especially due to land use intensification and other changes^35,36^. More efficient seed cleaning, increased application of fertilizers and herbicides, deeper depth of tillage and the loss of field margin areas due to increased arable field size during land consolidation processes caused an exhaustive decline of arable weed populations all over Central Europe^31,32^.
Our study species, the blue field madder (Sherardia arvensis), is an originally quite common arable weed. However, due to agricultural intensification in recent decades the species has become rare and is now included in the German and Bavarian Red List^33,34^. The genetic diversity and differentiation of S. arvensis has already been analysed in a previous study using AFLP markers, which revealed a stronger isolation by distance, i.e. higher genetic differentiation with increasing geographical distance, of these arable weed populations in Central Europe compared to the Mediterranean, where many weeds originate from^35^.
For the study presented here, we resampled plant material of S. arvensis in 2020 at the study sites in arable field margins, where plant material had already been collected in 2007 for the study of Listl and Reisch^35^. We then applied multiplexed ISSR (inter simple sequence repeats) genotyping-by-sequencing (MIG-seq) to analyse samples from both years and checked for potential changes of genetic diversity and differentiation between 2007 and 2020. Considering the above-mentioned loss of individuals and populations in recent decades, we focused on the following questions: (i) has there been a significant loss of genetic diversity within populations since 2007? (ii) Has the effective population size (N_e_) changed between 2007 and 2020? And finally, (iii) has the level of genetic differentiation among populations increased within this 13-year period?
Materials and methods
Study species
Our study species Sherardia arvensis L., commonly known as blue field madder, is an annual herbaceous plant species of the Rubiaceae family. The pink to purplish flowers bloom from June to October^40^, while pollination frequently occurs by selfing^41^. S. arvensis seeds survive in the soil seed bank up to 10 years^42^.
The species is often considered as an archaeophyte, which was introduced to Central Europe during the Roman Empire at the latest^43^. Due to human agriculture, it is distributed globally. In temperate continental climates it originally occurs in arable fields^39^. However, because of land use changes and agricultural intensification many populations disappeared in the last decades, or they are now restricted to arable field margins. The species is, therefore, included as “near threatened” in the German and Bavarian Red List^37,38^. The collection of the plant material, therefore, did not require permission from local authorities. However, we adhered to relevant institutional and national guidelines to ensure the least possible harm to the studied plant populations.
Study sites and sampling procedure
Based upon the data from a previous study of Listl and Reisch^39^, we selected 12 populations of S. arvensis at study sites near Regensburg in southeastern Germany for our investigation (Table 1; Fig. 1), where the species occurred at arable field margins. We revisited all the sites in 2020 to resample S. arvensis. However, only at eight study sites S. arvensis still occurred. Comparable to the sampling procedure in 2007, at each study site leaf material from ten individuals was collected in 2020, placed in paper filter bags and stored over silica gel to dry at room temperature until DNA extraction in the lab. The plant specimens were identified by two of the current authors in the two sampling years, in 2007 by Daniela Listl and in 2020 by Ellen Gradl respectively. No voucher specimen was collected.
Table 1. Studied sites and populations with population ID (Pop ID), location name, status (+: existing, -: extinct) and their geographic location.Pop IDLocation nameStatusLa. (N)Lo. (E)01Wenzenbach+49°04’51”12°13’15”02Etterzhausen-49°01’15”12°00’04”03Tegernheim+49°01’35”12°09’46”04Sinzing-48°58’57”12°02’08”05Nittendorf-49°01’01”11°57’58”06Pollenried+49°02’38”11°55’42”07Laaber+49°05’20”11°53’24”08Bergmatting+48°58’17”11°58’45”09Velburg+49°14’01”11°38’20”10Beilngries-49°02’38”11°29’01”11Aichkirchen+49°01’19”11°43’52”12Heitzenhofen+49°06’48”11°54’33”
Fig. 1. Geographic location of the study sites sampled in 2007 and 2020 around the city of Regensburg (federal state of Bavaria, Germany). Study sites are indicated by black dots. The numbers refer to Listl and Reisch 2014. Sites where Sherardia arvensis could not be resampled in 2020, since the populations went extinct, were labelled with white dots.
MIG-seq analysis and SNP detection
From the dried plant material collected in 2020, DNA was extracted using the CTAB protocol by Rogers and Bendich^44^, modified by^45^. DNA extracts of the individuals sampled in 2007 had previously been extracted with the same method and had been stored since then at -20 °C in the Regensburg DNA bank. DNA extracts from 2007 to 2020 were diluted with water to a standardized concentration of 15 ng/µL and stored at -20 °C until further analysis. Standardized DNA concentrations are not a requirement for the MIG-seq analysis; however, we would argue that homogenization across samples will lead to more equal numbers of reads per individual and thus more reliable results from the sequencing step.
To analyse the genetic diversity and differentiation of all samples, we conducted multiplexed ISSR (inter simple sequence repeats) genotyping-by-sequencing (MIG-seq) following the protocol by Suyama and Matsuki^42^, which provides genome-wide SNP information. This method is a simple, fast and more cost-efficient approach to obtaining SNPs for ecological questions and non-model species than comparable NGS methods. It has been successfully applied to a variety of study organisms, from corals, snails to different plant species^46–49^ In short, the MIG-seq library was constructed using two PCR steps and fragments between 300 and 800 bp were isolated for sequencing on an Illumina MiSeq Sequencer (Illumina, San Diego, CA, USA) using a MiSeq Reagent Kit v3 (150 cycles, Illumina) as described by Suyama and Matsuki^50^. The raw data was analysed using Trimmomatic, FastQC and Stacks. From the obtained NGS data the primer regions were removed with Trimmomatic v.0.36^51^ and the quality check was done with FastQC v.0.11.5 (https://www.bioinformatics.babraham.ac.uk/projects/fastqc/). We then analysed the cleaned data with Stacks v.2.66^52^, using the pipeline for de novo SNP discovery which includes the programs ustacks,* cstacks*,* sstacks*,* tsv2bam* and gstacks. We set the minimum depth coverage at m = 3 and the maximum distance at M = 2. SNPs were called using the populations module in Stacks. To avoid linkages between SNPs we used the write-single-snp option, we specified the minimum minor allele frequency (min-maf = 0.05), the minimum number of populations which contained retained loci (p = 1), maximum observed heterozygosity required to process a locus (max-obs-het = 0.8) and retained only those loci that were present in at least 50% of individuals (min-samples-overall = 0.5). For comparison we also analysed the dataset with min-maf = 0.01 and min-samples-overall = 0.6, 0.7 and 0.8 and obtained similar results with regards to the genetic structure. Therefore, only the results with min-maf = 0.05 and min-samples-overall = 0.5 will be presented here.
Statistical analysis
From the analysis in stacks using the SNPs, we obtained the mean observed (H_O_) and expected heterozygosity (H_E_) and fixation index within a population (F_IS_) for each population using the populations module.
We used Wilcoxon signed rank tests from the rstatix package in R^53^, to check whether study sites differ significantly between 2007 and 2020 in genetic diversity. Furthermore, we analysed genetic differentiation within and among populations, as well as between sampling years using GenAlEx 6.5^54^.
Bayesian cluster analyses were carried out using STRUCTURE^55^ with a burnin and MCMC repetition of 100,000 and 1,000,000 respectively, testing for K = 1–16 with 20 repetitions of each K. We obtained the most likely number of K using the method described by Evanno et al.^56^ with the online tool Structure Selector^57^ and R-package pophelper^58^. In a second step we ran the structure analysis again on subsets of individuals (Supplementary information 1). The subsets consisted of individuals with more than 50% membership to a primary cluster. To complement the structure analysis, we performed a Discriminant analysis of principal components (DAPC) with the adegenet-package^59^. In the first step, in which clusters were detected, we retained all PC axes and choose K when the decrease of BIC reached a plateau (Supplementary information 2). In the second step, that implemented the DAPC, we only retained the first 50 PC axes and retained all discriminant functions.
Additionally, we calculated the effective population size (N_e_) using the software NeEstimator v.2.1^60^. We calculated single-sample contemporary N_e_ using the method based on linkage disequilibrium^61–63^, as well as temporal sample estimates based on Jorde and Ryman’s^64^ estimator as implemented in the software assuming random mating, using 0.05 as the lowest allele frequency threshold and using jackknife-based confidence intervals, similar to the analyses done by Lévêque et al.^65^.
Results
In total 160 samples were successfully analysed using MIG-seq. After quality filtering, trimming and SNP calling, a total of 371 variable loci were obtained. Mean observed (H_O_) and expected heterozygosity (H_E_) and fixation indices (F_IS_) were nearly identical (Table 2) in 2007 and 2020 (H_O 2007_: 0.17, H_O 2020_: 0.16; H_E 2007_: 0.19, H_E 2020_: 0.20, F_IS 2007_: 0.11, F_IS 2020_: 0.16). Consequently, genetic diversity did not differ significantly between 2007 and 2020 using Wilcoxon tests.
Table 2. Genetic variation of the populations of Sherardia arvensis at the selected study sites in 2007 and 2020. Given are the population ID (Pop ID), the number of samples included in the analysis N, observed heterozygosity H_O_, expected heterozygosity H_E_ and the fixation index F_IS_. We observed no significant differences between 2007 and 2020 using Wilcoxon tests.Pop ID n H_O_H_E_F_IS_20071100.150.160.063100.160.20.166100.170.12-0.077100.160.240.268100.170.230.219100.170.20.1511100.170.220.1912100.160.12-0.05 Mean 2007 0.170.190.1120201100.170.210.183100.180.20.126100.160.210.197100.160.250.38100.150.180.149100.160.210.2111100.160.220.2112100.160.13-0.04 Mean 2020 0.160.20.16P Wilcoxon test 0.64
0.31
0.25
In a three level AMOVA (Table 3) including both data from 2007 to 2020 we observed 1% of the total variation between 2007 and 2020, 18% among the populations and 81% within populations. In separate two level AMOVAs (Table 3) genetic differentiation among populations was only slightly stronger in 2007 (Φ_PT_ = 0.19) than in 2020 (Φ_PT_ = 0.18).
Table 3. Molecular variance within and among populations of Sherardia arvensis from the study sites in 2007 and 2020 calculated in different analyses of molecular variance (AMOVA). SS indicates the sum of squares, MS the mean squares, % the proportion of genetic variability. Levels of significance are based on 999 iteration steps.Level of variationdfSSMS%Φ_ΠΤ_ p In 2007 and 2020Among years11110.281110.2810.180.001Among populations within years1412788.6913.4718Within populations14440515.8281.3681In 2007Among populations76693.9956.27190.190.001Within populations7220856.2289.6781In 2020Among populations76094.65870.66180.180.001Within populations7219659.6273.0582
In the Bayesian cluster analysis (Fig. 2) individuals and populations formed most likely two main groups (ΔK = 5125.60) for both years. Following the investigation of the lower hierarchy cluster, the first cluster was most likely subdivided into four subclusters, while cluster two was divided into two subclusters (see Supplementary information 1 & 2). These results are further supported by the DAPC analysis (Fig. 3), which shows a similar distribution of samples into the six clusters. Most populations were assigned to the same or similar clusters for both investigated years, while some populations changed more considerably. For example, population 06 was mainly assigned to cluster 1d in 2007 and in 2020 was most likely assigned to cluster 1a, making it more similar to population 11. Similar change patterns were observed for populations 07 and 08. Other populations like population 01, 03, 09, 11 and 12 were more stable between the years.
Fig. 2. Results of the Bayesian cluster analysis with Structure (based upon SNPs from the MIG-seq analysis) over all sampled individuals simultaneously. Populations from both years of Sherardia arvensis were assigned to two main groups (cluster 1 in green and cluster 2 in blue), each of which is sub-structured into several subgroups (1a-1d and 2a and 2b respectively), each bar represents one individual.
Fig. 3. Result of the Discriminant analysis of principal components (DAPC), showing the data structure for six clusters. Samples from 2007 are indicated with a triangle, while samples from 2020 are shown with a dot. The symbols are coloured according to their origin site. Cluster 2 and 4 are overlapping, while clusters 1, 3, 5 and 6 are clearly separated.
The estimation of effective population size (Tables 4 and 5) showed different results for the single sample analysis and the temporal method. Single sample estimates changed between the different years, most populations showed a reduction in N_e_, while some showed an increase in N_e_ estimates (population 07 and 09), while population 12 was estimated at infinite for both study years (Table 4). The temporal method showed infinite estimates for most populations, only population 7 (N_e_: 34.03) and population 11 (N_e_: 47.9) showed distinct values, which were however larger than the sample size and the number of individuals present during sampling (personal observation) (Table 5).
Table 4. Effective population size estimates for single sample contemporary N_e_ using the method based on linkage disequilibrium (LD) for each single population. Values for the 95% confidence intervals based on a jackknife procedure are represented in square brackets.LD method95% CISample sizeN_e_200711035.8[7.5; ∞]31056.1[1.4; ∞]610∞[∞; ∞]71015.5[2.7; ∞]81041.5[3.1; ∞]91015.2[2.5; ∞]111011[2.1; ∞]1210∞[∞; ∞]20201105.4[1.6; ∞]3109.1[1.4; ∞]61011.4[2.4; ∞]710∞[12.1; ∞]8102.8[1.1; ∞]910113.9[3.1; ∞]11102.4[0.9; ∞]1210∞[∞; ∞]
Table 5. Effective population size estimates for Temporal sample estimates using Jorde & Ryman’s^64^ estimator for each population pair. Values for the 95% confidence intervals based on a jackknife procedure are represented in square brackets.Temporal methodN_e_95% CISample size120∞[∞; ∞]320∞[∞; ∞]620∞[∞; ∞]72034.03[26.3;48.1]820∞[∞; ∞]920∞[∞; ∞]112047.9[34.2;80.3]1220∞[∞; ∞]
Discussion
Loss of populations
For the genetic monitoring study presented here, we revisited 12 study sites, where S. arvensis had been sampled in 2007. However, populations of S. arvensis still occurred at only 75% of the sites. Our investigation illustrates, therefore, the continuous decline of arable weed populations, which has been previously observed for many species in Central Europe^32,33^.
In the case of S. arvensis agricultural land use change may be a key reason for the observed population decline. Fields where S. arvensis went seemingly extinct, are meanwhile used for the cultivation of maize instead of cereals. Since arable weeds are light-demanding species and compete with crop plants for light as the main resource^66^ the shadier environmental conditions at maize field margins may have caused the population loss.
Another reason for the population decline may be the changing climate conditions in central Europe. Previous studies showed that many rare arable weed species require low germination temperatures^67^. Furthermore, populations seem to be specifically adapted in seed germination to temperature conditions at their growing sites^68^. Moreover, vegetation strongly suffered from droughts in the recent decade^69^. It has been demonstrated that especially the germination response of rare arable weeds is sensitive to reduced water availability^70^. The increased temperatures and lack of water during the recent decade may, therefore, have contributed further to the observed loss of S. arvensis populations.
Trends in genetic diversity and differentiation patterns
The level of genetic diversity was within the range to be expected for short lived, selfing plant species, which is generally lower than in longer lived and outbreeding plant species^71,72^. The investigation of effective population size showed declining numbers for some of the populations in the single-sample estimates, while others increased. The temporal approached showed infinite or larger values than the census size, similar to Lévêque et al.^65^, who also found different values depending on the method used to estimate N_e_. Unfortunately, most single sample estimates, if not infinite, were below the currently recommended threshold of N_e_ of 50, which is often considered to be the baseline to preserve genetic diversity in wild populations^16,17,27^. However, estimates of Ne are also expected to be lower in species of conservation concern, than in non-threatened species^17^.
In contrast to our expectations, the genetic monitoring we conducted here revealed similar levels of genetic diversity and differentiation within and among the studied populations in 2007 and 2020. At first glance, this seems to be inconsistent when considering the ongoing loss of populations and the preceding decline of population size in arable weeds in general, which should be associated closely with significant changes in the genetic structure, especially in the form of reduced genetic diversity, increasing effects of inbreeding and increasing genetic differentiation.
There is, however, one important reason for the observed more or less stable pattern of genetic diversity and differentiation, which is the longevity of S. arvensis seeds in the soil seed bank. Arable weed species often have long-living seeds as revealed by a previous study on arable weeds, where 50% of the analysed species persisted more than 20 years in the soil seed bank. In the same study a soil seed bank longevity of up to 10 years has been reported for S. arvensis^42^. The availability of seeds in the soil, may thus buffer populations against extinction and the loss of genetic variation^73–76^. Previous studies in other plant species revealed similar levels of genetic diversity and differentiation in the present vegetation and the soil seed bank. The soil seed bank may thus be considered as a source of hidden diversity and part of the effective population size^76,77^ and thus a buffer against loss of genetic diversity^76^, which could have contributed significantly to the current preservation of genetic diversity and differentiation levels in S. arvensis as well as counteracting possible effects of inbreeding, also under conditions of ongoing population decline and increasing isolation.
Our study hence supports the assumption that the reaction of plant populations to decreasing population size and increasing isolation may be delayed, which is often postulated when patterns of genetic diversity and differentiation do not match present patterns of fragmentation^78^. Recent studies already demonstrated that actually existing levels of genetic diversity and differentiation within and among populations of specific species often reflect historical patterns of distribution^78,79^ comparable to an extinction debt at the species level^80,81^. Obviously, longer periods of time are needed to analyse temporal changes of genetic diversity and differentiation. The results of our study show that, at present, S. arvensis is more strongly endangered due to the ongoing loss of populations than to a loss of genetic diversity and increase of genetic differentiation and inbreeding. However, the decrease in effective population size in many of the studied populations in the single sample estimates might be an indication, that the buffering capability of the soil seed bank is declining. Similarly, the infinite values obtained in the temporal approach could be a product of the relatively small sample size and actually represent an overestimation of available genetic diversity in the populations^16,17^. But, some populations also increased in their estimates of effective population size between the two study years. It is possible that this may be caused by current or historic gene flow among populations, which are geographically close and might be part of a larger metapopulation, which could explain the shifts in genetic diversity and differentiation found in this study. Historic and present land-use has been repeatedly found to influence current genetic variation patterns in grassland habitats^79,82,83^ and might thus also be of concern in arable weed populations, which experience similar human impacts.
Our investigation, therefore, clearly underlines the need for long-term genetic monitoring over several decades, accompanied by demographic monitoring of a larger sample size and experimental studies to reveal current and future human impacts on genetic diversity and differentiation in the Anthropocene.
Supplementary Information
Below is the link to the electronic supplementary material.
Supplementary Material 1
Supplementary Material 2
The reference list from the paper itself. Each links out to its DOI / PubMed record.
- 1Margules, C. R. Conservation Biology: The Science of Scarcity and Diversity, JSTOR (1987).
- 2Frankham, R. et al. Introduction to conservation genetics, Cambridge university press (2002).
- 3Hoban, S. et al. Global Commitments to Conserving and Monitoring Genetic Diversity Are Now Necessary and Feasible. Bio Science 71, 964–976 (2021).10.1093/biosci/biab 054PMC 840796734475806 · doi ↗ · pubmed ↗
- 4Schneider, C. et al. Biologisch-ökologische Grundlagen des Schutzes gefährdeter Segetalpflanzen, Bundesamt für Naturschutz (1994).
- 5Jäger, E. J. et al. (eds) Exkursionsflora Von Deutschland (Spektrum Akademischer, 2013).
- 6Knuth, P. Handbuch der Blütenbiologie, Engelmann (1898).
- 7Poschlod, P. Geschichte Der Kulturlandschaft: Entstehungsursachen Und Steuerungsfaktoren Der Entwicklung Der Kulturlandschaft, Lebensraum- Und Artenvielfalt in Mitteleuropa 2nd edn (Verlag Eugen Ulmer, 2017).
- 8Takata K, Taninaka H, Nonaka M, Iwase F, Kikuchi T, Suyama Y, Nagai S, Yasuda N. 2019. Multiplexed ISSR genotyping by sequencing distinguishes two precious coral species (Anthozoa: Octocorallia: Coralliidae) that share a mitochondrial haplotype. Peer J 7:e 7769, 10.7717/peerj.776910.7717/peerj.7769 PMC 677911731598424 · doi ↗ · pubmed ↗