Chitosan-dextran sulfate nanocapsules for enhanced tigecycline efficacy against non-typhoidal Salmonella enterica
Mona R. Omar, Ahmed A. Saeed, Seham M. Malhat, Ahmed A. El-Sayed, Abdelmoneim A. Ali, Christina R. B. Youssef, Yasmine H. Tartor

TL;DR
This study shows that chitosan-dextran sulfate nanocapsules improve tigecycline's effectiveness against drug-resistant Salmonella by reducing resistance and enhancing treatment outcomes.
Contribution
The study introduces a novel drug delivery system using chitosan-dextran sulfate nanocapsules to overcome tigecycline resistance in non-typhoidal Salmonella.
Findings
CD-TGC nanocapsules significantly reduced the minimum inhibitory concentration of tigecycline against NTS strains.
CD-TGC downregulated efflux pump genes and improved survival rates in a mouse model of Salmonella infection.
Histopathological analysis showed reduced tissue damage in mice treated with CD-TGC compared to tigecycline alone.
Abstract
Salmonella is a significant foodborne pathogen found worldwide. Resistance to tigecycline (TGC) has been increasingly reported. The emergence of multidrug-resistant (MDR) non-typhoidal Salmonella (NTS) with high efflux pump activity necessitates the development of efficient drug delivery systems. This study investigates the potential of tigecycline-loaded chitosan-dextran sulfate (CD-TGC) nanocapsules to combat NTS in vitro and in vivo mouse peritonitis model. Antimicrobial susceptibility and efflux pump activity of NTS isolates were tested. S. enterica serotype Bredeney isolates that showed high efflux index and high multiple antibiotic resistance index were subjected to whole genome sequencing (WGS), revealing numerous resistance genes, including APH(3’’), MarA, MarB, MarR, Alr, Ddl, dxr, BcrC, AcrAB-TolC, AcrAD-TolC, gidB, GdpD, PgsA, H-NS, and OxyR. Additionally, the presence of…
Genes, proteins, chemicals, diseases, species, mutations and cell lines named across the full text — each resolved to its canonical identifier and authoritative record.
Click any figure to enlarge with its caption.
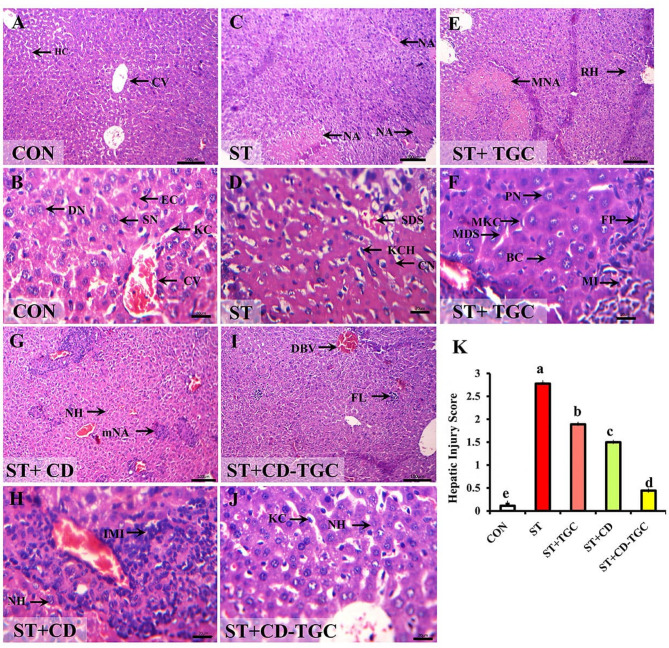 Figure 10
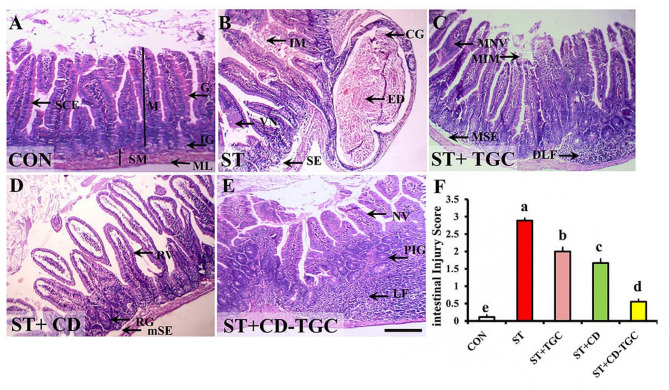 Figure 11
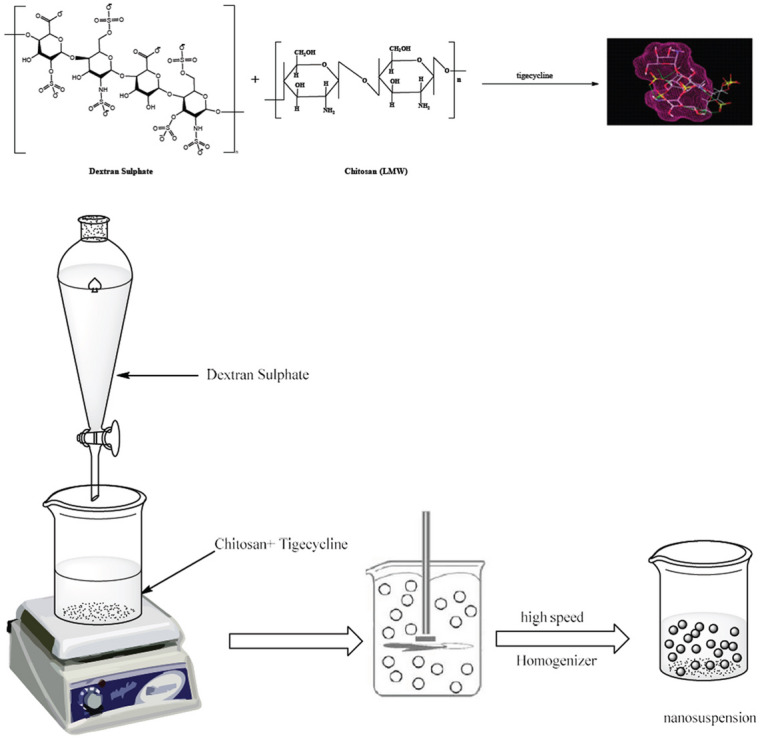 Figure 1
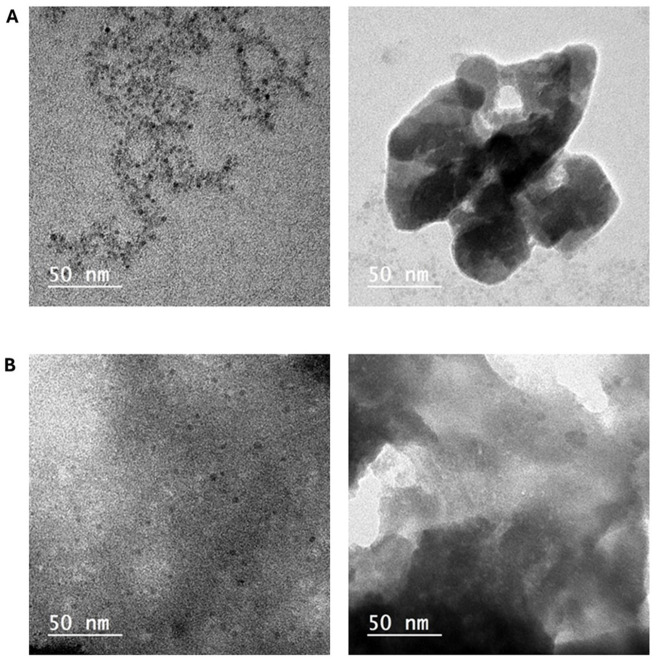 Figure 2
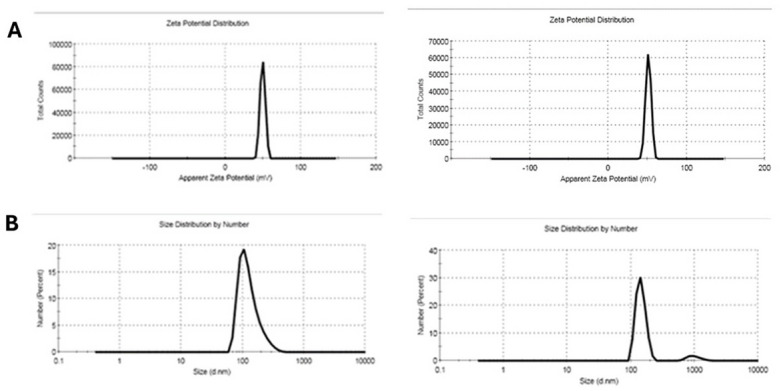 Figure 3
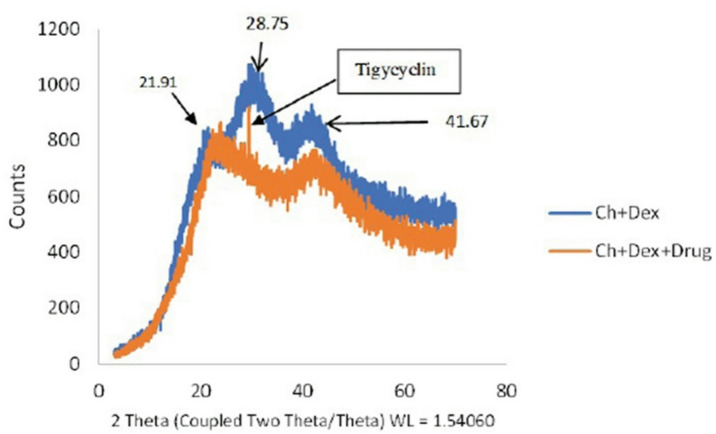 Figure 4
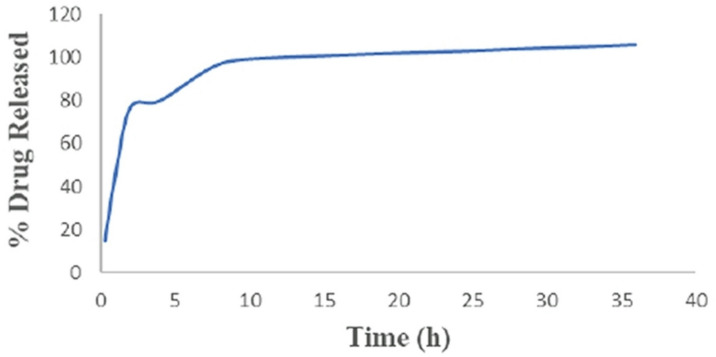 Figure 5
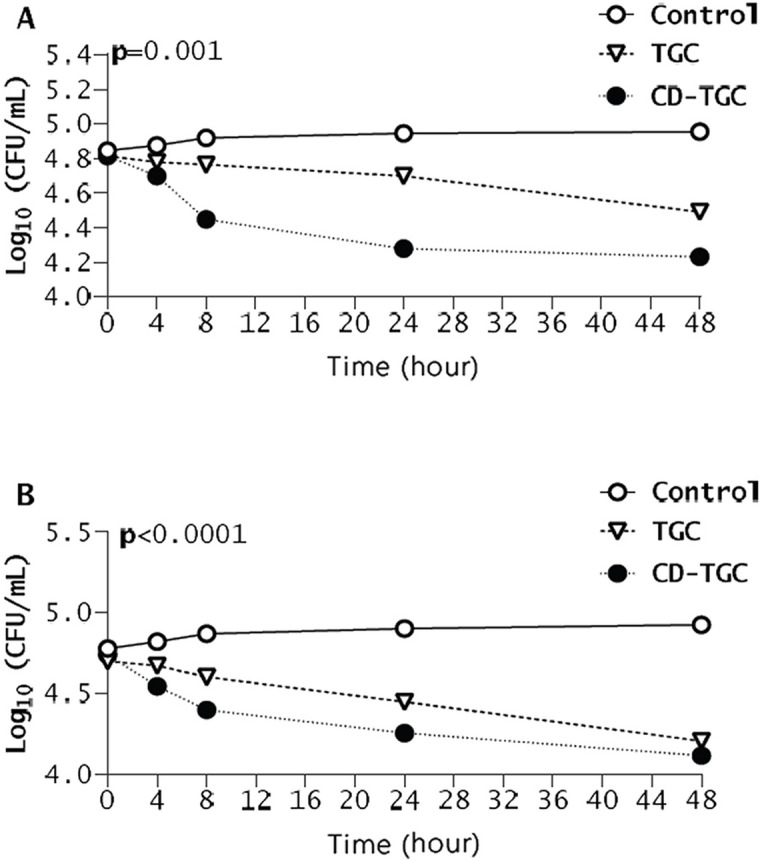 Figure 6
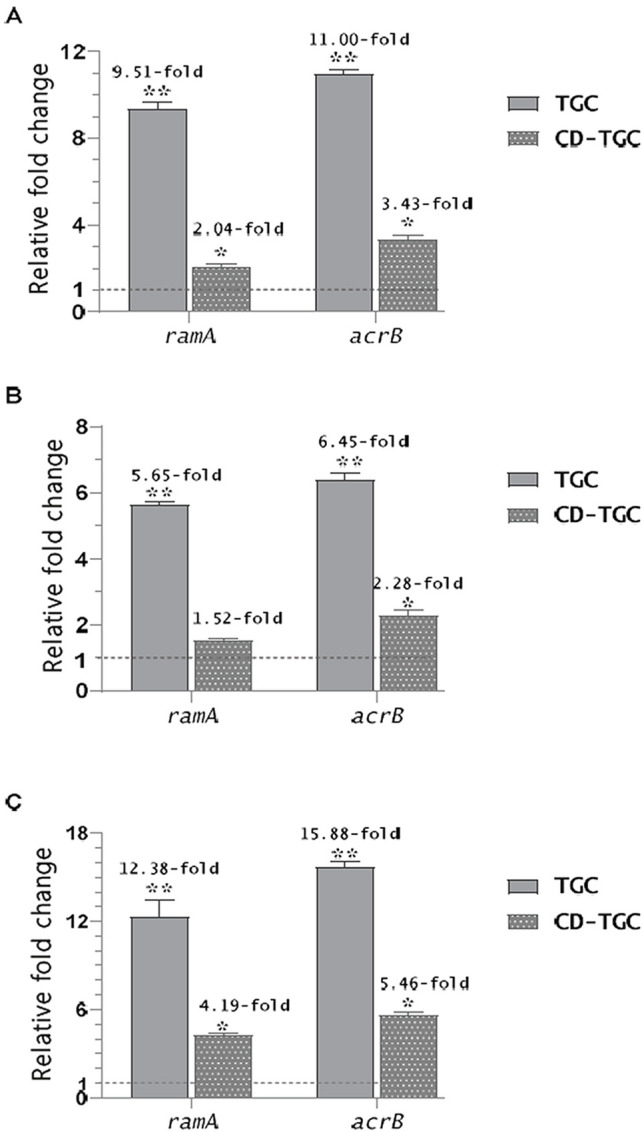 Figure 7
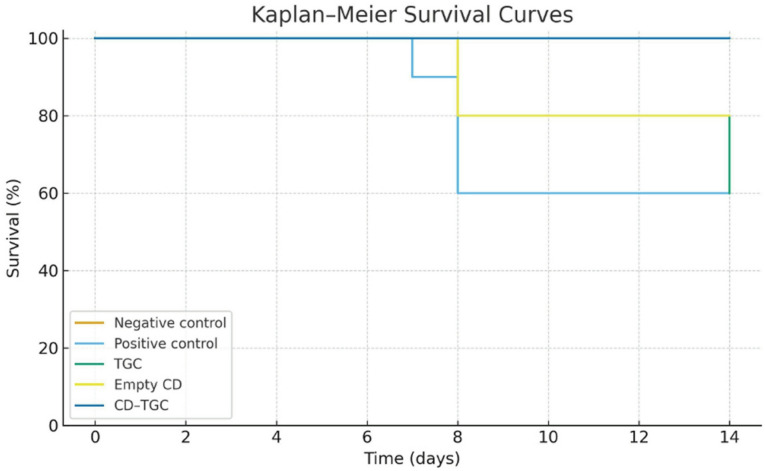 Figure 8
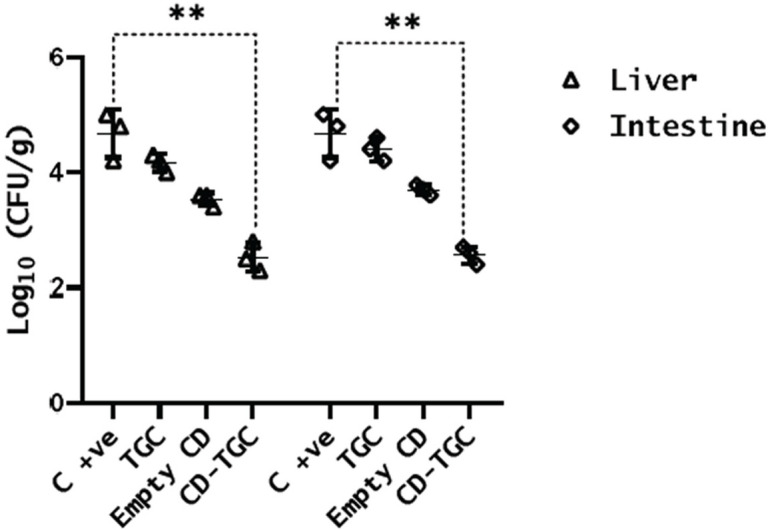 Figure 9
- —Zagazig University
Peer Reviews
No public reviews on file for this paper yet. If you reviewed it on a platform where reviews are public (OpenReview, ICLR, NeurIPS, ICML), you can paste yours below so the community can read it here.
Videos
No videos yet. Explain this paper in a talk, walkthrough, or lecture? Add one.
Taxonomy
TopicsSalmonella and Campylobacter epidemiology · Antibiotic Resistance in Bacteria · Aquaculture disease management and microbiota
Introduction
Salmonella is an important zoonotic pathogen causing substantial economic losses. Non-typhoidal Salmonella (NTS) serovars are the primary cause of both intestinal and extra-intestinal infections^1^. NTS is a major bacterial cause of diarrhea worldwide, resulting in approximately 150 million illnesses and 60,000 deaths annually^2^. In low-and middle-income countries, bloodstream infections caused by Salmonella enterica serovars are most common, and serious complications such as meningitis and gastrointestinal perforation can arise from Salmonella infections when antibiotic treatment is ineffective^3^. The increasing prevalence of antimicrobial-resistant Salmonella, particularly in chicken meat contaminated with NTS, is a major public health concern worldwide^4^.
Due to the widespread use of antimicrobials in humans and livestock production, Salmonella has developed increasing resistance to antimicrobials such as β-lactams, aminoglycosides, sulfonamides, tetracyclines, and the quinolones^5^. A broad-spectrum antibiotic for combating Salmonella infections is tigecycline (TGC), which has gained attention as a last-resort treatment^6^. A major concern is the increasing tetracycline resistance in Salmonella, which has been linked to the unreasonable overuse of TGC and has attracted widespread attention^7^. Bacterial efflux pump systems are crucial in the development of TGC resistance. Notably, AcrAB-TolC is a prominent multidrug-resistant efflux pump belonging to the resistance-nodulation-division (RND) family^7–10^. The challenge of treating some intestinal infections stems from poor drug penetration into host cells and inadequate delivery to infection sites. Improved drug delivery, selectivity, and macrophage-targeted intracellular transport are urgently needed^11^.
Prolonging antibiotic contact with microbial surfaces enhances the treatment of infectious diseases. Nanotechnology alters the characteristics of nanoparticles utilized as antimicrobial agents, drug delivery methods, cellular labeling, biomarkers, diagnostic tools, bioimaging techniques, and nanotherapeutics for the treatment of many diseases^12^. Furthermore, nanocarriers have been utilized in the management of bacterial infections^13^. The delivery carriers may be micro- or nano-sized and comprise peptides, polymers, liposomes, nanoparticles, and numerous other inorganic nanomaterials^14^. Adsorption, encapsulation, and chemical conjugation can all be used to insert the medications into nanocarriers, which will enable them to efficiently and very specifically reach the intended site^15^. Nanovehicle delivery of antibiotics protects the drugs from bacterial resistance mechanisms and, if the nanovehicle itself has antibacterial properties, allows for lower antibiotic dosages and concentrations^16^. Nanovehicles can also improve drug pharmacokinetics, extend drug retention, enhance biocompatibility, and reduce harm to the host^17^. Ongoing research into new antimicrobials has yielded antimicrobial biomaterials based on polymers and their composites^18^. Polymeric nanoparticles can associate with negatively charged bacterial membranes, enhancing their permeability^19^. Chitosan (CH) is a biodegradable cationic polymer known as (1, 4)-2-amino-2-deoxy-D-glucan. This linear polyamino saccharide, derived from the N-deacetylation of chitin, is biocompatible and mucoadhesive, suggesting its potential as a drug carrier^20^. Furthermore, it exhibits enhanced antibacterial and antibiofilm properties^21^. However, CH alone does not possess targeted macrophage specificity for treating pathogenic intracellular S. Typhi. Targeted delivery to intracellular infection sites, achieved by conjugating CH with a carbohydrate polymer, is necessary to enhance its efficacy^20^. The usefulness of CH is restricted as it is ineffective at an acidic pH^22^.
To address this problem, dextran sulfate (DS), a biocompatible polyanionic polymer and branched-chain polysaccharide characterized by 1–6 and 1–4 glycosidic linkages, has been utilized for its significant function in enzyme inhibition and as a drug conjugate for drug delivery^23^.
No previous comprehensive study has examined the anti-efflux activity of tigecycline-loaded chitosan-dextran sulfate (CD-TGC) nanocapsules against S. enterica strains and the genetic features of S. enterica serotype Bredeney strains with high efflux pump activity circulating in Egypt. This study was designed to: (i) characterize the genetic features of NTS exhibiting high efflux pump activity and harboring resistance genes, (ii) investigate the anti-efflux pump activity of CD-TGC against NTS, and (iii) in vivo activity of CD-TGC against S. Typhimurium infection in mice model.
Materials and methods
Salmonella enterica strains
This study included twelve Salmonella enterica strains from chicken and duck meat samples that were purchased from poultry retail outlets at Zagazig, Egypt (Table 1). Strains were identified through biochemical characters, including oxidase, methyl red, Voges–Proskauer, and citrate utilization tests, along with their unique reactions on triple sugar iron agar and lysine decarboxylase media (Oxoid, United Kingdom). Salmonella strains were serotyped by commercially available antisera (Denka Seiken Co., Ltd., United Kingdom) following the antigenic profile defined by Kauffmann^24^. Polymerase chain reaction (PCR) of the invA gene was performed to confirm Salmonella identification^25^.
Table 1. Antimicrobial resistance profile and efflux pump activity of Salmonella enterica strains included in the study.SerovarSourceAntimicrobial resistance patternMAR indexMIC (µg/mL)After TGC treatmentAfter CD-TGC treatmentTGC CIP CTCD-TGC nanocapsuleEfflux pump activityMC_EtBr_ (µg/mL) indexEfflux pump activityMC_EtBr_ (µg/mL) indexS. Bredeney (code no 33)DuckAMC, SAM, CZ, CXM, FEB, FOX, CN, TOB, CIP, TE, TGC, FOS, C, SXT, CT, NA, IPM, ETP, AM.0.79128 2 412.591.55S. Bredeney (code no 5)ChickenAM, AMC, SAM, CZ, CXM, CRO, FEB, FOX, CN, AK, CIP, TE, TGC, FOS, C, SXT, ATM, CT0.7564 2 3212.5913S.TyphimuriumChickenAM, AMC, SAM, CZ, CX, CRO, FEB, FOX, TOB, NA, CIP, TE, TGC, FOS, C, SXT, CT0.7164 16 161271.55S.TyphimuriumChickenAM, AMC, SAM, CZ, CXM, CRO, FEB, FOX, TOB NA, CIP, TE, TGC, FOS, C, SXT, CT0.7164 8 1612713S. MagherofttChickenAM, AMC, SAM, CZ, CXM, CRO, FEB, FOX, TOB, CIP, TE, TGC, FOS, C, SXT, CT0.6732 16 80.51.550.51S. TyphimuriumChickenAM, AMC, SAM, CZ, CXM, CRO, FEB, FOX, TOB, NA, CIP, TE, TGC, FOS, C, SXT, CT0.7132 2 320.51.550.51S. TakoradiChickenAM, AMC, SAM, CZ, CXM, CRO, FEB, FOX, CN, TOB, CIP, TE, TGC, FOS, C, SXT, CT0.7132 8 80.51.550.51S.TyphimuriumChickenAM, AMC, CZ, CXM, CRO, FEB, FOX, CN, AK, CIP, TE, FOS, C, SXT, ATM, CT, TGC0.7164 4 812.5913S. BredeneyChickenAM, AMC, SAM, CZ, CXM, CRO, FEB, FOX, TOB, NA, CIP, TE, TGC, FOS, C, SXT, CT, IPM, ETP.0.7164 32 321271.55S.TyphimuriumChickenAM, AMC, SAM, CZ, CXM, CRO, FEB, FOX, TOB, NA, CIP, TE, TIG, FOS, C, SXT, CT0.7164 8 1612713S. EnteritidisChickenAM, AMC, CZ, CXM, CRO, FOX, ETP, IPM, CN, TOB, CT CIP, TE, C, SXT, TGC0.6732 16 80.51.550.51*S.*TyphimuriumChickenAM, AMC, SAM, CZ, CXM, CRO, FEB, FOX, TOB, NA, CIP, TE, TGC, FOS, C, SXT, CT0.7132 8 160.51.550.51MIC, minimum inhibitory concentration; AM, ampicillin; AMC, amoxicillin-clavulanic acid; SAM, ampicillin-sulbactam; CZ, cefazolin; CXM, cefuroxime; CRO, ceftriaxone; FEB, cefepime; FOX, cefoxitin; IPM, imipenem; ETP, ertapenem; CN, gentamicin; TOB, tobramycin; AK, amikacin; CIP, ciprofloxacin; TE, tetracycline; TIG, tigecycline; FOS, fosfomycin; C, chloramphenicol; SXT, sulfamethoxazole-trimethoprim; ATM, aztreonam; CT, colistin; MEM, meropenem; DOR, doripenem; NA, nalidixic acid; MAR, multiple antibiotic resistance index; CD-TGC, tigecycline-loaded chitosan-dextran sulfate nanocapsule; MC_EtBr_, minimal concentration of ethidium bromide that induces fluorescence in the test strain.
Antimicrobial susceptibility testing of Salmonella strains
The antimicrobial susceptibilities of all Salmonella enterica strains were assessed against 24 antibiotics (Oxoid, Hampshire, England, United Kingdom) using the disk diffusion method^26^. The tested antimicrobial agents were amoxicillin-clavulanic acid (AMC, 20 µg/10 µg), ampicillin-sulbactam (SAM, 20/10 µg), cefazolin (CZ, 30 µg), ceftriaxone (CRO, 30 µg), cefuroxime (CXM, 30 µg), cefepime (FEB, 30 µg), cefoxitin (FOX, 30 µg), imipenem (IPM, 10 µg), ertapenem (ETP, 10 µg), meropenem (MEM, 10 µg), doripenem (DOR, 10 µg), ciprofloxacin (CIP, 5 µg), trimethoprim-sulfamethoxazole (SXT, 1.25 µg/23.75 µg), tetracycline (TE, 30 µg), ampicillin (AM, 10 µg), aztreonam (ATM, 30 µg), gentamicin (GM, 10 µg), tobramycin (10 µg), amikacin (AK, 30 µg), nalidixic acid (NA, 30 µg), tigecycline (TIG, 15 µg), fosfomycin (FOS, 50 µg), colistin (CT, 10 µg), and chloramphenicol (C, 30 µg). The inhibition zone diameters were interpreted in accordance with the guidelines of the Clinical and Laboratory Standards Institute (CLSI) and the European Committee on Antimicrobial Susceptibility Testing (EUCAST)^27,28^. The minimal inhibitory concentrations (MICs) of TGC, CT, and CIP were determined by broth microdilution method using the CLSI and EUCAST interpretive criteria. The MIC breakpoints used were: TGC > 2 µg/mL, CT > 2 µg/mL, and CIP ≥ 1 µg/mL.^27, 28^ The multiple antibiotic resistance (MAR) index was calculated as previously described^29^.
Testing efflux pump activity
The efflux pump activity of Salmonella strains was assessed using the ethidium bromide (EtBr) cartwheel method^30^. On the day of the experiment, trypticase soy agar (TSA, Oxoid, United Kingdom) plates containing ethidium bromide (EtBr, Sigma-Aldrich, Germany) at concentrations 0.0, 0.5, 1.0, 1.5, 2.0, and 2.5 mg/L were prepared. Each Salmonella strain (1.5 × 10^8^ colony-forming units (CFU)/mL) was inoculated on an EtBr plate in a cartwheel arrangement. The plates were enveloped in aluminum foil and incubated at 37 °C for an overnight period. The lowest concentration of EtBr that elicited fluorescence in bacterial colonies under the Accuris TM E3000 UV Transilluminator (Accuris Instruments, United States) was documented. A sensitive Salmonella strain (S. Virchow) served as a comparative control for fluorescence analysis. The ability of each Salmonella strain to extrude EtBr substrate was assessed in comparison to the control isolate using the following equation:
\documentclass[12pt]{minimal} \usepackage{amsmath} \usepackage{wasysym} \usepackage{amsfonts} \usepackage{amssymb} \usepackage{amsbsy} \usepackage{mathrsfs} \usepackage{upgreek} \setlength{\oddsidemargin}{-69pt} \begin{document}$${\text{Efflux activity index }}=~\frac{{~M{C_{EtBr(MDR)}} - M{C_{EtBr}}\left( {REF} \right)}}{{M{C_{EtBr}}~\left( {REF} \right)}}$$\end{document}where \documentclass[12pt]{minimal} \usepackage{amsmath} \usepackage{wasysym} \usepackage{amsfonts} \usepackage{amssymb} \usepackage{amsbsy} \usepackage{mathrsfs} \usepackage{upgreek} \setlength{\oddsidemargin}{-69pt} \begin{document}$${\mathrm{M}}{{\mathrm{C}}_{{\mathrm{EtBr}}}}$$\end{document} is the minimal concentration of EtBr that induces fluorescence in the test strain. Simultaneously \documentclass[12pt]{minimal} \usepackage{amsmath} \usepackage{wasysym} \usepackage{amsfonts} \usepackage{amssymb} \usepackage{amsbsy} \usepackage{mathrsfs} \usepackage{upgreek} \setlength{\oddsidemargin}{-69pt} \begin{document}$${\mathrm{M}}{{\mathrm{C}}_{{\mathrm{EtBr}}}}$$\end{document} (REF) denotes the minimal concentration of EtBr required to elicit fluorescence in the reference strain.
Whole genome sequencing
The strains were cultured overnight at 37 °C on tryptone soya broth (TSB, Oxoid, United Kingdom) and bacterial DNA was extracted using GenElute Bacterial Genomic DNA kit according to the manufacturer’s instructions (Sigma-Aldrich). The sequence was performed using Oxford Nanopore technology using the rapid barcoding kit 96 SQK-RBK 110.96. Complete genome analysis was performed using the comprehensive genome analysis service in PATRIC web resources^31^. Multi Locus Sequence Typing (MLST) was performed using MLST 2.0.9 detection service^32^. PlasmidFinder 2.1 was used to identify plasmids^33^. Resistance genes were identified by Resistance Gene Identifier (RGI) on the Comprehensive Antibiotic Resistance Database (CARD) (https://card.mcmaster.ca/home). The sequences were submitted to the NCBI Sequence Read Archive (SRA) (https://submit.ncbi.nlm.nih.gov/subs/sra/) with BioProject accession number PRJNA1189127.
Synthesis of cross-linked chitosan–dextran sulfate nano-dispersion and nanoparticles encapsulated Tigecycline
Tigecycline was obtained from Tygacil^®^, Pfizer Inc., and chitosan (low molecular weight) was obtained from Sigma Aldrich Chemicals, Germany. Dextran sulfate, acetic acid, and all other substances were of analytical reagent quality and procured from Sigma Aldrich Fine Chemicals. Various formulation batches were conducted to assess the impact of formulation variables on the dependent variables. The optimization of the formulation employed a central composite rotatable design to examine the effects of independent factors, specifically chitosan and DS concentrations, on the dependent variables, mean particle size (MPS) and Zeta potential. The four distinct batches of lyophilized nanoparticles were formulated with 50 mg of chitosan, 12.5 mg of DS, a MPS of 129.4 nm, a polydispersity index (PDI) of 0.125, and a zeta potential of 51.3 mV.
Low molecular weight chitosan (0.5 g) was dissolved in 80 mL of 2% aqueous acetic acid solution while stirring until complete dissolution occurred (Fig. 1). Tigecycline (50 mg) was diluted in 10 mL of distilled water, incorporated into the chitosan solution with continuous stirring for approximately one hour, and subjected to sonication for an additional hour. Dextran sulfate (0.125 g) was dissolved in 10 mL of distilled water (ratio 8:2) and incrementally added to the chitosan mixture with continuous agitation at ambient temperature. The solution transformed into a milky suspension, signifying the synthesis of chitosan nanoparticles^34^.
Fig. 1. Preparation of tigecycline -loaded nanoparticles using dextran sulphate and low molecular weight (LMW) chitosan.
Characterization of chitosan/dextran sulfate nanoparticles encapsulated Tigecycline
Transmission electron microscopy (TEM)
The dimensions and morphology of CD NPs were effectively determined using High-Resolution Transmission Electron Microscopy (HRTEM) (JEOL-JEM 2100, Japan). For transmission electron microscopy (TEM) observations, a droplet of colloidal solution was deposited onto a 400-mesh carbon-coated copper grid, and the solvent was allowed to evaporate in ambient air at room temperature.
Distribution of particle size and zeta potential
The average diameter, size distribution, and zeta potential of the samples were evaluated using a particle size analyzer (Nano-ZS, Malvern Instruments Ltd., UK). The sample was subjected to sonication for 10–20 min before the measurement of size distribution and zeta potential.
X-ray powder diffraction (XRD)
Powder diffraction was conducted using Cu (λ = 1.54 Å) with a Ni filter at room temperature (voltage = 40 kV) employing a Brucker Axs, 08 Advance X-ray powder diffractometer. Analyses were conducted on samples of pure fenofibrate (FBT), poloxamer 188, a physical combination of FBT and poloxamer 188, and lyophilized nanocrystals. The equipment was utilized at a scanning rate of 1°/min for a 2θ of 70°.
Stability of tigecycline-loaded chitosan-dextran sulfate nanocapsules
The kinetic release of TGC from nano-encapsulation was examined in 0.1 M phosphate-buffered saline (PBS) solution at a pH 7.4 which mimics the pH of blood. A dialysis bag with a molecular weight cut of (12–14 KDa) was used to absorb 60 mg of the nano-encapsulation medication, which had an initially high concentration, in a 2 mL buffer solution. The bag was subsequently immersed in a 30 mL PBS reservoir with gentle agitation (at 100 rpm). To facilitate TGC release from the nano-encapsulation, 1 mL of the phosphate buffer reservoir was removed at predetermined intervals and replaced with a new 1 mL buffer. A UV spectrophotometer (PerkinElmer, Inc., Waltham, Massachusetts, USA) operating at 245 nm was used to ascertain the dosage of the discharged TGC ^35.^
Cumulative amount of TGC released (mg)
Since each sample is 1 mL, the amount of TGC in each withdrawn sample = Conc. × 1 mL. However, since we are sampling and replacing the buffer, we must account for the cumulative release (i.e., keep track of the drug lost from the reservoir and replaced by zero-concentration buffer). This recursive formula was used:
\documentclass[12pt]{minimal} \usepackage{amsmath} \usepackage{wasysym} \usepackage{amsfonts} \usepackage{amssymb} \usepackage{amsbsy} \usepackage{mathrsfs} \usepackage{upgreek} \setlength{\oddsidemargin}{-69pt} \begin{document}$${\mathrm{Q}}_{{\mathrm{t}}} = {\text{ C}}_{{\mathrm{t}}} {\text{X V }} + \sum\limits_{{i = 1}}^{{t - 1}} {{\mathrm{C}}_{{\mathrm{i}}} {\text{X V}}_{{\mathrm{s}}} }$$\end{document}Q_t_ refers to cumulative drug amount released at time t, C_t_: concentration at time t, C_i_: concentration at previous time points, V: total volume of dissolution medium, and V_s_ represents volume of sample withdrawn at each time point.
Drug loading onto Chitosan dextran sulphate
Tigecycline nano-encapsulated with the lowest particle size and a reasonable negative zeta potential was selected to be used in drug loading. Tigecycline was dissolved in distilled water and added to the CH low molecular weight in 1% acetic acid, and then DS was added drop by drop, stirred for an hour, then centrifuged at 6000 rpm for 30 min. The solution removed from the centrifuge was analyzed by UV–Vis spectroscopy (PerkinElmer, Inc., Waltham, Massachusetts, USA) to determine the concentration of unloaded drug. The drug loading content (DL) and encapsulation efficiency (EE) were evaluated as follows:
\documentclass[12pt]{minimal} \usepackage{amsmath} \usepackage{wasysym} \usepackage{amsfonts} \usepackage{amssymb} \usepackage{amsbsy} \usepackage{mathrsfs} \usepackage{upgreek} \setlength{\oddsidemargin}{-69pt} \begin{document}$${\mathrm{DL}}\% {\text{ }}={\text{ }}\left( {{\text{Weight of the drug in encapsulation }}/{\text{Weight of the chitosan dextran sulphate}}} \right) \times {\mathrm{1}}00$$\end{document} \documentclass[12pt]{minimal} \usepackage{amsmath} \usepackage{wasysym} \usepackage{amsfonts} \usepackage{amssymb} \usepackage{amsbsy} \usepackage{mathrsfs} \usepackage{upgreek} \setlength{\oddsidemargin}{-69pt} \begin{document}$${\mathrm{EE}}\% ={\text{ }}\left( {{\text{Weight of the drug in encapsulation }}/{\text{Weight of the feeding drugs}}} \right) \times {\mathrm{1}}00$$\end{document}Fitting drug release kinetics models
We’ll try to fit:
- Zero-order: Qt = Q0 + k0t.
- First-order: log Qt = log Q0 − k1t/2.303.
- Higuchi: Q_t_ =k_H_ √t.
- Korsmeyer-Peppas: Qt/Q∞=kt^n^.
Safety of tigecycline-loaded chitosan-dextran sulfate nanocapsules on BJ normal human fibroplasts
BJ normal human foreskin primary fibroblast cell line (ATCC CRL-2522) was used for studying safety of CD-TGC nanocapsules. Cell line viability was assessed by the mitochondrial-dependent reduction of yellow MTT (3-(4,5-dimethylthiazol-2-yl)-2,5-diphenyl tetrazolium bromide) to purple formazan^36^. All procedures were done in a sterile area using a Laminar flow cabinet biosafety class II level (Baker, SG403INT, Sanford, ME, USA). BJ normal human foreskin fibroblasts were suspended in Dulbecco′s Modified Eagle′s Medium/Nutrient Mixture F-12 Ham medium containing 1% antibiotic mixture (10,000 U/mL potassium penicillin, 10,000 µg/mL streptomycin sulfate and 25 µg/mL amphotericin B) and 1% L-glutamine (Sigma-Aldrich, Germany) at 37 °C under 5% CO_2_. Cells were batch cultured for 10 days, then seeded at a concentration of 10 × 10^3^ cells/well in fresh complete growth medium in 96-well microtiter plastic plates at 37 °C for 24 h under 5% CO_2_ using a water jacketed Carbon dioxide incubator (Sheldon, TC2323, Cornelius, OR, USA). Media was aspirated, fresh medium (without serum) was added, and cells were incubated either alone (negative control) or with different concentrations of sample to give a final concentration of 100, 50, 25, 12.5, 6.25, 3.125, 0.78, and 1.56 µg/mL). After 48 h of incubation, the medium was aspirated, 40 µL MTT salt (2.5 µg/mL) was added to each well, and incubated for a further four hours at 37 °C under 5% CO_2_. To stop the reaction and dissolve the formed crystals, 200 µL of 10% Sodium dodecyl sulphate (SDS) in deionized water was added to each well and incubated overnight at 37°C. DOX was used as a positive control at 100 µg/mL gives 100% lethality under the same conditions^37^.
The absorbance was then measured using a microplate multi-well reader (Bio-Rad Laboratories Inc., model 3350, Hercules, California, USA) at 595 nm and a reference wavelength of 620 nm. DMSO is the vehicle used for dissolution the nanocapsule, and its final concentration on the cells was less than 0.2%. The percentage of change in viability was calculated according to the formula: [(Reading of tested sample/Reading of negative control) − 1]×100.
A probit analysis was carried out using IBM SPSS Statistics to determine the lethal concentration of the sample at which 50% (IC50) and 90% (IC90) of cells die within 48 h. Statistical significance was tested between samples and negative control (cells with vehicle) using an independent t-test.
Time-kill curves
Suspensions of S. Typhimurium were diluted to approximately 8 × 10^4^ and 8 × 10^6^ CFU/mL in 25 mL of Mueller-Hinton broth (Oxoid, United Kingdom) in separate 125-mL glass conical flasks. Susceptible breakpoint concentrations of TGC (2 µg/mL) were prepared and placed in flasks^38^. Each flask was incubated at 37 °C. The bacterial count was assessed at 0, 4, 8, 24, and 48 h by counting the colonies in 100-µL aliquots of 10-fold serially diluted specimens plated on XLD agar medium (Oxoid Ltd., Hampshire, UK).
Expression of efflux pump genes
SYBR Green real-time PCR was employed to assess the relative expression levels of the ramA and acrB genes using the oligonucleotide primers: ramA-F (5′-CACGATTGTCGAGTGGATTG − 3′) and ramA-R (5′-AAAATGCGCGTAAAGGTTTG − 3′)^39^ and acrB-F (5′-GGCATTGGGTATGACTGGAC-3′) and acrB-R (5-GCATTACGGAGAACGGGATAG-3),^40^ with the 16S rRNA gene: 16S rRNA-F(5′-CAGAAGAAGCACCGGCTAACTC-3′) and 16S rRNA-R (5-GCGCTTTACGCCCAGTAATT-3) serving as the housekeeping gene^41^. Total RNA was extracted from Salmonella strains using the QIAamp RNeasy Mini kit (Qiagen, Germany) in accordance with the manufacturer’s guidelines. Relative quantification was performed using the Quantitect SYBR Green PCR kit (Qiagen, Germany) in the MX3005P real-time PCR thermal cycler (Agilent, La Jolla, CA, United States), adhering to the manufacturer’s guidelines. The Stratagene MX3005P program was utilized to ascertain amplification curves and CT values. To evaluate the differential gene expression of RNA among various samples, the CT values of each sample were compared with those of the control group utilizing the “^ΔΔ^CT” method as delineated by Yuan et al.^42^. The possibility of false positive results was eliminated by comparing dissociation curves across many samples.
In vivo evaluation using mice peritonitis model
Fifty mice were randomly assigned to five groups of ten mice each. The mice were obtained from the animal facility of the Faculty of Veterinary Medicine at Zagazig University. The animals underwent a 10-day acclimation period and were fed a high-quality commercial balanced diet and water ad libitum.
Mice were fasted for 12 h before bacterial inoculation. Four groups of mice were infected with S. Typhimurium intraperitoneally at a dose of 1.3 × \documentclass[12pt]{minimal} \usepackage{amsmath} \usepackage{wasysym} \usepackage{amsfonts} \usepackage{amssymb} \usepackage{amsbsy} \usepackage{mathrsfs} \usepackage{upgreek} \setlength{\oddsidemargin}{-69pt} \begin{document}$$\:{10}^{6}$$\end{document} CFU/mL, and 0.1 mL of the diluted culture was injected into the peritoneal cavity (i.p.), and the fifth group (control negative) received PBS. Six hours post-infection, three groups received subcutaneous injections every 12 h for 4 days of either TGC (6.25 mg/kg),^38^ CD-TGC (25 mg/kg), or unloaded CD NPs (6.25 mg/20 gm). The positive control group was infected with S. typhimurium but received no treatment. The negative control group received PBS only. The dose of CD-TGC was determined based on the lethal dose 50 (LD50)^43^. Animals were examined twice daily for signs of illness or death for 15 days. Five mice from each group were sacrificed after 4 days. At the end of the experiment, euthanasia was performed with pentobarbital sodium i.p. (120 mg/kg body weight), followed by cervical dislocation for confirmation.
This study protocol, including all animal procedures, was performed following the ARRIVE guidelines and regulations (https://arriveguidelines.org) and was approved by the Zagazig University Institutional Animal Care and Use Committee (ZU-IACUC) under approval number ZU-IACUC/2/F/12/2019.
Measurement of biochemical and hematological parameters
To assess clinical chemistry parameters, blood samples were collected from mice, allowed to clot, and then centrifuged at 3500 rpm for 5 min to obtain serum. The serum total protein (TP), albumin (Alb), aspartate aminotransferase (AST), alanine transaminase (ALT), lactate dehydrogenase (LDH), total bilirubin, urea, and creatinine levels were measured in various animal groups using Spinreact kits (Esteve De Bas, Girona, Spain) according to manufacturer instructions.
Hematological parameters, including hemoglobin (Hb) and white blood cell (WBC) counts, were assessed using a cell blood counter (Celltac Alpha MEK6550, Nihon Kohden Company, Japan). A Giemsa-stained blood smear was used to differentiate WBCs into neutrophils and lymphocytes.
Assessment of bacterial load
The liver and intestine were collected, weighed, and homogenized in sterile PBS. The homogenate was serially diluted and plated on XLD agar. CFUs per gram of organ were counted after a 24-hour incubation at 37 °C.
Histopathological analysis
The specimens obtained from the liver and intestine of various groups were preserved in 10% neutral buffered formalin, dehydrated through increasing concentrations of alcohol, cleaned with xylene, and embedded in molten paraffin wax. Five-micrometer paraffin slices were prepared using a microtome (Thermo Scientific, Massachusetts, USA) and subsequently stained with hematoxylin and eosin (H&E)^44^.
Histopathological assessments were performed by investigators blinded to group assignments. A semiquantitative scoring system was employed, following the ordinal method^45^. Hepatic and intestinal injury was scored by examining three fields per rat (six rats per group) in photographed H&E-stained sections at 400× magnification. Hepatic damage was evaluated through hepatocyte degradation and necrosis accompanied by mononuclear cell infiltration. Intestinal injury was evaluated based on necrosis of villi, cystic gland formation, and submucosal edema. The semiquantitative analysis was scored on four grades: 0, indicating no pathological changes; 1, representing mild alterations; 2, denoting moderate changes; and 3, signifying severe pathological abnormalities^46^.
Data analysis
Shapiro–Wilk test for normality and Levene’s test for homogeneity of variance were conducted on all numerical data. Data analysis was performed with SPSS version 29.0 (IBM Corp., Armonk, NY, USA). Blood parameters were analysed by Analysis of Variance (ANOVA), with Tukey’s range test applied to determine differences among group means^47^. All experiments were performed in triplicate, with three independent biological replicates, and results are expressed as mean ± standard error (SE). Multiple ANOVAs were performed to evaluate the impacts of various groups, incorporating two between-subjects factors and one within-subjects factor. Kaplan–Meier survival curves with log-rank test was employed to compare the survival rates among the various animal groups. The results were considered statistically significant when the p value was less than 0.05. The histopathological findings from the investigated groups were analyzed using one-way ANOVA followed by Duncan’s post hoc test.
Results
Antimicrobial susceptibility of Salmonella enterica strains to different antimicrobials
Salmonella enterica strains’ susceptibility to 24 commonly used antimicrobials was assessed using the disc diffusion method. The isolates were MDR, with MAR index ranging from 0.63 to 0.75. All isolates were resistant to AMC, CZ, FOX, TE, and FEB. The MIC ranges were 2 to 32 µg / mL for CIP, 4 to 32 µg / mL for CT, and 32 to 128 µg / mL for TGC (Table 1).
Efflux pump activity of Salmonella enterica strains
Efflux pump activity of MDR Salmonella strains was evaluated by assessing the ability of bacteria to extrude ethidium bromide from the cell using the cartwheel method. We recorded the fluorescence exhibited by Salmonella strains, which grew as a dense mass along a radial line of TSA plates with increasing concentrations of EtBr. The minimal EtBr concentration and the index of efflux activity for Salmonella strains are presented in Table 1. The fluorescence of the examined Salmonella strains exceeded that of the control (sensitive S. Virchow strain), which exhibited fluorescence at 0.25 µg/mL EtBr. Three TGC-treated strains fluoresced at 2.5 µg/mL, four poultry strains at 2 µg/mL, and five strains at 1.5 µg/mL. One CD-TGC-treated strain fluoresced at 1.5 µg/mL, seven at 0.5 µg/mL, and four at 1 µg/mL.
Antibiotic resistance genes of Salmonella Bredeney strains
Two Salmonella Bredeney strains exhibiting high efflux index and high MAR index were selected for WGS. Both strains harbored a similar spectrum of antibiotic resistance determinants (Table 2 and Fig. S1).
Table 2. Resistance genes of Salmonella Bredeney strains to different antimicrobial agents.Resistance genesUnique resistance genesAntimicrobial classResistance mechanismStrain 33(SRR31606420)Strain 5(SRR31606421)rrsD, APH(3’)-Ia*,* acrD*,* kdpE*, AAC(6’)-Iaa
APH(3’)-IIb AminoglycosideAntibiotic inactivation,AAC(6’)-Iy,* APH(6)-Id*,* APH(3’’)-Ib*,* rrsB*,* rrsC*,* rrnB*,* rrsH* 16S rRNA Antibiotic target alteration, antibiotic effluxsul2,* folPNDNDSulfonamideAntibiotic target alteration rpoB Rifamycin EF-Tu Elfamycin nfsA NDNitrofurangyrB*,* gyrA*,* parE mdtK*,* parC*,* mfd*,* emrB*,* patA*,* mdtH*,* emrA*,* emrRNDNDFluoroquinoloneAntibiotic target alteration, antibiotic effluxyojI*,* bacA*,* pmrB*,* pmrF*,16S rRNA,* arnA* pmrC NDPeptide antibiotictetA,* tetR*,* tetD*,* rrnB*,* rrsB* tetB NDTetracycline PhoP NDNDPeptide antibiotic, macrolideacrB,* sdiA*,* soxR*,* ramR*,* acrA*,* acrRNDNDTetracycline, phenicol, rifamycin, penam, glycylcycline, cephalosporin, fluoroquinolonealaS*,* cysB*,* mdtB*,* mdtC*,* mdtA*,NDNDAminocoumarinmurA,* UhpT*,* GlpT* mdtD NDPhosphonic antibioticsModification of the antibiotic target MurA, antibiotic target alterationomp36,* ompF*,* ompK36NDNDPenem, penam, cephamycin, cephalosporin, carbapenem, monobactamReduced permeability to antibiotic, antibiotic efflux, resistance by absencemarA*,* soxS*,* ramANDNDTetracycline antibiotic, disinfecting agents and antiseptics, penem, phenicol antibiotic, rifamycin antibiotic, penam, cephamycin, glycylcycline, cephalosporin, carbapenem, monobactam, fluoroquinolone antibioticReduced permeability to antibiotic, antibiotic efflux, antibiotic target alterationCMY-57*,* CMY-59*,* CMY-61*,* CMY-43*,* CMY-12CMY-5*,* CMY-7*,* CMY-16*,* CMY-15*,* CMY-28*,* CMY-60*,* CMY-23*,* CMY-6*,* CMY-22*,* CMY-95*,* CMY-108CMY-102*,* CMY-94*,* CMY-56*,* CMY-27*,* CMY-4*,* CMY-99*,* CMY-58*,* CMY-36*CephamycinAntibiotic inactivation CMY-2 NDNDPenam, cephamycin, cephalosporin, carbapenem CMY-42
CMY-42 NDCephamycin, cephalosporin TEM-116
TEM-116 NDPenam, penem, cephalosporin, monobactam OXA-115
OXA-115 NDPenam, carbapenem msbA NDNDNitroimidazoleAntibiotic effluxcpxA,* baeR*,* baeSNDNDAminocoumarin antibiotic, aminoglycoside antibioticacrF*,* acrENDNDPenam, cephamycin, cephalosporin, fluoroquinolone antibiotic H-NS NDNDTetracycline, penam, cephamycin, cephalosporin, fluoroquinolone antibiotic, macrolide antibioticCRP*,* mdtFNDNDPenam, fluoroquinolone, macrolidefloR*,* emrD* mdtL NDPhenicol antibiotic tolC NDNDPeptide antibiotic, tetracycline, aminoglycoside, disinfecting agents, antiseptics, penem, phenicol, rifamycin, aminocoumarin, penam, cephamycin, glycylcycline cephalosporin, carbapenem, fluoroquinolone, and macrolide mdsC
mdsA
golS Phenicol antibiotic, penem, penam, cephamycin, cephalosporin, carbapenem, monobactam mdtM NDNDNucleoside antibiotic, disinfecting agents and antiseptics, phenicol, lincosamide, and fluoroquinolone mdfA NDNDPhenicol antibiotic, tetracycline cpxR Peptide antibiotic, sulfonamide, diaminopyrimidine, aminocoumarin, aminoglycoside, phenicol, tetracycline, penam, cephalosporin, carbapenem, monobactam, fluoroquinolone, macrolide, penem, and cephamycin robA NDNDTetracycline, disinfecting agents and antiseptics, phenicol, rifamycin, penam, glycylcycline, cephalosporin, fluoroquinolone, and macrolide mexB
nalD NDPeptide antibiotic, sulfonamide, diaminopyrimidine, phenicol, aminocoumarin, tetracycline, penam, cephalosporin, carbapenem, monobactam, fluoroquinolone, macrolide, penem, and cephamycin leuO NDNDNucleoside antibiotic, disinfecting agents and antiseptics mexV
mexV NDDisinfecting agents and antiseptics, phenicol, tetracycline, macrolide, fluoroquinolone. oprJ NDphenicol, diaminopyrimidine, aminocoumarin, tetracycline, aminoglycoside antibiotic, penam, cephalosporin, fluoroquinolone antibiotic, and macrolideND smeE phenicol, tetracycline, fluoroquinolone, and macrolide* Resistance genes that are found in both strains. ND stand for not detected genes.
Antibiotic efflux genes
Antibiotic efflux acrB,* sdiA*,* soxR*,* ramR*,* acrA*, and acrR genes mediate tetracycline resistance. Penem, penam, cephalosporin, carbapenem, monobactam resistance is mediated by omp36,* ompF*,* ompK36*,* acrB*,* sdiA*,* soxR*,* ramR*,* acrA*,* acrR*,* acrF*,* acrE*,* H-NS*,* CRP*,* mdtF*,* tolC*,* mdsC*,* marA*,* soxS*,* ramA*,* mdtM*,* mdfA*,* cpxR*,* robA*,* mexB*, and leuO genes. Fluoroquinolone resistance primarily attributed to antibiotic target alteration and efflux: gyrB,* gyrA*,* parE*,* mdtK*,* parC*,* mfd*,* emrB*,* patA*,* mdtH*,* emrA*, and emrR. msbA. cpxA,* baeR*, and baeS efflux genes mediate aminocoumarin resistance. Both tolC and mexB efflux genes are the cause of peptide antibiotic resistance.
Antibiotic target alteration
Target alteration tetA,* tetR*,* tetD*,* rrnB*, and rrsB genes mediate tetracycline resistance. The rpoB gene mediates rifamycin resistance. Moreover, phosphonic acid resistance is mediated by antibiotic target alteration genes (murA,* UhpT*,* and GlpT). alaS*,* cysB*,* mdtB*,* mdtC*, and mdtA genes mediate aminocoumarin resistance. YojI,* bacA*,* pmrB*,* pmrF*,* arnA*, and PhoP genes mediate peptide antibiotic resistance. EF-Tu target alteration gene mediates elfamycin resistance. Sul2 and folP are the main causes of sulfonamide resistance.
Antibiotic inactivation genes
Aminoglycoside resistance is mediated by antibiotic inactivation through rrsD,* APH(3’)-Ia*,* acrD*,* kdpE*,* AAC(6’)-Iy*,* APH(6)-Id*,* APH(3’’)-Ib*,* rrsB*,* rrsC*,* rrnB*, and rrsH genes. CMY-59,* CMY-61*,* CMY-43*, and CMY-12 mediate cephamycin resistance.
Unique genes in S. Bredeney strains of duck and chicken origin
Strain 33 (accession no SRR31606420), isolated from a duck, exhibited unique genes associated with antibiotic resistance. These included genes from the CMY/CMY-2/CFE/LAT family (CMY-16,* CMY-15*,* CMY-60*,* CMY-6*,* CMY-22*,* CMY-23*,* CMY-5*,* CMY-108*,* CMY-57*,* CMY-95*,* CMY-28*,* CMY-7*,* CMY-42*), which encodes antibiotic inactivation enzymes. Additionally, it contained genes encoding efflux pumps (FloR family, mdtD, tetB, mdtL, mdsA, nalD, mexV, and oprJ). Furthermore, target alteration genes nfsA and pmrC, and antibiotic inactivation genes TEM-116 and OXA-115 were identified (Tables 2 and 3).
Table 3. Antimicrobial resistance mechanisms and resistance genes of Salmonella Bredeney strains.AMR mechanismResistance genesAntibiotic inactivation enzymeCMY/CMY-2/CFE/LAT family,* AAC(6’)-Ic*,* f*,g,* h*,j,* k*,l,* r-z*,* APH(3’’)-I*,* APH(3’)-I*,* APH(6)-Ic/APH(6)-IdAntibiotic resistance gene cluster, cassette, or operonMarA*,* MarB*,* MarRAntibiotic target in susceptible speciesAlr*,* Ddl*,* dxr*,* EF-G*,* EF-Tu*,* folA*,* Dfr*,* folP*,* gyrA*,* gyrB*,* inhA*,* fabI*,* Iso-tRNA*,* kasA*,* MurA*,* rho*,* rpoB*,* rpoC*,* S10p*,* S12pAntibiotic target protection protein BcrC Efflux pump conferring antibiotic resistanceAcrAB-TolC*,* AcrAD-TolC*,* AcrEF-TolC*,* AcrZ*,* EmrAB-TolC*,* EmrD*,* MacA*,* MacB*,* MdfA/Cmr*,* MdtABC-TolC*,* MdtL*,* MdtM*,* MexPQ-OpmE*,* OprM*,* FloR family*,* OprM family*,* SugE*,* Tet(B), TolC/OpmHGene conferring resistance via absence gidB Protein altering cell wall charge conferring antibiotic resistanceGdpD*,* PgsARegulator modulating expression of antibiotic resistance genesAcrAB-TolC*,* EmrAB-TolC*,* H-NS*,* OxyR*AMR: antimicrobial resistance mechanism.
Strain 5, isolated from chicken, also exhibited unique resistance genes. These included APH(3’)-IIb and various CMY family members (CMY-102, CMY-94,* CMY-56*,* CMY-27*,* CMY- 4*,* CMY-99*,* CMY-58*, and CMY-36) encoding antibiotic inactivation enzymes. Efflux pump genes golS and smeE were also present (Table 2).
Multilocus sequence typing and plasmid profile
Strain 5 (accession no SRR31606421) shows less than 100% identity to alleles aroC_319, dnaN_63, hemD_303, hisD_16, purE_41, sucA_15, and thrA_3. Based on MLST analysis, its nearest sequence type (ST) is ST 897, indicating the highest similarity. Strain 33 also shows less than 100% identity to alleles aroC_634, dnaN_140, hemD_49, hisD_16, purE_41, sucA_15, and thrA_3. Its nearest STs are 241, 3800, 897, and 8185.
Strain 5 harbors a diverse array of plasmids, including Col(pHAD28), Col440I, ColRNAI, IncFII(29), IncFII(Cf), IncFII(S), IncFII(Yp), IncFII(p96A), IncFII(pAMA1167-NDM-5), IncFII(pRSB107), IncFII(pSE11), IncFII(pSFO), pSL483, and pXuzhou21. Strain 33 contains plasmids IncC, IncFII(p96A), and pSL483.
Transmission electron microscopy of tigecycline-loaded chitosan/dextran sulfate nanocapsules
The size and morphology of the produced nanoparticles were assessed using TEM (Fig. 2). The blank nano-chitosan/dextran sulfate (Fig. 2A) exhibits a semi-spherical shape with a nodal structure and an average size of 50 to 80 nm. The TGC-loaded CD nanocapsules have a spherical morphology with an average size ranging from 34 to 75 nm (Fig. 2B).
Fig. 2A: Chitosan dextran sulfate nanoparticles and B: tigecycline-encapsulated chitosan dextran sulfate nanoparticles.
Particle size distribution, polydispersity index, and zeta potential
Particle size was assessed using dynamic light scattering (DLS), which measures the Brownian motion of nanoparticles. Figure 3A and B show the average particle sizes of chitosan/dextran sulfate nanoparticles: 129.4 nm with TGC and 144 nm without. Figure 3 also displays the zeta potential of the synthesized nanoparticles. Upon TGC encapsulation, the zeta potential changed. The zeta potential was 49.4 mV for nanoparticles with TGC and 51.3 mV for nanoparticles without TGC. These values indicate highly stable chitosan/dextran sulfate nanoparticles.
Fig. 3. Zeta potential and particle size of chitosan dextran sulfate nanoparticles encapsulated tigecycline and unloaded chitosan dextran sulfate nanoparticles (A). Mean particle size was 129.4 with tigecycline (A) and 144.4 without drug tigecycline (B).
X-ray diffraction (XRD)
Figure 4 shows the XRD patterns of chitosan/dextran sulfate nanoparticles with and without tigecycline. The XRD pattern of the drug-loaded nanoparticles shows a new sharp peak at 2θ: 29.39 Ǻ, which is consistent with the presence of tigecycline. The chitosan/dextran sulfate nanoparticles (without drug) exhibit characteristic diffraction peaks (Fig. 4). The reduced intensity of these peaks in the TGC-loaded sample suggests an interaction between the TGC and the nanoparticle matrix. The absence of additional peaks indicates the relative purity of the nanoparticles.
Fig. 4X-ray diffraction (XRD) of chitosan nanoparticles without drug and chitosan nanoparticles with tigycyclin.
Kinetic release of tigecycline from chitosan dextran sulphate nano-capsule
Table 4; Fig. 5 summarize the in vitro release profile of nano-encapsulated TGC in PBS (pH 7.4), simulating physiological conditions, over 36 h. A small but noticeable initial burst release of TGC was observed within the first 2 h, reaching 0.462 mg (representing 77% of the total loaded drug). This burst likely represents drug adsorbed on or near the surface of the nanocarriers. After this initial phase, the release rate significantly decelerated, with 100% of the drug being released by 8 h. The complete release of the encapsulated drug within this timeframe suggests that the nanocapsules remained intact and fully discharged their payload under these conditions.
Table 4. Stability and kinetic release profile of tigecycline from chitosan dextran sulphate nano-capsule.TimeConcentrationCumulative release (mg)Tigecycline release %30 min.0.0030.0900.151 h.0.0090.2730.462 h.0.0150.4620.774 h.0.0150.4770.808 h.0.0180.5820.9712 h.0.0180.60010024 h0.0180.61810336 h.0.0180.636106
Fig. 5. Release profile of tigecycline from chitosan dextran sulphate nano-encapsulation in phosphate-buffered saline solution at pH 7.4.
Tigecycline loading capacity and efficiency
After encapsulation, the concentration of tigecycline in the supernatant was analyzed by UV-Vis spectroscopy to determine the amount of unencapsulated drug, which was found to be 0.0042 mg. The total amount of loaded drug was 15.9958 mg, resulting in a Drug Loading Efficiency (DLE) of approximately 99.97%. These results demonstrate a highly efficient encapsulation of tigecycline, particularly highlighting the effectiveness of the formulation utilizing chitosan and dextran sulfate.
Drug release kinetics analysis
Different kinetic models, including zero-order, first-order, Higuchi, and Korsmeyer–Peppas, were applied to analyze the in vitro release profile of the TGC-loaded CD NPs. The Korsmeyer–Peppas model showed the best fit to the TGC release data, particularly for the early phase of release (up to 2 h) with a correlation coefficient (R2 = 0.9574). The calculated release exponent (n) was 1.161, which indicates a Super Case II transport mechanism (polymer relaxation–controlled release) (Table 5). This suggests that the release process is primarily controlled by polymer matrix relaxation and erosion, rather than by diffusion alone. This profile is characteristic of crosslinked or highly swollen polymeric systems, underscoring the significant influence of the chitosan-dextran sulfate matrix on the drug release kinetics over time.
Table 5. Analysis of tigecycline kinetics release.ModelR2R^2R2 (Goodness of Fit)Zero-order0.3563First-order0.2586Higuchi0.5421Korsmeyer–Peppas0.9574
The Higuchi model showed a moderate fit, indicating that diffusion might be a contributing factor over time. Conversely, the Zero- and First-order models exhibited poor fits, suggesting that the release is not simply concentration-dependent or governed by a constant rate.
Safety of TGC-loaded nano-encapsulation
To assess the biocompatibility of CD-TGC nanocapsules, a cytotoxicity assay was conducted on the BJ normal human fibroblast cell line using both TGC-loaded and blank (unloaded) chitosan-dextran sulfate nanocapsules. The results showed that the TGC-loaded nanocapsules exhibited low cytotoxicity, with 12.60% cell inhibition at 100 ppm. In contrast, the blank nanocapsules demonstrated a -25.79% cytotoxicity, indicating enhanced cell proliferation. DMSO, used as a vehicle control, showed mild cytotoxicity (5%), while the negative control showed no cytotoxic effect (0%). Due to the minimal observed cytotoxicity, no IC₅₀ or IC₉₀ values could be determined.
MIC values of TGC-loaded CD NPs
Table 2 shows the MIC values of TGC and CD-TGC against Salmonella enterica strains. CD-TGC was more effective, with MICs of 0.5–1 µg/mL. TGC showed limited antibacterial activities, with high MIC values ranging from 32 to 128 µg / mL. CD-TGC decreased MIC 7-fold, from 128 to 1 µg/mL, in one S. Typhimurium strain. In the other 11 strains, CD-TGC reduced the TGC MIC 6-fold, from 64 to 1 µg/mL (n = 6) and from 32 to 0.5 µg/mL (n = 5).
Time-kill kinetics
With an initial inoculum of 8 × 10^6^ CFU/mL, the colony count in CD-TGC treatment significantly decreased to 4.23 CFU/mL at 48 h (p = 0.001) (Fig. 6A). At a lower initial inoculum of 8 × 10^4^ CFU/mL, the bacterial count decreased to 4.11 CFU/mL (Fig. 6B), indicating a strong antibacterial effect of CD-TGC.
Fig. 6. Time-kill curves of S. Typhimurium strain with two inoculums of 8 × \documentclass[12pt]{minimal} \usepackage{amsmath} \usepackage{wasysym} \usepackage{amsfonts} \usepackage{amssymb} \usepackage{amsbsy} \usepackage{mathrsfs} \usepackage{upgreek} \setlength{\oddsidemargin}{-69pt} \begin{document}$$\:{10}^{6}$$\end{document} CFU/ml (A) and 8 × \documentclass[12pt]{minimal} \usepackage{amsmath} \usepackage{wasysym} \usepackage{amsfonts} \usepackage{amssymb} \usepackage{amsbsy} \usepackage{mathrsfs} \usepackage{upgreek} \setlength{\oddsidemargin}{-69pt} \begin{document}$$\:{10}^{4}$$\end{document} CFU/ml (B) incubated with 2 µg/mL tigecycline (TGC) and 2 µg/mL tigecycline-loaded chitosan-dextran sulfate (CD-TGC) nanocapsule.
Tigecycline–loaded Chitosan dextran sulfate nanocapsules downregulate efflux pump genes
The CD-TGC treated strains showed significant downregulation of ramA, with fold changes of 2.04 in strain 1, 1.52 in strain 2, and 4.19 in strain 3. Similarly, acrB expression was reduced by 3.43-fold in strain 1, 2.28-fold in strain 2, and 5.46-fold in strain 3 compared to untreated strains (p < 0.05). Significant differences in the expression of these two genes were detected between the CD-TGC-treated and untreated strains, except for the ramA gene in strains 1 and 2 (Fig. 7).
Fig. 7. Relative fold change of ramA and acrB genes in S. Typhimurium (A), S. Magheroftt (B), and S. Bredeney (C) upon treatment with TGC MIC and CD-TGC MIC. The relative mRNA expression level of genes was quantified compared to expression levels in the untreated strains. * p < 0.05; ** p < 0.01 differ significantly with the control according to Student’s t-test.
In vivo efficacy of tigecycline–loaded Chitosan dextran sulfate nanocapsules
Mice in the infected, untreated positive control group exhibited lethargy, loss of appetite, weight loss, and diarrhea (with or without mucus) during the experimental period. All mice in this group died within 8 days of infection (Fig. 8). The CD-TGC treatment group had a 100% survival rate, followed by the unloaded CD NPs group (80%). The TGC treatment group experienced a higher mortality rate, with a 40% survival rate.
Fig. 8. Survival rates of mice (n = 10 in each group) that were infected with S. Typhimurium and treated with TGC, unloaded CD NPs, and CD-TGC.
Effect of different treatments on hemato-biochemical parameters
Compared to the negative control group, the positive control group showed significant increases (p < 0.05) in ALT, AST, ALP, LDH, creatinine, and urea levels, and marked decreases (p < 0.05) in TP and albumin Alb levels. Compared to the untreated control group, all treatments (TGC, unloaded CD NPs, and CD-TGC) significantly decreased (p < 0.05) serum levels of ALT, AST, ALP, LDH, creatinine, and urea in S. Typhimurium-infected mice. However, CD-TGC treatment resulted in the most substantial reductions (p < 0.05) in these markers, with levels approaching normal ranges. The treatment demonstrated significant effects on TP and Alb, with notable increases observed in the CD-TGC group, followed by the unloaded CD NPs -treated group, and then the TGC group.
The Hb concentration in the positive control group was significantly reduced (p < 0.05) compared to the negative control group. In contrast, Hb levels were substantially increased in all treatment groups, with the highest concentration in CD-TGC, followed by unloaded CD NPs, and TGC. Total leukocyte count (WBCs), lymphocytes, and neutrophils were considerably higher in the positive control group. The CD-TGC-treated group also showed a substantial increase in WBCs, lymphocytes, and neutrophils (Table 6).
Table 6. Effect of different treatments on blood biochemical and hematological attributes of different mice groups.ItemsNCPCTGCUnloaded CD NPsCD-TGCp-valueBlood protein TP g/dl6.97 ± 0.01^a^5.14 ± 0.01^c^6.50 ± 0.01^b^6.57 ± 0.01^ab^6.63 ± 0.01^ab^0.0027 Alb g/dl3.95 ± 0.02^a^3.28 ± 0.04^c^3.65 ± 0.03^b^3.74 ± 0.06^ab^3.83 ± 0.03^ab^0.0013Liver function ALT U/L57.17 ± 1.42^c^74.56 ± 2.18^a^63.39 ± 2.30^b^60.11 ± 1.79^b^58.80 ± 2.44^b^0.0001 AST U/L172.16 ± 4.83^b^208.73 ± 6.13^a^187.62 ± 5.69^c^184.36 ± 5.57^c^180.06 ± 6.83^bc^0.0008 ALP U/L111.3 8 ± 1.55^c^147.12 ± 4.66^a^123.13 ± 3.67^b^118.67 ± 2.76^b^113.13 ± 3.25^bc^0.0001 LDH U/L373.16 ± 2.53^c^395.62 ± 5.41^a^391.56 ± 4.32^ab^385.07 ± 2.63^ab^382.67 ± 5.62^bc^0.0047 Total bilirunin0.18 ± 0.01^c^0.38 ± 0.04^a^0.22 ± 0.01^b^0.20 ± 0.01^bc^0.19 ± 0.00^c^0.0013Kidney function Creatinine mg/dL0.81 ± 0.01^cd^0.87 ± 0.01^a^0.86 ± 0.01^ab^0.85 ± 0.01^bc^0.80 ± 0.01^d^0.0001 Urea mg/dL34.18 ± 1.93^bc^47.86 ± 1.44^a^38.56 ± 0.63^b^37.78 ± 0.87^bc^33.99 ± 1.25^c^<0.0001 Uric acid mg /dl3.62 ± 0.07^c^5.63 ± 0.14^a^5.37 ± 0.01^a^4.40 ± 0.08^b^3.82 ± 0.15^c^<0.0001Hematological attributes Hb g/dl14.69 ± 0.30^a^12.83 ± 0.17^c^14.00 ± 0.08^b^14.18 ± 0.29^ab^14.51 ± 0.22^ab^<0.0001 WBCs (10^3^/µl)9.18 ± 0.37^cd^12.06 ± 0.31^a^10.69 ± 0.32^b^10.14 ± 0.16^bc^8.56 ± 0.35^d^0.0001 Neutrophil %25.33 ± 1.45^c^38.67 ± 0.88^a^32.83 ± 0.73^b^31.67 ± 0.88^b^23.00 ± 1.15^c^<0.0001 Lymphocytes %62.67 ± 0.88^c^69.67 ± 0.88^a^68.33 ± 0.88^ab^66.00 ± 0.58^b^60.33 ± 0.88^c^<0.0001Data are presented as least square means ± standard errors. ALT, alanine aminotransferase; AST, aspartate aminotransferase; ALP, alkaline phosphatase; LDH, lactate dehydrogenase; TP, total protein; Alb, albumin; Hb, hemoglobin; WBCs, white blood cell counts. ^a, b,c^Means within a row without a common superscript letter differ at p < 0.05.
Effect of tigecycline-loaded chitosan dextran sulfate nanocapsules on S. Typhimurium burden
The presence of Salmonella in the organs of mice was determined by inoculating the organ lysates onto XLD agar media. All treated groups showed significant decreases (p < 0.001) in S. Typhimurium burden in the liver and intestine compared to the positive control group, with the CD-TGC group exhibiting the lowest bacterial burden (Fig. 9).
Fig. 9. Total S. Typhimurium counts in the liver and intestine of mice after four days of treatment with TGC, unloaded CD NPs, and CD-TGC. ** p < 0.001 was calculated by one-way ANOVA.
Effect of different treatments on the histology of the liver and intestine
The H&E-stained sections of the liver tissues of the control-negative group reflected a normal histological structure of hepatic parenchyma (Fig. 10A and B). S. Typhimurium-infected group exhibited multiple areas of variable-sized coagulative necrosis that were randomly distributed within the hepatic parenchyma. Severe sinusoidal dilation and congestion with Kupffer cell hyperplasia were characteristic manifestations of Salmonella hepatitis (Fig. 10C and D). The TGC group revealed moderately sized necrotic areas, moderately dilated and congested sinusoids with moderately hyperplastic Kupffer`s cells beside interstitial mononuclear cell aggregates with fibroblast proliferation. Regenerated hepatocytes with stippling basophilic cytoplasm and pale nuclei reflected the regenerative process (Fig. 10E and F). The unloaded CD NPs group exhibited a few randomly scattered minute necrotic areas with highly mononuclear cell infiltration around the portal areas. Normal hepatic parenchyma was common (Fig. 10G and H). CD-TGC restored normal hepatic histomorphologic features except for a few dilated blood vessels and a few interstitial lymphocytic aggregates. Sometimes, hepatic cells showed minute vacuoles within their cytoplasm (reversible change) (Fig. 10I and J).
Fig. 10TGC and/or unloaded CD NPs ameliorated the S. Typhimurium infected group induced histopathological alterations in mice’s liver tissues. Representative photomicrographs of the H&E-stained hepatic tissue sections showing the control (A), *S.*Typhimurium infected group (C), TGC (E), unloaded CD NPs (G), CD-TGC groups (I) and their respective higher magnifications (B, D, F, H, and J). A, B: control group displaying normal central vein (CV), hepatic cords (HC) with hepatocytes of eosinophilic granular cytoplasm (EC), rounded central single (SN) or double vesicular nuclei (DN), and kupffer cells (KC). C, D: S. Typhimurium infected group demonstrating multiple areas of variable-sized necrotic areas (NA) of coagulative necrosis (CN), severely dilated and congested sinusoid (SDS) with Kupffer cell hyperplasia (KCH). E, F: TGC group displaying moderately sized necrotic areas (MNA), moderately dilated and congested sinusoids (MDS), moderately hyperplastic Kupffer’s cells (MKC), interstitial mononuclear cell infiltration (MI), fibroblast proliferation (FP), and regenerated hepatocytes of stippling basophilic cytoplasm (BC) and pale nuclei (PN). G, H: unloaded CD NPs group showing a few scattered minute necrotic areas (mNA), intense mononuclear cell infiltration (IMI) around the portal area, and apparently normal hepatocytes (NH). I, J: CD-TGC group showed normal hepatocytes (NH), few dilated blood vessels (DBV), and a few interstitial lymphocytic aggregates (FL). Scale bars = 100 μm in A, C, E, G, I; and = 20 μm in B, D, F, H, and J. K: Bar charts demonstrate the statistical analysis of the comparative quantification of the hepatic injury scores in all studied groups. Bars carrying different superscript letters (a, b, c, d, and e) are significantly different as analyzed by the one-way ANOVA test, followed by the multiple comparisons by Duncan’s Post-hoc test (p < 0.05). Values are the mean of 6 mice per group ± S.E.M.
Semiquantitative assessment showed that hepatic injury scores were significantly higher (p < 0.05) in the S. Typhimurium-infected (control positive) group (2.78 ± 0.03) compared to the control negative group (0.11 ± 0.07). Treatment with CD-TGC, TGC, or unloaded CD NPs significantly reduced (p < 0.05) hepatic injury scores relative to the positive control group. Among these, CD-TGC 0.44 ± 0.001) was the most effective, outperforming TGC (1.89 ± 0.01) and unloaded CD NPs (1.5 ± 0.01) (Fig. 10K; Table 7). The villi were mucosal projections of simple columnar absorptive epithelium with interspersed goblet cells. The intestinal glands (crypts of Lieberkühn) were found between the bases of the villi and the lamina muscularis mucosa (Fig. 11A). However, S. Typhimurium-infected group showed necrosis of some villi with mucus stuck in intervillus spaces. Besides, a few cystic intestinal glands were bulged and contained eosinophilic debris. The submucosal edema was also detected (Fig. 11B).
Table 7. Hepatic and intestinal lesion scoring among experimental groups infected with S. Typhimurium.ParameterGroupHepatic injury scoreIntestinal injury scoreControl0.11 ± 0.070.11 ± 0.07S. Typhimurium infected group2.78 ± 0.032.89 ± 0.07TGC1.89 ± 0.012 ± 0.12Unloaded CD NPs1.5 ± 0.011.67 ± 0.12CD-TGC0.44 ± 0.0010.56 ± 0.07
Fig. 11TGC and/or unloaded CD NPs ameliorated the S. Typhimurium infected group induced histopathological alterations in mice’s small intestines. Representative photomicrographs of the H&E-stained intestinal tissue sections showing the control (A), S. Typhimurium infected group (B), TGC (C), unloaded CD NPs (D), and CD-TGC groups (E). A: control group displaying normal intestinal mucosa (M) of simple columnar absorptive epithelium (SCE) with interspersed goblet cells (G) covering villi, intestinal glands (IG), and submucosa (SM), muscularis (ML). B: S. Typhimurium infected group demonstrating villus necrosis (VN), intervillous stuck mucous (IM), cystic intestinal glands (CG) containing eosinophilic debris (ED), and submucosal edema (SE). C: TGC group displaying moderate necrosis of villus (MNV) with moderately intervillus-stuck mucous (MIM), moderately submucosal edema (MSE), and depleted lymphoid follicles (DLF). D: Unloaded CD NPs group shows regenerated intestinal villi (RV), glands (RG), and mild submucosal edema (mSE). E: CD-TGC group showing normal villi (NV), overcrowded proliferative intestinal glands (PIG), and well-defined submucosal lymphoid follicles (LF). Scale bars in A, B, C, D, and E = 50 μm. F: Bar charts demonstrate the statistical analysis of the comparative quantification of the intestinal injury scores in all studied groups. Bars with distinct superscript letters (a, b, c, d, and e) exhibit significant differences, as determined by the one-way ANOVA test, followed by Duncan’s Post-hoc multiple comparisons (p < 0.05). The values represent the mean of six mice per group ± S.E.M.
The TGC group revealed moderately necrotic areas in some villi with moderately stuck mucus in intervillous spaces. The submucosa exhibited depletion of some lymphoid follicles and moderate edema (Fig. 11C). In the unloaded CD NPs group, the small intestine revealed normal intestinal mucosa with regenerated intestinal glands and mild submucosal edema (Fig. 11D). The CD-TGC group exhibited normal intestinal villi and overcrowded proliferative intestinal glands. The well-defined submucosal lymphoid follicles were also noticed (Fig. 11E). Semiquantitative assessment of intestinal injury scores significantly increased (p < 0.05) in the infected control group (2.89 ± 0.07) compared to the uninfected control group (0.11 ± 0.07). CD-TGC, TGC, and unloaded CD NPs all significantly reduced (p < 0.05) these scores compared to the infected control. CD-TGC significantly reduced intestinal injury scores (0.56 ± 0.07) compared to either TGC (2 ± 0.12) or unloaded CD NPs (1.67 ± 0.12) (Fig. 11F).
Discussion
Salmonella is one of the primary zoonotic pathogens included in foodborne epidemics worldwide. S. Typhimurium is one of the most recurrent and virulent serovars, representing a considerable global danger to food safety and public health, attributed to the rise of MDR bacteria^48^. As a rare human pathogen linked to sporadic outbreaks, S. enterica serotype Bredeney is well known for being isolated from poultry, other animals, and the environment^49^. It has emerged as the third most prevalent serotype in recent years among isolates from human infections that were sent to Ireland’s National Salmonella Reference Laboratory for diagnosis. Currently, 87% of S. enterica serotype Bredeney isolates from non-human sources and from unrelated human illnesses in Ireland belong to a closely linked group, as established by DNA amplification fingerprinting and pulsed field gel electrophoresis^50^.
Salmonella acquires multidrug resistance via efflux pumps that expel antibiotics from bacterial cells, thereby reducing their concentration to non-toxic levels and inactivating them through bacterial enzymes that modify or degrade their structure^51^. The efflux pumps in bacteria facilitate the expulsion of drugs from cells and are also implicated in bacterial stress response, pathogenicity, biofilm formation, and modification of host physiology^52^. Efflux pumps in Salmonella are essential for mitigating the adverse effects of bile salts and host defense mechanisms^53^. The detected efflux pump genes conferring antibiotic resistance in S. Bredeney strains are AcrAB-TolC,* AcrAD-TolC*,* AcrEF-TolC*,* AcrZ*,* EmrAB-TolC*,* EmrD*,* FloR* family, MacA,* MacB*,* MdfA/Cmr*,* MdtABC-TolC*,* MdtL*,* MdtM*,* MexPQ-OpmE*,* OprM/OprM* family, SugE,* Tet(B), and TolC/OpmH. In Salmonella, the resistance-nodulation-division (RND) proteins are situated in the inner membrane. The outer membrane channel, aided by other proteins, is integral to the drug efflux system, in conjunction with the tripartite system (AcrAB-ToIC). It transports substrates such as antibiotics, dyes, detergents, and host metabolites. The absence of RND protein components renders Salmonella susceptible to antibiotics, but the overexpression of these genes leads to multidrug resistance^54^. Consequently, research on these proteins is becoming increasingly significant in combating multidrug resistance and reducing the pathogenicity of Salmonella^55^. RamA overexpression is crucial for acrAB overexpression and promotes efflux-mediated co-resistance to CIP/TGC without prior exposure to TGC^8^. TGC is the ultimate broad-spectrum drug for the treatment of Salmonella infections^56^. Mechanisms encoded by chromosomes or accessory genes contribute to TGC resistance. The horizontal transfer of mobile genetic elements carrying multiple resistance genes may cause the Tet proteins (e.g., Tet(X), Tet(A), Tet(K), and Tet(M)) to acquire mutations that result in a decreased susceptibility (i.e., increased MICs) to TGC^57^. Gram-negative bacteria’s resistance to tigecycline is largely due to chromosomally encoded overexpression of resistance-nodulation division (RND) efflux pumps, including AdeABC, AdeFGH*,* AdeIJK*,* MexXY*, and AcrAB^52^.
NPs drug delivery Innovative systems are being investigated to address the problems associated with drug use, which include inadequate biodistribution, restricted efficacy, adverse side effects, and insufficient selectivity^58^. It can surmount these restrictions by delivering the drug to the site of action, while safeguarding against fast degradation or clearance. It also increases drug concentration in target tissues, hence allowing for lower doses to mitigate hazardous side effects^59^. There is increased interest in natural-based NPs with antibacterial activities concurrently with antibiotic treatment, as the dose of antibiotics can be reduced and the undesirable effects of drugs can be further minimized^55^. Although previous studies reported that CH has antimicrobial activity^60^. However, it can’t overcome intracellular S. Typhimurium infection^61^. So, it must combine with another carbohydrate polymer, DS, to deliver the conjugated drug into the intracellular Salmonella^62^.
Our study points to reviving TGC activity to combat MDR Salmonella using natural CD capsules to overcome intracellular Salmonella infection. To our knowledge, no data have been published on using CD-TGC as an antimicrobial agent against MDR Salmonella enterica strains. We used TEM to characterize the nanoparticles, which showed CD-TGC, a semi-spherical shape, and a slight increase in size. The appearance of some aggregations in the nanoparticles may refer to the relatively larger size and hydrogen bonding between the particles^63^. It stimulates the release of the encapsulated compound, so it should be centrifuged immediately after nanoparticle synthesis or up to 30 min. at 5000 rpm. The dynamic light scattering (DLS) evaluates the particle size for the solution of the NPs. This remark can be correlated to delivering an image for a definite area for measurement via TEM, whereas DLS gives an overall observation of the nanoparticles and their agglomeration. In addition, DLS measurement provides a hydrodynamic radius of nanoparticles (hydrated and swollen particles) in aqueous solution. On the other hand, TEM provides the diameter of dried nanoparticles. Zeta potential reveals the positive charge of the synthesized CD NPs due to the cationic nature of the amine groups in the protonated form, resulting from the acidic solvent medium for chitosan^64^. It indicates highly stable nanoparticles of chitosan/dextran sulphate. The XRD analysis showed that pure chitosan has a high degree of crystallinity, defined by distinct peaks at (2θ) of 20 and 10 degrees, corresponding to the crystallographic planes (110) and (020), respectively, which pertain to the non-deacetylated component of chitosan (chitin)^65^. The crystallinity of nano chitosan significantly diminished due to cross-linking with dextran sulfate during the synthesis of chitosan nanoparticles, signifying the amorphous characteristics of these nanoparticles^66^. Chitosan nanoparticles exhibited a prominent diffraction peak at 2θ values of 20.48 Å, characteristic of chitosan nanoparticles^67^. CD-TGC resulted in a lower MIC and caused the downregulation of efflux pump genes ramA and acrB. Similarly, Wang et al.^68^ employed D-alpha tocopheryl polyethylene glycol succinate-modified and S-thanatin peptide-functionalized nanorods derived from calcium phosphate nanoparticles to deliver TGC for treating pneumonia induced by TGC-resistant Klebsiella pneumoniae, resulting in the downregulation of acrA, acrB, and ramA efflux pump genes.
Moreover, Elbi et al..^61^ examined CIP-loaded chitosan nanoparticles (cCNPs) and fucoidan-coated cCNPs (Fu-cCNPs) in their efficacy against Salmonella Paratyphi A. The intercellular anti-Salmonella efficacy of Fu-cCNPs was twofold greater than cCNPs and sixfold greater than CIP alone. Nevertheless, they did not examine the expression of efflux pump genes. Another study used the antipsychotic medications chlorpromazine and amitriptyline as inhibitors of the AcrB transporter, a crucial component of the prominent RND efflux pumps in S. Typhimurium by interfering with substrate binding^69^.
Nonetheless, the anti-efflux properties of chemical agents like carbonyl cyanide 3-chlorophenylhydrazone (CCCP), an efflux pump inhibitor, against CIP- and TGC-resistant Salmonella isolates led to a substantial decrease in their MIC values and reinstated their susceptibility to CIP and TGC^8^. Moreover, Razavi et al.^70^ reported a decrease in CIP and TGC MICs following the use of the CCCP EPI. In contrast to these studies, we used natural CD nanocapsules for drug delivery, which are safe and eco-friendly.
The time-kill study indicates that the CD-TGC has a rapid killing activity and exhibits robust and efficient antimicrobial effects, leading to a pronounced reduction in bacterial colony counts at both high and low inoculum levels. The CD-TGC proved efficacious in treating infections caused by S. Typhimurium in mice models. This was evident through the high survival rate (100%) compared to the TGC group (40%). Also, S. Typhimurium burden in organs decreased as there was a substantial reduction (P < 0.05) in the colony count in both unloaded CD NPs and CD-TGC treated groups in both liver (3.6 and 2.6 log10) and intestine samples (3.7 and 2.7 log10) compared to the positive control which was 4.8 log10 in liver and intestine samples.
Concerning liver and kidney functions, S. Typhimurium-infected mice showed increases in ALT, ALP, AST, creatinine, urea, LDH, Uric acid, total bilirubin, TP, and Alb. Albumin and TP were markedly reduced in the group receiving TGC than the positive control and improved significantly in both unloaded CD NPs and CD-TGC treated groups (p < 0.05). The activities of ALT and LDH were markedly lower in the group treated by CD-TGC compared to the positive control. The levels of sera creatinine, urea, and uric acid levels were markedly reduced in all treated groups relative to the positive control (p < 0.05), minimizing in the CD-TGC group. This indicates the stressful effects of Salmonella infection on hepatic and renal tissues. The impairment of the functions of these organs was also reported by Seo et al.^71^ who recorded significant elevations of AST and LDH. Additionally, the elevation of liver enzyme ALT and reduction in albumin is corroborated by prior research, which indicated that Salmonella spp. infection leads to hepatic granulomas or paratyphoid nodules, resulting in the release of liver enzymes into the serum and diminishing the liver’s capacity to synthesize albumin^72^. Treatment of S. Typhimurium-infected mice with unloaded CD NPs or CD-TGC protected the liver and kidney from the stressful effects of Salmonella. These results may have been due to the antimicrobial and hepatoprotective effects of chitosan nanoparticles, exhibiting antioxidant and anti-inflammatory properties^73^. Regarding hematological findings, the levels of blood Hb were markedly decreased in the positive control group, while it was significantly higher in CD-TGC, unloaded CD NPs, and TGC groups. The WBC counts, as well as the ratios of neutrophils and lymphocytes, significantly decreased (p < 0.05) in all treated groups compared to the positive control. S. Typhimurium infection markedly reduced the average amount of hemoglobin due to the declined bone marrow activity and hemophagocytosis^74,75^. Moreover, the significant difference in the elevated neutrophil counts between the untreated and treated groups could be explained by the role of neutrophils in combating salmonellosis^76^. A robust inflammatory stimulus elicits heightened neutrophil production, resulting in left-shift neutrophilia due to the release of neutrophils into circulation^77^. Mice are considered an excellent model for studying the pathogenesis and histological alterations of Salmonella spp., and S. Typhimurium exhibited evidence of histological damage^78^. As previously reported, the pathological changes caused by Salmonella infection are primarily inflammatory in the liver and include congestion, edema, and inflammatory cell infiltrations^79^. The intestinal necrotic alterations are consistent with Lee et al..^80^ The results of this investigation demonstrated a significant reduction in the intensity of the inflammatory response in the groups treated with unloaded CD NPs and CD-TGC. This result is explained by the antibacterial properties of TGC and the anti-inflammatory properties of chitosan NPs^81^, which diminish the intensity of inflammation brought on by salmonellosis. Overall, the vivo study demonstrated the safety and effectiveness of CD-TGC in treating MDR Salmonella infections, allowing it to be used as a substitute antimicrobial, particularly in cases of bacterial infections that are resistant to antibiotics.
Conclusions
This study focused on MDR non-typhoidal Salmonella enterica species against which TGC demonstrated limited efficacy. This is the first demonstration of anti-efflux and gene-downregulating effects of CD-TGC nanocapsules on MDR Salmonella enterica. Our findings demonstrate that CD-TGC nanocapsules serve as an effective drug delivery system for treating intracellular Salmonella infections. This approach has the potential to mitigate the development of antimicrobial resistance. CD-TGC demonstrated superior treatment outcomes against Salmonellosis, with a 100% survival rate in treated mice compared to 40% for TGC. This highlights its potential in combating the infection. Further research is warranted to explore the potential of drug-loaded CD nanocapsules for treating infections caused by other pathogens.
Supplementary Information
Below is the link to the electronic supplementary material.
Supplementary Material 1
The reference list from the paper itself. Each links out to its DOI / PubMed record.
- 1Castro-Vargas, R. E., Herrera-Sánchez, M. P., Rodríguez-Hernández, R. & Rondón-Barragán I.S. Antibiotic resistance in Salmonella spp. Isolated from poultry: a global overview. Vet. World 13, 2070–2084 (2020).10.14202/vetworld.2020.2070-2084 PMC 770430933281339 · doi ↗ · pubmed ↗
- 2Devnarain, N. et al. Intrinsic stimuli-responsive nanocarriers for smart drug delivery of antibacterial agents—an in‐depth review of the last two decades. WIR Es Nanomed. Nanobio.2020, 13 (2020).10.1002/wnan.166432808486 · doi ↗ · pubmed ↗
- 3Sahoo, D. et al. Theory and Applications of Nonparenteral Nanomedicines 181–207 (Elsevier, 2021).
- 4Kauffmann, F. & Edwards, P. R. A. Revised Simplified Kauffmann-White schema. Acta Pathol. Microbiol. Scand.41, 242–246 (1957).10.1111/j.1699-0463.1957.tb 01021.x 13469401 · doi ↗ · pubmed ↗
- 5Clinical Laboratory Standards Institute (CLSI). Performance Standard for Antimicrobial Susceptibility Testing: Nineteenth Informational Supplement M 100 (CLSI, 2024).
- 6Pfizer Inc., Pfizer Ireland Pharmaceuticals, Warner-Lambert Company, Warner-Lambert Company, LLC, and Warner-Lambert Export, Ltd., v. Ranbaxy Laboratories Limited and Ranbaxy Pharmaceuticals Inc. (06-1179). Biotechnol. Law Rep.25, 648–654 (2006).
- 7Bancroft, J. D. et al. in Bancroft’s Theory and Practice of Histological Techniques ix-x (Elsevier, 2019).
- 8Bulsara, M. K. et al. Analysis of clinical trials using SAS: a practical guide. Stat. Methods Med. Res.16, 375–376 (2005).