Bayesian spatiotemporal evaluation of bovine anaplasmosis seroprevalence in Missouri (2010–2021)
Ram K. Raghavan, Rosalie Ierardi, Frank Badu Osei, Shuping Zhang

TL;DR
This study uses Bayesian models to analyze the spread of bovine anaplasmosis in Missouri from 2010 to 2021, identifying high-risk areas and potential drivers of the disease.
Contribution
The study introduces a novel Bayesian hierarchical framework to model spatiotemporal patterns of bovine anaplasmosis seroprevalence.
Findings
Model-3, using space-time interaction effects, best explained variability in anaplasmosis case counts.
Bovine anaplasmosis seroprevalence in Missouri is non-uniform and influenced by local and regional factors.
Environmental and management factors likely drive disease distribution and risk.
Abstract
Bovine anaplasmosis, caused by the rickettsia Anaplasma marginale, is an economically important and globally distributed tick- and blood-borne disease of cattle. Although cases are known to be widespread in Missouri, current spatiotemporal trends, presence of high-risk areas, and any potential drivers for disease trends in Missouri are poorly documented. To address these knowledge gaps, this study analyzed spatiotemporal patterns of annual, county-level anaplasmosis case counts using a Bayesian hierarchical framework. Seropositive cases of anaplasmosis detected at the University of Missouri Veterinary Medical Diagnostic Laboratory (n = 1,944) between the years 2010–2021 were used to construct data-driven Bayesian hierarchical models. All the models consisted of imputation sub-models to alleviate issues related to missing observations from spatiotemporal units (114 counties and 1…
Genes, proteins, chemicals, diseases, species, mutations and cell lines named across the full text — each resolved to its canonical identifier and authoritative record.
Click any figure to enlarge with its caption.
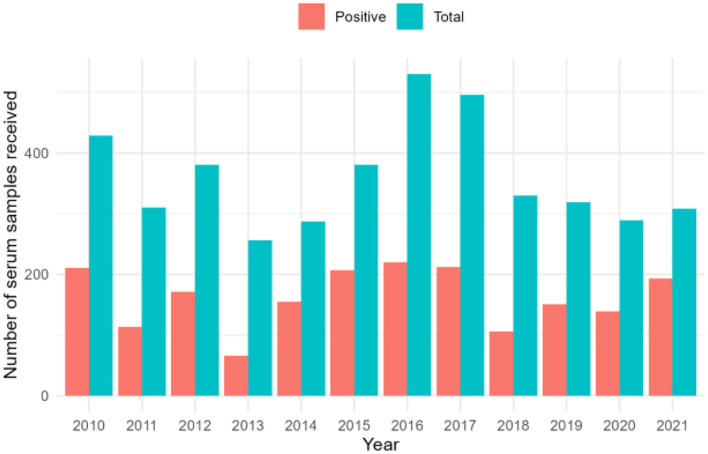 Figure 1
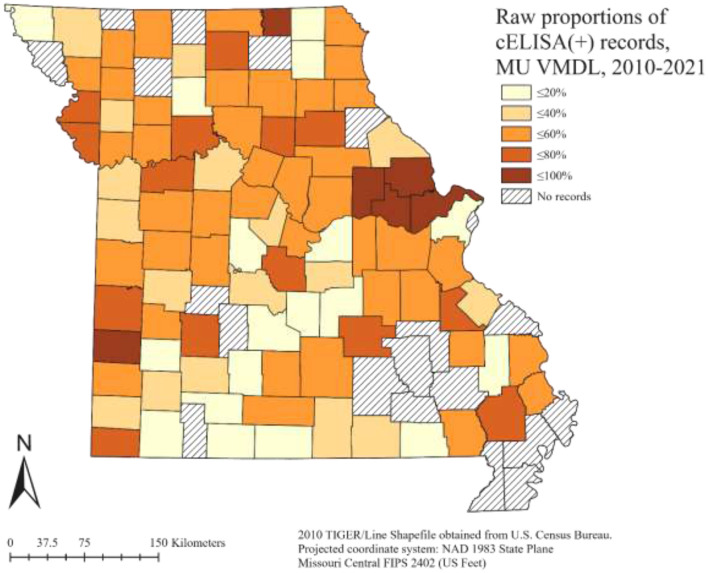 Figure 2
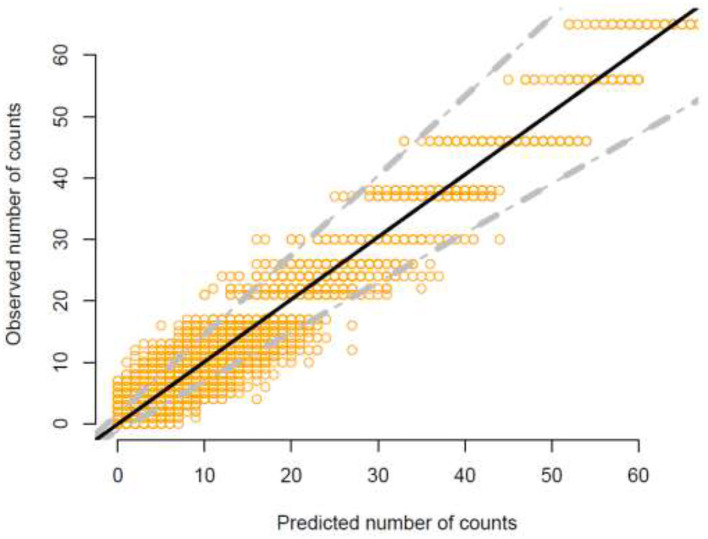 Figure 3
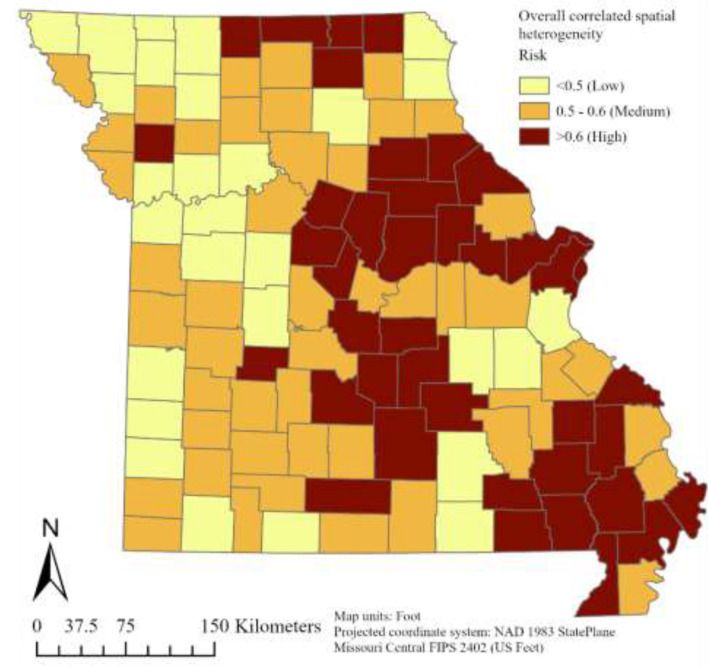 Figure 4
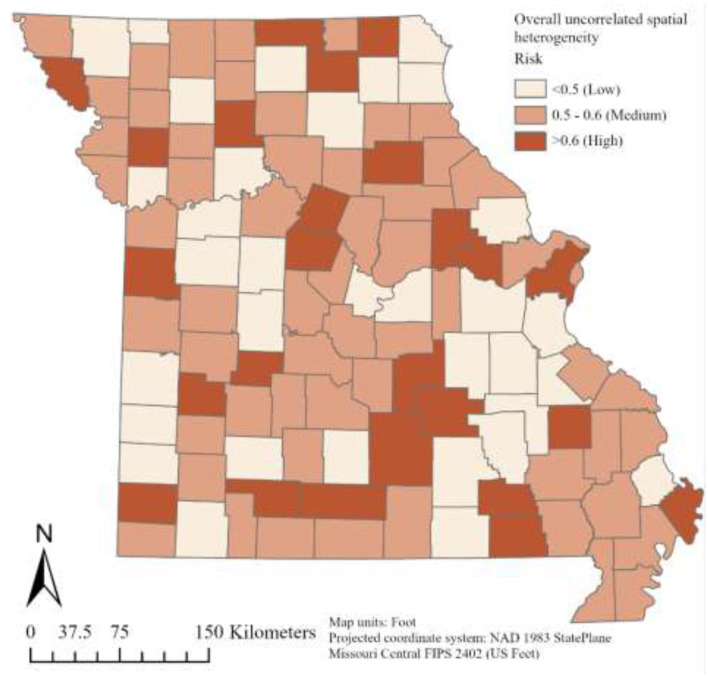 Figure 5
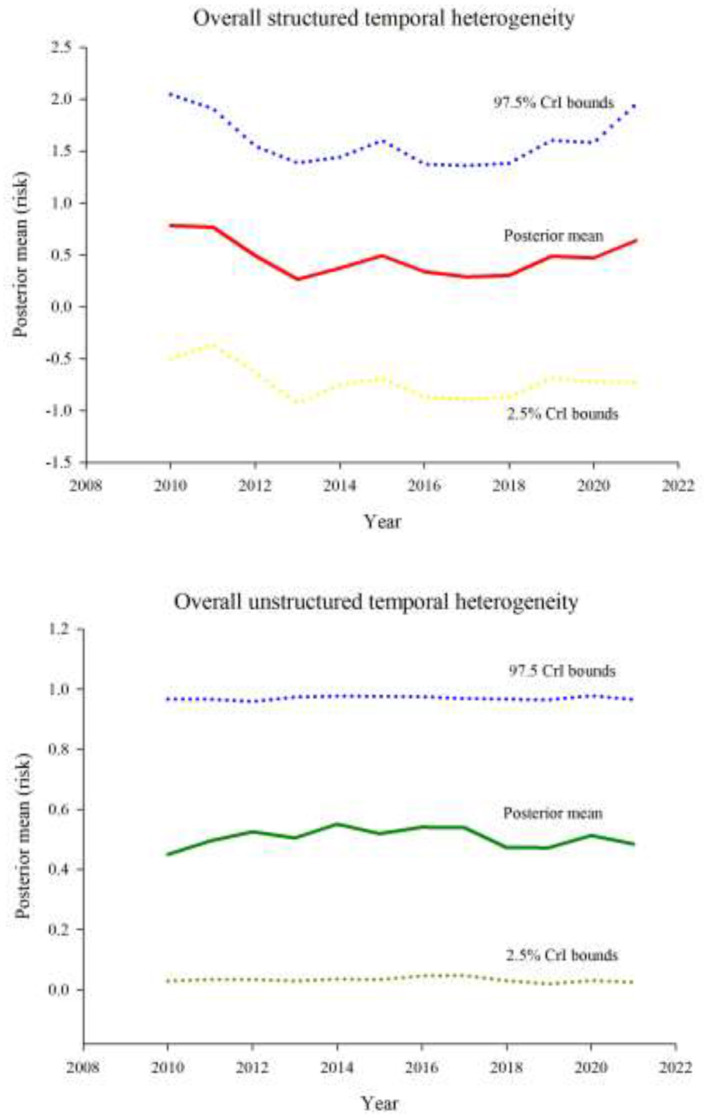 Figure 6
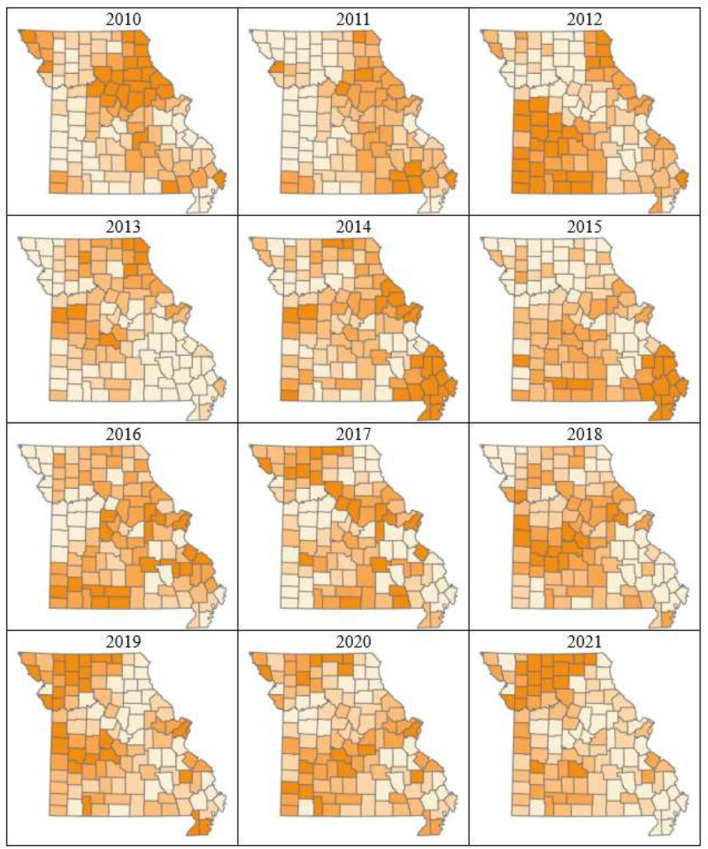 Figure 7
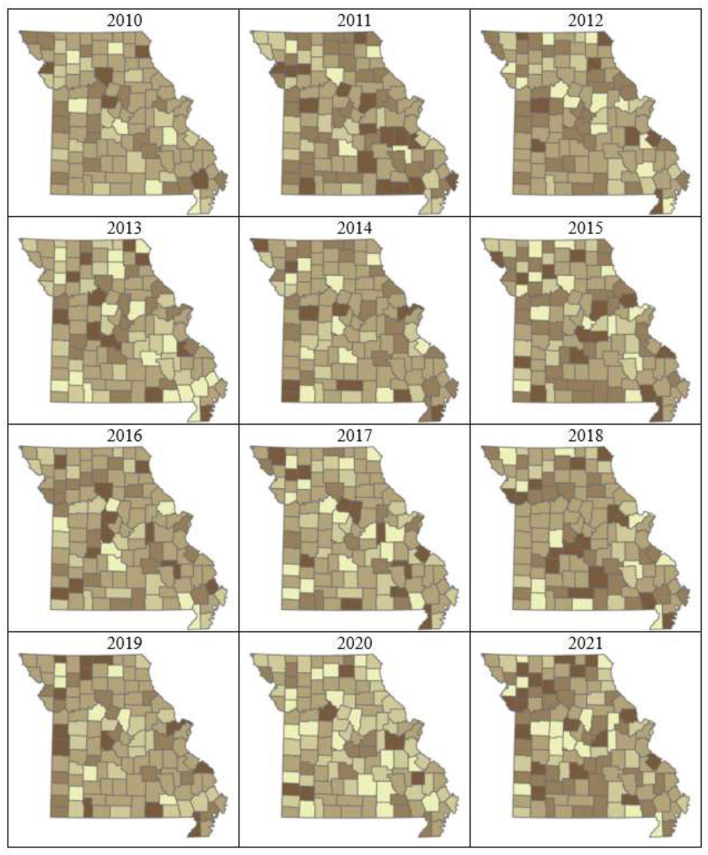 Figure 8
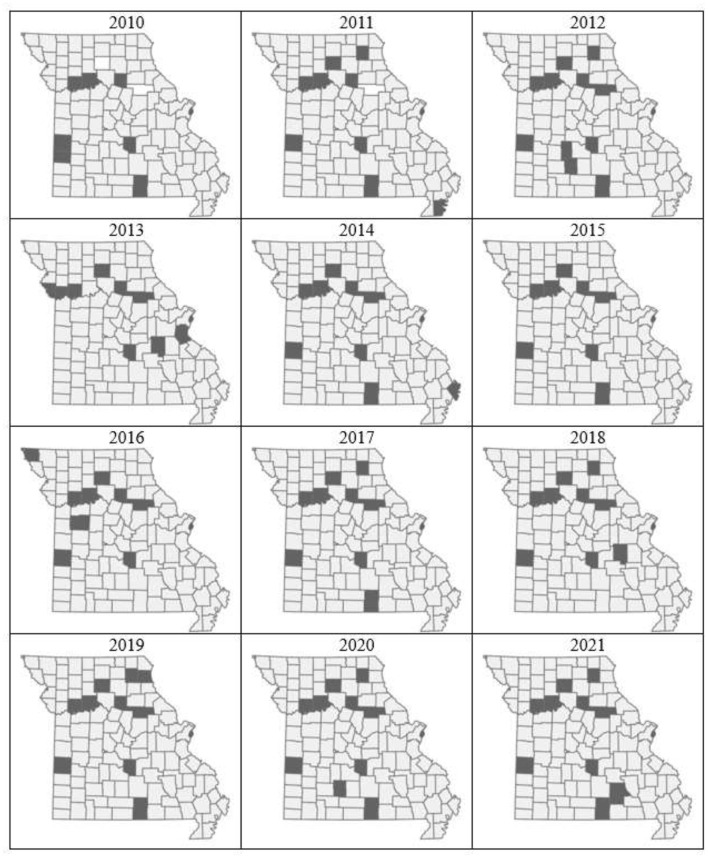 Figure 9
|
|
|
|
|
|
|
|
|
|
|
|---|---|---|---|---|---|---|---|---|---|
| 2010 | 488 | 30 | 10 | 0 | 0 | 0 | 448 | 429 | 429 |
| 2011 | 519 | 10 | 3 | 1 | 0 | 0 | 505 | 355 | 310 |
| 2012 | 419 | 8 | 9 | 0 | 0 | 0 | 402 | 382 | 381 |
| 2013 | 290 | 4 | 5 | 0 | 0 | 0 | 281 | 261 | 256 |
| 2014 | 398 | 12 | 7 | 1 | 0 | 0 | 378 | 287 | 287 |
| 2015 | 459 | 6 | 16 | 2 | 0 | 0 | 435 | 381 | 381 |
| 2016 | 653 | 24 | 15 | 0 | 0 | 4 | 610 | 533 | 530 |
| 2017 | 588 | 7 | 2 | 0 | 0 | 2 | 577 | 496 | 496 |
| 2018 | 520 | 14 | 1 | 0 | 0 | 0 | 505 | 330 | 330 |
| 2019 | 567 | 14 | 4 | 4 | 0 | 0 | 545 | 319 | 319 |
| 2020 | 631 | 65 | 0 | 0 | 7 | 2 | 557 | 290 | 289 |
| 2021 | 537 | 8 | 0 | 0 | 0 | 0 | 529 | 309 | 308 |
| Total | 6,069 | 202 | 72 | 8 | 7 | 8 | 5,772 | 4,372 | 4,316 |
|
|
|
|---|---|
| Model-1 | 7,606.694 |
| Model-2 | 5,223.553 |
| Model-3 | 5,171.446 |
Peer Reviews
No public reviews on file for this paper yet. If you reviewed it on a platform where reviews are public (OpenReview, ICLR, NeurIPS, ICML), you can paste yours below so the community can read it here.
Videos
No videos yet. Explain this paper in a talk, walkthrough, or lecture? Add one.
Taxonomy
TopicsVector-borne infectious diseases · Vector-Borne Animal Diseases · Bartonella species infections research
Introduction
1
Bovine anaplasmosis, caused by the rickettsia Anaplasma marginale, is an economically important tick- and blood-borne disease of cattle found worldwide. Its clinical effects of severe anemia, weight loss, spontaneous abortions, and death negatively impact cattle welfare and create a significant economic burden for cattle producers (1). A vaccine that is consistently safe and effective has proved elusive (2). Treatment and control usually depends on administration of oral and/or injectable tetracyclines; however, this approach is not always effective (3) and may be associated with the development of antimicrobial resistance (4). Cattle that survive acute infection are lifelong subclinical carriers of A. marginale and represent a key reservoir of infection for other cattle through tick transmission, inadvertent mechanical transmission via blood-contaminated needles (5) and veterinary instruments, and mechanical transmission via certain biting flies (6, 7).
Evidence suggests that bovine anaplasmosis is becoming more prevalent and more geographically widespread (8–13). Spatiotemporal modeling demonstrated increases of anaplasmosis in Kansas since 2005 (14), where over 50% of beef herds are infected (15). Human tick-borne illnesses follow a similar trend, having increased significantly over the last decade (16), particularly in the midwestern U.S. Concurrently, expansion of the geographic distributions and active seasons of medically important ticks in North America has been well documented (17–20), while human encroachment on tick habitats increases the likelihood of encounters (21).
In the U.S., bovine anaplasmosis is vectored by Dermacentor spp. including the American dog tick (D. variabilis), the Rocky Mountain wood tick (D. andersoni), the winter tick (D. albipictus), and the western dog tick, D. occidentalis (22). Both D. variabilis and D. albipictus are established in Missouri, although D. albipictus preferentially feeds on cervids (23). Distribution of tick-borne diseases, such as bovine anaplasmosis are often concordant with the spatial distribution of their transmitting vectors (17, 24, 25), and are therefore indirectly affected by the natural fluctuations in climate and habitat availability for ticks and their hosts. In the case of bovine anaplasmosis, additional factors that may affect spatiotemporal distribution include management practices (5, 26) and cattle movements leading to comingling of naïve and carrier animals.
Spatiotemporal disease mapping models are a useful tool to describe such disease patterns, more specifically to identify the presence of any clusters of incidences over space, time, or both (27). The presence of such clusters often points to underlying management, environmental, or other factors that could be potentially driving the disease incidence, which can then be targeted for interventions, and resource allocation (28, 29). Making inferences based on crude values of disease incidence over geographic space and time is problematic as the underlying spatiotemporal structure of the data is unaccounted for (27, 30). Bayesian spatiotemporal models provide a robust and flexible platform for space-time analysis of disease incidences and have been utilized to explore the potential effects abiotic covariates such as climate and land cover features in the disease ecology. Such models have been applied to the study of bovine anaplasmosis and other tick-borne diseases (14, 24, 25).
The objective of this study was to evaluate the spatial, temporal, spatiotemporal risk patterns of bovine anaplasmosis in the Midwestern state of Missouri using a Bayesian approach with counts of bovine serum samples that tested positive via competitive ELISA (cELISA) at the University of Missouri Veterinary Medical Diagnostic Laboratory (MU VMDL) between the years 2010–2021.
Materials and methods
2
Disease data
2.1
The VMDL's laboratory information management system, VetView (University of Georgia, Athens USA), was searched using the “Query Builder” tool for all accessions received January 1, 2010 through December 31, 2021 which included the test code for A. marginale competitive ELISA (cELISA). The resulting list of accessions was exported directly from VetView into Microsoft Excel as a .csv file, which included accession number, animal identification, and date of receipt. All case records were reviewed by a single observer (R. Ierardi) and the following items were manually entered into Microsoft Excel: owner's state, county, and city; veterinarian's state, county, and city; animal's age; animal's sex; and, the result of the A. marginale cELISA test (1 = positive, 0 = negative). The VMDL's cutoff for a positive result throughout the study period was ≥30% inhibition, according to the manufacturer's instructions (Anaplasma Antibody Test Kit, cELISA v2; VMRD, Pullman, WA). The data was curated by excluding cases that met specific criteria (e.g., non-tested samples, samples of inappropriate type, etc.), submitted by owners out-of-state, and submitted by veterinarians out-of-state (Table 1).
For each of the 12 years, VetView was queried for samples received January 1 through December 31. A species filter was not applied at the time of the original queries for 2010–2019, and non-bovine samples were removed after data entry was completed. A “Bovine” species filter was applied at the time of the original queries for 2020–2021. For each year, VetView would export a list of accessions as a .csv file, each having a column with the date of receipt and another column with a list of comma-separated sample IDs for each accession. Note that VetView's list of samples for a given accession may include multiple sample types destined for different tests. The sample ID column was split by comma delimiter to rows, thus yielding the total number of individual samples received for each year.
Data curation
2.2
The queried data Version 1 for 2010–2021 contained 6,069 records, which were subsequently reduced to a subset (Version 2) following the removal of sample IDs that were not tested for anaplasmosis, sample IDs that were not from cattle (usually from other ruminants), and other criteria (Table 1). This resulted in the removal of 297 records. Version 2 (5,772 records) was further filtered to retain only records in which the owner's state was listed as Missouri, or the owner's state was not specified, and the veterinarian's state was Missouri, i.e., if the owner's state was not specified and the veterinarian's state was not Missouri, those records were removed. This resulted in the removal of 1,400 out-of-state records for a new total of 4,372 records (Version 3). Finally, observations where the owner's state was listed as Missouri but the veterinarian was from another state (56 records) were removed; in all of these cases, the owner's residence was in a county adjacent to the state line and often in a metropolitan area—particularly St. Louis—and therefore it was doubtful whether the owner's address was a reasonable proxy for the location of the cattle herd. This resulted in a final total of 4,316 records (Version 4) for analysis.
Geographic data
2.3
A 2010 TIGER/Line^®^ shapefile for Missouri counties was downloaded from U.S. Census Bureau (https://www.census.gov/geographies/mapping-files/time-series/geo/tiger-line-file.html). The shapefile included two polygons labeled “St. Louis”; St. Louis County and the independent city of St. Louis, which needed to be distinguished as separate polygons for our analysis. Therefore in RStudio, unique numeric identifiers were assigned to a list of Missouri's alphabetically sorted counties. These numeric county IDs were then appended to the shapefile's attribute table, carefully verifying the county names, and subsequently used as the join field to link with the anaplasmosis dataset using the “Add Join” tool.
Statistical modeling
2.4
A binomial hierarchical mixture model was considered for two reasons. Firstly, the disaggregation of the observed data into a space-time framework leads to many missing data points for both the observed outcomes and the expected seropositivity to bovine anaplasmosis in the population. Secondly, this approach seeks to accommodate imperfect detection of anaplasmosis in the population. Hence, the anaplasmosis counts in the present study are modeled as Binomial random variables. This class of models has proved useful in species population distribution models for estimating uncertainties in local abundance and detection probability (31–33). A joint Bayesian analysis and imputation model was developed with a joint density described as
where the Binomial (positive) outcomes yi from the samples have known and missing sample sizes. The Bayesian analysis model is therefore expressed as:
where the i = 1, …, N observations are disaggregated by j = 1, …, J time steps (years) and k = 1, …, K spatial locations, in this case, individual counties in Missouri. We project the infection probability π_ion the linear predictor using the logistic sigmoid function to ensure an output range between 0 and 1. The coefficient, if exponentiated exp(β_0), represents the overall odds of anaplasmosis infection. The mixture probabilities (pγ[j] and pu[k]) are to prevent temporal (structured γ_i[j]_ and unstructured δ_i[j]) and spatial (structured ui[k]_ and unstructured vi[k]) over-smoothing over large discontinuities, respectively.
The sample size is a combination of observed samples and missing samples . Since no information is available about the missingness of the observations, they were assumed to be missing at random (MAR), and a Bayesian imputation model was imposed for their prediction. The next stage of the model was the imputation model, which is to impute the missing samples as Poisson random variables with the total cattle counts mi as offset, structured as
Here, we use the average spatial process zi[k] of all the temporal steps centered by the intercept term α_0_ to borrow strength between neighboring observations.
In the Bayesian context, the next stage in modeling is the functional forms of the process layers, γ_i[j], δi[j], vi[k], ui[k], Ui[k]_. Based on different functional forms for the space, time, and space-time variables, three models were built. Model-1 includes a linear predictor that is decomposed into global spatial and temporal variations; that is
where, γ_i[j]_ and δ_i[j]_ are structured and unstructured temporal trends; and ui[k] and vi[k] are structured and unstructured spatial trends. For the structured temporal trends, a first-order random walk process was imposed such that γ_i[j]~N(γi[j−1], τ_γ) for j = 2, …, J and γ_i[1]~N(0, τ_γ). Here, the δ_i[j]_ and vi[k] were modeled as exchangeable random intercepts, where δ_i[j]~N(0, τ_γ), vi[k]~N(0, τ_v), for global temporal and spatial smoothing, respectively. For the structured spatial random effects ui[k], a Gaussian Markov random field (GMRF) process was chosen for local smoothing. The precision matrix for the GMRF smoothing was based upon the spatial arrangements of the Missouri counties. The precision matrix has entries of −1 for counties that are neighbors, 0 for those that are not neighbors, and the number of neighboring counties as the diagonal elements. To reduce over-smoothing over large discontinuities, the random effects, temporal, and spatial terms were modeled as mixture random effects with mixture probabilities pγ[j] and pu[k]_, respectively.
In Model-2, a separate temporal smoothing function was introduced for each spatial entity, and a separate spatial smoothing function was introduced for each temporal unit; thus,
Model-2 assumes no space-time interaction effects but relaxes the assumption of universal spatial smoothing across all time points and temporal smoothing across all spatial entities.
Model-3 is an extension of Model-2 with additional space-time interaction effects. Here, a first-order dynamic CAR was specified, where j = 2, …, J, and ui[j, k] = ρ_i[k]ui[j−1, k]+wi[j, k], where ui[1, k]_ is an average CAR spatial process and wi[j, k] are time-specific CAR processes. This is motivated by the class of dynamic models proposed by Gelfand, et al. (34). The temporal smoothing parameter ρ_i[k]_ spatially varies across the k spatial components. The mixture probabilities pγ[j, k] and pu[j, k] were modeled as random probabilities sampled from the Beta distribution; pγ[j, k]~β(1, 1), pu[j, k]~β(1, 1). Similarly, the common smoothing parameter was modeled as ρ_i[k]_~β(1, 1 ).
Finally, hyper-parameters were assigned to all the variance components, . For , τ_{•}_~γ(0.5, 0.05) was assigned. The model was simulated using the R2jags R package (35) with two chains for 10,000 iterations each. The first 5,000 iterations were discarded, and the remaining 5,000 iterations for each chain were used for making Bayesian inference. Autocorrelation trace plots of the MCMC samples were checked for convergence, and the discrepancy function below was used as the goodness-of-fit statistic to check the adequacy of the models by comparing the observed and predicted anaplasmosis counts.
This statistic is computed for the observed and predicted anaplasmosis counts and then compared for each MCMC iteration. The binomial expectation for the observed E(yi|…) = nipi matches that of the predicted. Similarly, the binomial variance of the observed anaplasmosis counts, V(yi|…) = (1−p)E(yi|…), equals that of the predicted counts. These two values are compared by calculating the Bayesian exceedance probabilities . If there is no significant difference between the observed and predicted counts, the Bayesian p-values should be approximately 0.5. Bayesian p-values of < 0.1 or >0.9 are considered extreme (36).
A simpler explanation of the main differences between models 1, 2, and 3 and the reason for including a space-time interaction effect is provided in Supplementary File 1.
Results
3
Descriptive statistics
3.1
The final dataset used for analysis in this study (4,316 records) included 1,944 samples that tested positive for A. marginale by cELISA. The VMDL received a mean of 360 samples/year, with a mean of 162 positives/year (Figure 1). The largest number of both total and positive samples was received in 2016 (total = 530, positives = 220), and the smallest in 2013 (total = 256, positives = 66). Over the 12-year study period, the VMDL received a mean of 37.5 samples/county, with a mean of 16.9 positives/county. As expected, no obvious trends were apparent when crude counts were plotted at the county level (Figure 2).
Annual counts of bovine serum samples submitted for Anaplasma marginale cELISA at the University of Missouri Veterinary Medical Diagnostic Laboratory, 2010–2021.
Raw proportions of bovine Anaplasma cELISA-positive records (normalized by all cELISA test records) submitted to the University of Missouri Veterinary Medical Diagnostic Laboratory, 2010–2021, summarized by county.
Model estimations
3.2
The dataset used for modeling contained approximately 58% missing records in the binomial sampling sizes, necessitating the inclusion of missing data imputation sub-models. These sub-models were identical across Models 1–3. As illustrated in Figure 3, the missing data imputation sub-model demonstrated strong predictive accuracy, with a coefficient of determination close to 1 (R^2^ ≈ 1). This imputation approach allowed for the use of the full dataset without excluding missing records.
Predictive accuracy of the missing data imputation sub-model. Strong predictive accuracy is visible, with a coefficient of determination close to 1.
Table 2 presents the DIC values used for model comparison. A lower DIC value indicates a better model. Model-3 outperforms the baseline Model-1 as well as Model-2. This outcome is anticipated since Model-1 applies global temporal and spatial smoothing functions, which is overly simplistic and impractical, particularly when the data is unstructured. Model-2 shares structural similarities with Model-3, as it applies separate spatial (temporal) smoothing to each temporal (spatial) unit. However, Model-3 surpasses Model-2 due to the inclusion of space-time interaction effects, which are essential for capturing the spatiotemporal dynamics of biological processes influencing anaplasmosis epidemiology. Consequently, all subsequent adequacy checks and interpretations were based on Model-3 alone.
Model-3 includes a single fixed effect, β_0_ = −0.4, with a logit-inverse value of logit inverse(β_0_) = 0.40. This value represents the average risk of anaplasmosis infection, accounting for unknown exposure effects captured through space-time interaction effects.
Plots of risk for the individual random effect components, derived from the logit inverse of posterior Bayesian estimates in Model-3, revealed a non-uniform spatiotemporal distribution of bovine anaplasmosis seroprevalence risk across Missouri counties. The overall spatial trend, assessed through the spatially structured and unstructured random effect components of Model-3, is presented in Figures 4, 5. Likewise, the overall temporal trend, evaluated using the temporally structured and unstructured random effects, is shown in Figure 6. Finally, the spatiotemporal risk is depicted through the structured spatiotemporal random effect (Figure 7) and the spatiotemporally unstructured random effect term (Figure 8).
County-specific Bayesian posterior risk estimates of overall structured spatial heterogeneity.
County-specific Bayesian posterior risk estimates of overall unstructured spatial heterogeneity.
Purely temporal trends in Bayesian posterior mean risk along with 2.5% and 97.5% credible interval bounds of bovine anaplasmosis seropositivity risk in Missouri, 2010–2021, evaluated with structured (top) and unstructured (bottom) random effects.
County- and year-specific Bayesian posterior risk estimates of structured spatial heterogeneity. Contiguous counties with similar colors indicate presence of same or similar underlying spatial processes that affect bovine anaplasmosis seroprevalence. Varying trends of higher and lower disease risk appearing to expand and contract over the years is observed.
County- and year-specific Bayesian posterior risk estimates of spatially unstructured heterogeneity. Darker colors indicate anaplasmosis prevalence in those counties is driven by unique factors, rather than broader spatial processes operating at larger geographic scales spanning multiple contiguous counties. No trend is observed.
Spatiotemporal plots of Bayesian p-values for exceedance probability (Figure 9) indicate that while Model-3 performs well for most counties in Missouri, there is a consistent set of counties where the model underperforms.
Bayesian P-values of exceedance probabilities comparing county- and year-specific observed and predicted bovine anaplasmosis seropositivity counts. Counties with extreme p-values < 0.1 and >0.9, indicating poor predictive performance, are highlighted in dark gray. For most years, the model performance is poor in a consistent set of Missouri counties.
Discussion
4
Bovine anaplasmosis is endemic in Missouri, with an estimated statewide seroprevalence of 46.5%. (37). This study analyzed the current spatial and spatiotemporal patterns in the disease's distribution across the state using retrospective diagnostic data routinely recorded in a laboratory information management system (LIMS), often a source of information for making epidemiological and disease management decisions (38, 39). The Bayesian models considered in this study were data-driven, and the better performing model (Model-3) utilizes the CAR autocorrelation, which is effective in borrowing information from neighboring space-time units (27, 40–42). A strength of the models in this study is their ability to accommodate missing counts as well as missing sampling sizes, which alleviates the missing data problem often encountered in passive surveillance datasets. Such model structure is widely applied in site-occupancy models for accommodating local population uncertainties (33), and could be useful in situations similar to ours wherein LIMS data are assessed. The risk calculated in this study, i.e., the inverse logit of Bayesian posterior means for the purely spatial, purely temporal, and spatiotemporal random effects fitted in Model-3 reveal the spatial, temporal, and spatiotemporal trends for bovine anaplasmosis seropositivity over the 12-year study period.
The overall structured spatial heterogeneity (Figure 4), when classified in three categories (low, medium, and high risk), shows clusters of high-risk counties for bovine anaplasmosis seropositivity along the eastern half of the state, in the north, central and southeast, while the medium and low risk counties are found throughout, and are also found in contiguous groups of counties. This suggests that the underlying spatial processes that drive such clustering are likely to be similar or potentially arise from the same source, i.e., environmental, disease management practices by producers and veterinarians, or other similar factors. The overall unstructured spatial heterogeneity on the other hand (Figure 5) does not reveal any clustering, suggesting that there is no consistency in the effect of any local (or county-level) factors that play a major role in the spatial dynamics of bovine anaplasmosis seroprevalence in Missouri. The temporally structured and unstructured heterogeneity that accounted for the temporal effect in the retrospective dataset are presented in Figure 6, revealing that the risk of observing bovine anaplasmosis seroprevalence in Missouri has changed over the study period, with some years recording higher risk than others. While the trend is non-linear, it appears the disease burden is more or less stable over the years in Missouri, with some noticeable interannual variability.
Choropleth plots showing posterior risk of structured spatiotemporal heterogeneity? (Figure 7) indicates that the variations in presence of seropositive cases across Missouri counties are not independent but are spatially correlated, and shows a varying trend, with the disease risk appearing to expand and contract over the years. Disease risk increased significantly between 2010 and 2012, peaked around 2016, and again in 2019. The northeastern and southeastern regions consistently show higher risk throughout the years. After 2019, a decline in risk is noticeable; however, this trend could be likely due to less information available to the model that could be derived from the dataset for the latter years. Additionally, values outside these clusters change abruptly, with high and low-value counties scattered throughout the study area, sometimes in proximity. This pattern indicates that while the model successfully identifies regions potentially with similar characteristics affecting presence of seropositive cases, other unknown or unexamined factors may also contribute to the spatial distribution of the disease risk.
The risk maps of structured spatiotemporal heterogeneity further reveal that certain counties remain high-risk over multiple years, indicating persistent high-risk areas. These regions likely have stable environmental factors conducive to disease transmission, such as tick-favorable habitats or frequent livestock movement. Conversely, some counties consistently appear low-risk, representing stable low-risk areas where environmental or management conditions may naturally limit anaplasmosis transmission. Additionally, several counties exhibit fluctuating risk levels over time. Some areas increase in risk in later years, while others decline in risk. These shifts may result from interannual variations such as El Niño Southern Oscillation effects, seasonal variations, land use changes, or changes in disease management practices. Furthermore, emerging high-risk zones are evident, as some counties that were previously lower-risk become high-risk over time. This expansion of high-risk areas may be driven by factors such as climate change, shifts in livestock distribution, or increasing tick populations.
In contrast, the unstructured or spatially unstructured heterogeneity (Figure 8) captures variations in anaplasmosis prevalence that are independent across counties, without spatial correlation to neighboring areas. Higher values suggest that anaplasmosis risk in those counties is driven by unique factors rather than broader spatial processes that operate at larger geographic scales spanning multiple contiguous counties. While values vary widely across the study area, no distinct clusters emerge. This indicates that although global trends exist, local deviations also occur, where specific local level factors may influence individual counties differently. Finally, the spatiotemporal plot of Bayesian p-values for exceedance probability (Figure 9) indicates that while Model-3 performs well for a vast majority of the counties in Missouri, there is a consistent set of counties in Missouri where the model underperforms. One of the reasons for this underperformance could be related to fewer submissions from these counties to the VMDL, which are not adequately addressed by the missing data imputation method used. Additionally, this is also potentially due to the existence of unique factors that drive seropositivity risk in these counties, which are not adequately captured by the random effect terms included in Model-3. This can be alleviated by including biological (environmental, physical), and disease management-related variables that may capture the underlying spatiotemporal process more efficiently. Although our models did not directly evaluate the effects of environmental or management covariates, the spatial and temporal patterns observed in Missouri suggest that factors such as the distribution of wooded vs. open pastureland, regional variation in climate and vector habitat suitability, and differences in herd management practices (e.g., grazing intensity, herd movement, and vector control) may help explain variation in anaplasmosis risk. Incorporating these data into future analyses would allow for more precise assessments of how such factors shape disease dynamics and could guide the development of region-specific management strategies to reduce the burden of bovine anaplasmosis.
Conclusions
5
Clusters of high-risk counties scattered throughout the state (Figure 4) suggest the presence of similar underlying processes that operate across local and/or regional scales and which are not captured in the present model. Possible explanatory variables include local variations in microhabitat and host abundance, which can influence populations of vector ticks, such as soil characteristics (43), encroachment by woody plants such as invasive red cedar (44), and variations in population density of white-tailed deer (45). Local differences in cattle population and movement are also likely to be involved. The lack of any statewide trend in plots of spatially unstructured heterogeneity (Figures 5, 8) further illustrates the importance of local risk factors to anaplasmosis epidemiology in Missouri.
While the overall risk of bovine anaplasmosis seropositivity in Missouri appears relatively steady during the 12-year study period (Figure 6), some fluctuation is nonetheless apparent. While some of this fluctuation may be attributable to random “noise” in the available data, other potential explanatory variables not captured in the present model include temporal fluctuations in weather patterns, which in turn can influence cattle population dynamics through their effects on market pressures. A specific example is the marked reduction in beef cow inventories prompted by drought in 2011–2013, which reached its nadir in 2014 (46, 47). This was eventually followed by restocking of herds, often with replacement heifers shipped in from out-of-state, which increases the opportunities for comingling of naïve and carrier cattle (48). Temporal fluctuations in weather patterns are also likely to affect tick populations and host-seeking behaviors (49, 50).
Plots of county- and year-specific spatially structured heterogeneity (Figure 7) reveal four distinct situations: (1) counties that are consistently higher-risk, (2) counties that are consistently lower-risk, (3) counties that transition from lower to higher risk, and (4) counties that transition from higher to lower risk. Illustrated differently, if the faceted plot in Figure 7 were animated as a time series, the color gradient of certain counties would become progressively darker (increasing risk) or lighter (decreasing risk), sometimes multiple times during the study period. This is uncharacteristic of biological diffusion, i.e., “natural” spread of disease cases over space and time (51) and instead suggests introduction of cases via cattle movements, similar to the manner in which human diseases can appear in new locations via travel (52). Cattle movement, generally through markets, is strongly suspected to be an important source of variation in anaplasmosis risk around Missouri.
Finally, spatiotemporal plots of Bayesian p-values for exceedance probability (Figure 9) indicate 13 counties where the model performs poorly. Some are likely attributable to insufficient submissions from these counties to the VMDL; the independent city of St. Louis, which, as expected for beef cattle, has no submissions during the study period, is perhaps the best example. Nonetheless, several other counties (such as Dunklin and New Madrid, in the “bootheel” of southeastern Missouri) are also without submissions during the study period and are not flagged as underperforming via exceedance probabilities. Further work is required to understand why Model-3 performs poorly in some counties. One potential way to improve the model performance is by including fixed effect terms that may have further explanatory potential, such as those in the categories of environmental, herd management, and tick distribution. The availability of such data at the scale of present analysis and their suitable spatial transformation may however be limited.
The reference list from the paper itself. Each links out to its DOI / PubMed record.
- 1Railey AF Marsh TL. Economic benefits of diagnostic testing in Livestock: anaplasmosis in cattle. Front Vet Sci. (2021) 8:626420. doi: 10.3389/fvets.2021.62642034414221 PMC 8369028 · doi ↗ · pubmed ↗
- 2Salinas-Estrella E Amaro-Estrada I Cobaxin-Cárdenas ME Preciado de la Torre JF Rodríguez SD. Bovine Anaplasmosis: Will there ever be an almighty effective vaccine? Front Vet Sci. (2022) 9:946545. doi: 10.3389/fvets.2022.94654536277070 PMC 9581321 · doi ↗ · pubmed ↗
- 3Curtis AK Kleinhenz MD Anantatat T Martin MS Magnin GC Coetzee JF . Failure to eliminate persistent Anaplasma marginale infection from cattle using labeled doses of chlortetracycline and oxytetracycline antimicrobials. Vet Sci. (2021) 20:8. doi: 10.3390/vetsci 811028334822656 PMC 8621018 · doi ↗ · pubmed ↗
- 4Toillion AR Reppert EJ Amachawadi RG Olson KC Coetzee JF Kang Q . Effect of protracted free-choice chlortetracycline-medicated mineral for anaplasmosis control on Escherichia coli chlortetracycline resistance profile from pastured beef cattle. Microorganisms. (2021) 9:2495. doi: 10.3390/microorganisms 912249534946097 PMC 8704331 · doi ↗ · pubmed ↗
- 5Reinbold JB Coetzee JF Hollis LC Nickell JS Riegel CM Christopher JA . Comparison of iatrogenic transmission of Anaplasma marginale in Holstein steers via needle and needle-free injection techniques. Am J Vet Res. (2010) 71:1178–88. doi: 10.2460/ajvr.71.10.117820919904 PMC 8284935 · doi ↗ · pubmed ↗
- 6Scoles GA Miller JA Foil LD. Comparison of the efficiency of biological transmission of Anaplasma marginale (Rickettsiales: Anaplasmataceae) by Dermacentor andersoni Stiles (Acari: Ixodidae) with mechanical transmission by the horse fly, Tabanus fuscicostatus Hine (Diptera: Muscidae). J Med Entomol. (2008) 45:109–14. doi: 10.1093/jmedent/45.1.10918283950 · doi ↗ · pubmed ↗
- 7Scoles GA Broce AB Lysyk TJ Palmer GH. Relative efficiency of biological transmission of Anaplasma marginale (Rickettsiales: Anaplasmataceae) by Dermacentor andersoni (Acari: Ixodidae) compared with mechanical transmission by Stomoxys calcitrans (Diptera: Muscidae). J Med Entomol. (2005) 42:668–75. doi: 10.1093/jmedent/42.4.66816119558 · doi ↗ · pubmed ↗
- 8Jones AL Berghaus RD Kalatari AA Credille B Naikare HK Heins B . Seroprevalence and molecular detection of Anaplasma marginale infected beef herds in Georgia, USA. Bovine Pract. (2022) 56:70–8. doi: 10.21423/bovine-vol 56no 2p 70-78 · doi ↗