Genetic variation and mRNA expression of the ELOVL6 and CRTC2 genes in Kalmyk cattle
Nurlybay Kazhgaliyev, Kaster Nurgulsim, Aizhan Makhanbetova, Dulat Ibrayev, Kymbat Shaikenova, Zhandos Hasen, Saltanat Amantay, Saniya Zhumagaziyeva, Ilmira Mukhametzharova, Akkair Bakytzhan, Elmira Adilbekova

TL;DR
This study explores the genetic variation and expression of ELOVL6 and CRTC2 genes in Kalmyk cattle, linking a specific SNP to growth and meat traits.
Contribution
The study identifies a novel SNP in the ELOVL6 gene associated with body weight and length in Kalmyk cattle.
Findings
CRTC2 is highly expressed in heart and liver, while ELOVL6 is predominantly expressed in spleen and large intestine.
A polymorphic SNP (g.16511290A > G) in ELOVL6 is significantly associated with live weight and body oblique length.
The G allele of the ELOVL6 SNP is dominant and linked to improved growth traits in Kalmyk cattle.
Abstract
Kalmyk cattle are an important meat breed in Kazakhstan, valued for their strong physique, genetic stability, and adaptability. In this study, we investigated the mRNA expression of ELOVL fatty acid elongase 6 (ELOVL6) and CREB-regulated transcription coactivator 2 (CRTC2) across multiple tissues, and further examined their genetic variations and associations with growth and carcass traits in 200 Kalmyk cattle. Expression analysis showed that CRTC2 was most highly expressed in the heart and liver, whereas ELOVL6 was predominantly expressed in the spleen and large intestine, highlighting their tissue-specific expression patterns. In addition, we identified a polymorphic SNP (g.16511290A > G) in the 3′UTR of ELOVL6, with three genotypes (AA, AG, GG) and the G allele being dominant (0.520). Polymorphism information content (PIC) analysis indicated high genetic diversity at this locus.…
Genes, proteins, chemicals, diseases, species, mutations and cell lines named across the full text — each resolved to its canonical identifier and authoritative record.
Click any figure to enlarge with its caption.
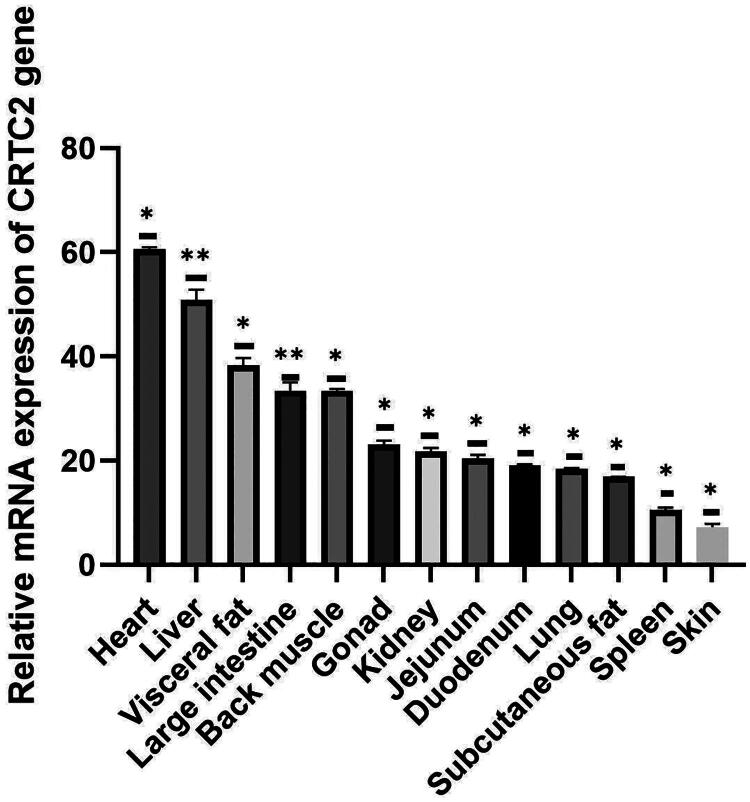 Figure 1
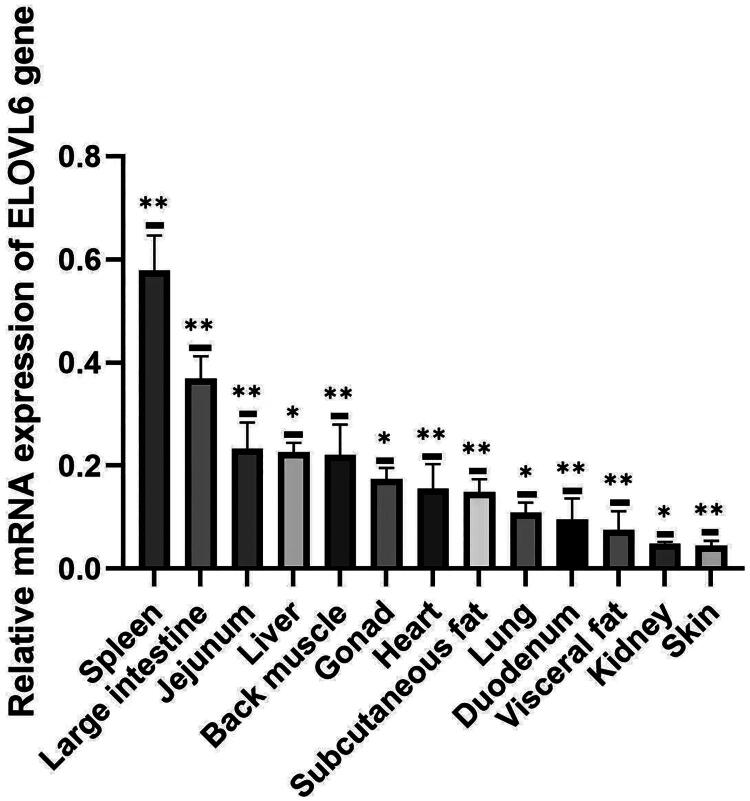 Figure 2
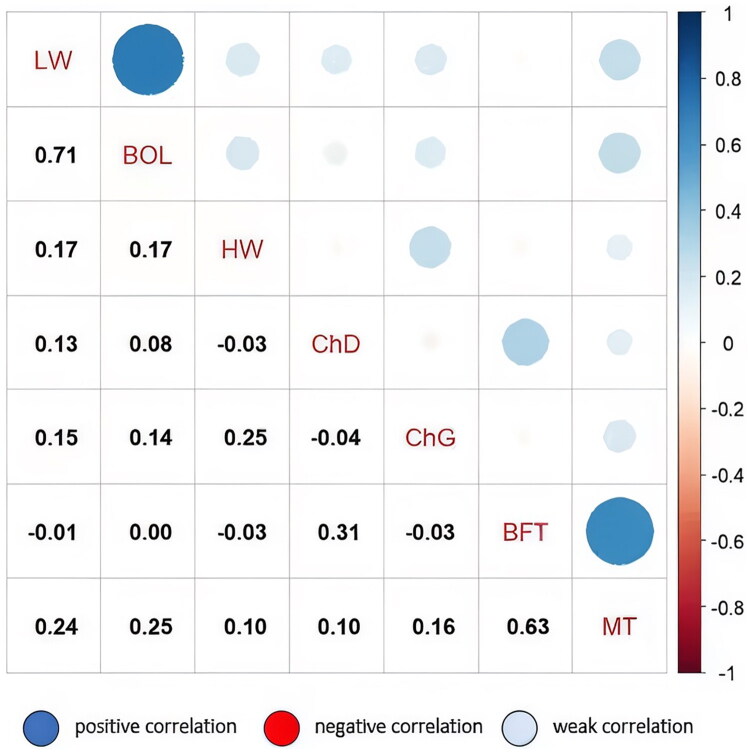 Figure 3
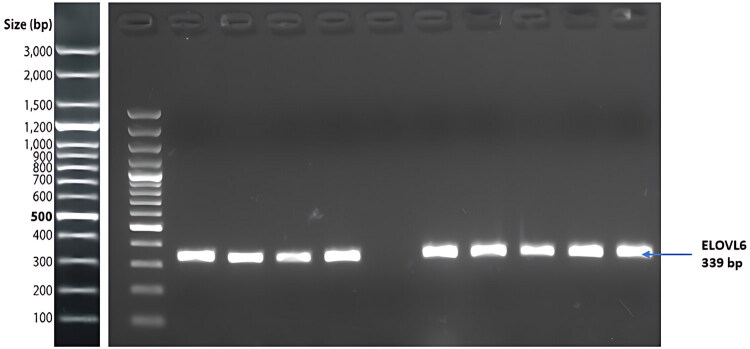 Figure 4
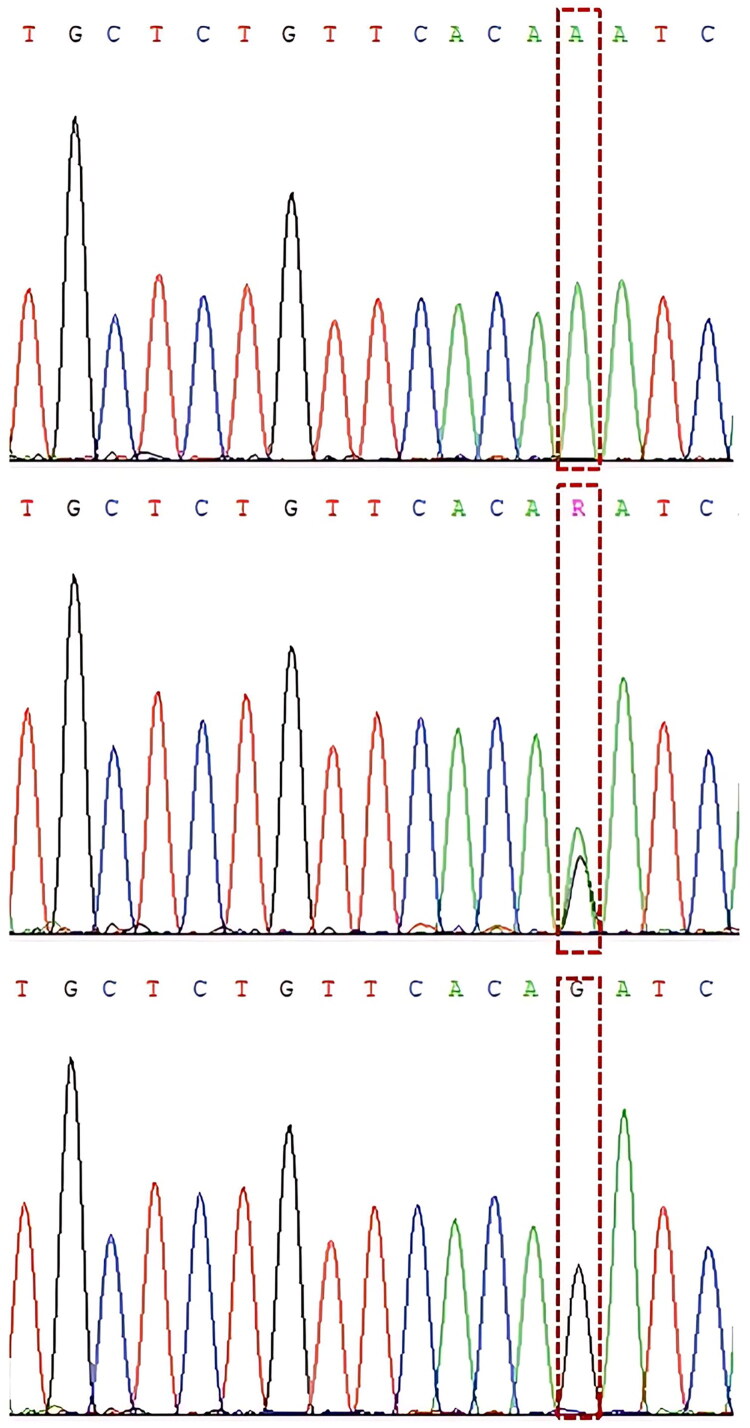 Figure 5
| Genes | Sequences | Location | Product size | Note |
|---|---|---|---|---|
| F: GGCGGTCTTGGAAGAGTTCA | Exon and intron | 662 bp | SNPs | |
| R: CTCTGGCTCTCTCCTCCACT | ||||
| F1: CCATCATCTCTTCAGGGCGTG | Intron | 308 bp | ||
| R1: AGGATACTGGGAGAAACGCA | ||||
| F2: TCTCTTTAGGGAAGGGGGCA | Intron | 497 bp | ||
| R2: AGAGGAGATGGCCTGAGTGT | ||||
|
|
|
| ||
| CATCGGCAATGAGCGGTTCC | CDS | 174 bp | mRNA | |
| CCGTGTTGGCGTAGAGGTC | ||||
| GAAGAATGGTGTCCCCGCTT | 163 bp | |||
| AGTGCAGATGGTAGTCGAAACA | ||||
| TAGCACAGCCTCGGTCTAGT | 114 bp | |||
| GGAGCTGCCCTTTCAAGAGT |
| Step | Temperature, °C | Time | Number of cycles |
|---|---|---|---|
| Initial denaturation | 95.0 | 3 min | 1 |
| Denaturation | 95.0 | 30 s | 35 |
| Annealing | 63.0 | 30 s | |
| Extension* | 72.0 | 1 min | |
| Final extension | 72.0 | 5 min | 1 |
| Loci | Frequencies |
|
|
| HWE | PIC | ||||
|---|---|---|---|---|---|---|---|---|---|---|
| Genotypes | Alleles | |||||||||
| AA | AG | GG | A | G | 0.501 | 0.499 | 1.996 | 0.375 | ||
| Growth traits | Observed genotypes (Mean ± SD) | F-Value | Partial η2 | |||
|---|---|---|---|---|---|---|
| AA | AG | GG | ||||
| LW, kg | 338.14 ± 17.2A | 351.15 ± 10.6B | 340.74 ± 15.43A |
|
|
|
| BOL, cm | 137.48 ± 6.49a | 141.62 ± 6.84b | 139.03 ± 7.35ab |
|
|
|
| HW, cm | 120.34 ± 2.3 | 120.62 ± 1.6 | 121.08 ± 3.4 | 1.419 | 0.244 | 0.014 |
| ChD, cm | 56.01 ± 4.7 | 57.41 ± 4.6 | 56.95 ± 3.6 | 1.729 | 0.180 | 0.017 |
| ChG, cm | 124.40 ± 4.9 | 124.26 ± 6 | 123.08 ± 6.5 | 1.066 | 0.347 | 0.011 |
| BFT, cm | 0.74 ± 0.1 | 0.71 ± 0.1 | 0.72 ± 0.1 | 1.017 | 0.364 | 0.010 |
| MT, cm | 3.44 ± 0.1 | 3.42 ± 0.1 | 3.42 ± 0.1 | 0.775 | 0.462 | 0.008 |
- —The Effect of Polymorphic Genes on the Meat Quality of Kalmyk Cattle
Peer Reviews
No public reviews on file for this paper yet. If you reviewed it on a platform where reviews are public (OpenReview, ICLR, NeurIPS, ICML), you can paste yours below so the community can read it here.
Videos
No videos yet. Explain this paper in a talk, walkthrough, or lecture? Add one.
Taxonomy
TopicsGenetic and phenotypic traits in livestock · Genetic Mapping and Diversity in Plants and Animals · Regulation of Appetite and Obesity
Introduction
A key challenge that Kazakhstan’s agro-industrial sector must address in the coming years is the enhancement of high-quality beef production. One of the most promising strategies for tackling this issue lies in the development of specialized beef cattle breeding. Among the local breeds, Kalmyk cattle stand out as a popular meat breed in Kazakhstan due to their strong physique, genetic stability, and adaptability to harsh environments. The Kalmyk breed originated in the XVI-XVII centuries from cattle brought by Oirat tribes migrating from western Mongolia, and is now distributed mainly across southern Russia (Kalmykia, Rostov, Volgograd, Astrakhan) and parts of Kazakhstan.1 Previous studies have suggested that the Russian Kalmyk breed is genetically more similar to Mongolian cattle, with origins linked to Turano-Mongolian ancestry.2 According to Khamzina et al.3 the Kalmyk cattle population in Kazakhstan was estimated at approximately 23,000 individuals in 2022. Kalmyk cattle are distinguished by their origin, biological and productive qualities, as well as their body conformation type. The study on breeding stock of Kalmyk cattle in Kazakhstan indicate that calves are born with an average live weight of 22–26 kg and reach 165–175 kg by six months of age, with average daily gains of up to 1.0 kg in the first year of growth, reflecting good precocity.4 Despite their resilience and adaptability, the economic competitiveness of Kalmyk cattle compared to exotic commercial beef breeds is constrained by disadvantages such as lower intramuscular fat (marbling) and reduced subcutaneous fat deposition, which directly affect meat quality and consumer preference. Meanwhile, genomic characterization of Kalmyk cattle remains limited, and little is known about the genetic basis of their growth and carcass traits. Therefore, studying this breed provides valuable insights for both conservation and genetic improvement strategies.
Genetic studies play a crucial role in developing cattle breeds that produce meat with improved nutritional and quality profiles.5 In this regard, marker-assisted selection (MAS) offers a powerful tool, enabling breeders to identify and select animals carrying favourable genetic markers at an early stage, thereby reducing both the time and resources required to achieve targeted improvements.6 Among the various types of genetic variation, single nucleotide polymorphisms (SNPs) are the most prevalent and have become essential markers in livestock breeding. Understanding SNPs associated with key traits such as growth rate, fat deposition, and meat quality provides valuable insights for the design of efficient selection programs.7 The identification of favourable alleles can accelerate genetic progress by enhancing desirable traits, ultimately improving both the efficiency of beef production and the quality of the final product. In recent years, numerous SNPs linked to economically important traits have been identified across different cattle breeds.8–10 For example, polymorphisms in the calpastatin (CAST) gene have been significantly associated with meat tenderness in Nellore and Angus × Nellore cattle.11 Copy number variations (CNVs) in the STAT5A gene have been reported to influence growth traits in Chinese cattle.12
The ELOVL fatty acid elongase 6 (ELOVL6) and CREB-regulated transcription coactivator 2 (CRTC2) genes are particularly important for MAS studies targeting meat traits in cattle due to their significant roles in influencing growth, fat deposition, and meat quality. It has been reported that SNPs of the ELOVL6 gene can influence the fatty acid composition of meat, affecting traits like marbling, fat deposition, and overall meat quality.13 The ELOVL6 gene is involved in the elongation of long-chain fatty acids, which plays a vital role in lipid metabolism and it is particularly important for synthesizing monounsaturated fatty acids.14
The CREB-regulated transcriptional co-activators (CRTC) gene family consists of three members, including CRTC1, CRTC2, and CRTC3 that also known as TORC1, TORC2, and TORC3. The TORC2 gene plays a critical role in adipogenesis, lipogenesis, lipid esterification, and inhibition of lipolysis, and regulatory function in bovine adipocytes.15 It acts as a coactivator for transcription factors that drive the expression of genes involved in metabolism, therefore, plays a role in obesity.16 Previous study revealed that g.80G > T and g.93A > T SNPs of the TORC1 gene were associated with superior body measurements in Qinchuan beef cattle.17 Moreover, SNPs in the CRTC2 gene influence traits such as body weight gain, feed efficiency, and fat deposition in cattle.18 Khan et al.19 detected three novel SNPs (g.16534694G > A, g.16535011C > T, and g.16535044A > T) in the TORC2 promoter that were associated with superior body measurements and carcass quality traits in Qinchuan cattle. This makes it a significant target for research in improving meat quality traits and yield in cattle.20
By identifying genetic markers that influence growth traits, it becomes possible to optimize meat quality, enhance growth performance, and promote overall sustainability in beef production. Therefore, the aim of this study was to analyze the expression patterns of the ELOVL6 and CRTC2 genes across different tissues, to screen for SNPs, and to evaluate their associations with body measurement traits in Kalmyk cattle.
Materials and methods
Sample collection and data acquisition
2.1.
All experimental procedures involving animals were reviewed and approved by the Local Ethics Committee on Biological and Medical Ethics of S. Seifullin Kazakh Agrotechnical Research University (Protocol No. 1, dated 16 October 2024).
This research utilized blood samples from a total of 200 Kalmyk heifers aged 18–20 months. They were reared under uniform conditions at LLP ‘Qazaq Asyldary’ located in the Kobda district of the Aktobe region, Republic of Kazakhstan. The samples were transported to the laboratory and stored at −20 °C until further analysis. All cattle were subjected to a uniform feeding regimen and management practices on the farm.
In this study, 13 types of tissue samples (spleen, heart, liver, visceral fat, large intestine, right kidney, small intestine, duodenum, right lung, subcutaneous fat, skin, back muscle, and left gonad) were collected at the slaughterhouse of LLP ‘Qazaq Asyldary’ from a freshly slaughtered, clinically healthy 18-month-old Kalmyk bulls (n = 3). All samples were sterilized, placed in cryotubes and delivered to the laboratory in liquid nitrogen, after which they were stored in a freezer at −80 °C.
In addition, seven different morphometric indicators of the Kalmyk breed, including live weight (LW), body oblique length (BOL), height at the withers (HW), chest depth (ChD), chest girth (ChG), backfat thickness (BFT), and muscle thickness (MT) were recorded. Body measurements were determined using a tape measure and measuring stick, while carcass indicators were determined using ultrasonic devices.
RNA extraction, primer design and qRT-PCR
2.2.
Total RNA was extracted from tissue samples using the RecoverAll^™^ Total Nucleic Acid Isolation Kit for FFPE (Thermo Fisher Scientific, Waltham, MA, USA) following the manufacturer’s protocol. Complementary DNA (cDNA) was synthesized from the extracted RNA using RevertAid First Strand cDNA Synthesis Kit (Thermo Fisher Scientific, Waltham, MA, USA). All procedures were performed according to the protocols provided with the kits.
Based on the mRNA sequences of the bovine CRTC2 and ELOVL6 genes (accession numbers: NM_001076250.1 and XM_015471503.3) published in the GenBank database, as well as the β-actin gene as an endogenous control (accession number: NM_173979.3), primers for qPCR were developed using NCBI Primer-BLAST software (Table 1).
Gene expression levels were quantified by real-time PCR using PowerUp^™^ SYBR^™^ Green Master Mix (Thermo Fisher Scientific, Waltham, MA, USA) and specific primers (listed in Table 1) in a 20 μL reaction volume. The qRT-PCR procedure followed previously established conditions.21 The reactions were performed on a QuantStudio 7 Flex real-time PCR instrument (Thermo Fisher Scientific, Waltham, MA, USA). β-actin was used as the reference gene and relative expression levels of the target genes were calculated using the 2^^−ΔΔCt^ method. Statistical analysis was performed using GraphPad Prism version 10.0 (GraphPad Software, San Diego, CA, USA).
Genomic DNA isolation
2.3.
DNA was extracted from blood samples using the GeneJET Genomic DNA Purification Kit (Thermo Fisher Scientific, Waltham, MA, USA) in accordance with the manufacturer’s protocol. The quality of the DNA obtained was analyzed using agarose gel electrophoresis and spectrophotometry. Then samples that met the required concentration were diluted to 50 ng/μl and stored at −40 °C.
Primer design and genotyping
2.4.
For the design of primers, the sequence of the bovine CRTC2 and ELOVL6 genes were referenced from NCBI (Accession numbers: NC_037330.1 and NC_037333.1), while the primers targeting SNPs g16379651A > G; g16458976A > G; g16511290A > G22 in the ELOVL6 gene and g.3001 C > T, g.3034 G > A, g.33467 T > C18 in CRTC2 gene were created using NCBI Primer-BLAST (see Table 1).
Polymerase chain reaction (PCR), agarose gel electrophoresis and Sanger sequencing were employed to identify polymorphisms. Each PCR reaction was carried out in a total volume of 25 µL. The reaction mixture contained 12.5 µL of DreamTaq PCR Master Mix (2X) (Thermo Fisher Scientific, Waltham, MA, USA), 1 µL of forward primer, 1 µL of reverse primer, 3 µL of template DNA, and 7.5 µL of ddH2O. The PCR reaction condition is given in Table 2. The resulting PCR products were subjected to fractionation on a 3.5% agarose gel, and subsequently sent to sequencing. All individuals underwent individual genotyping.
Statistical and bioinformatical analyses
2.5.
Population genetics parameters were evaluated with the GDIcall Online Calculator (available at http://www.msrcall.com/Gdicall.aspx). The Hardy-Weinberg equilibrium (HWE) was assessed using the SHEsis program (accessible at http://analysis.bio-x.cn). Statistical analysis was conducted using general linear model (GLM) in SPSS Statistics version 25.0 (IBM Corp., Armonk, NY, USA), to analyze the significance of associations between genotypes and body morphometric characteristics in Kalmyk cattle, with a P < 0.05 deemed statistically significant.
The influence of genotypes on growth traits was examined using the following statistical model: Yijk = μ + Ai + Gj + Eijk, where Yij represents the body measurement trait, μ denotes the mean for each trait, Ai indicates the fixed effect of genotype, Gj refers to the effect of age, and Eijk signifies random error.23
The correlation between phenotypic traits was analyzed by constructing a diagram in the RStudio software (PBC, Boston, MA, USA).
Results
mRNA expression analysis of the CRTC2 and ELOVL6 genes
3.1.
We analyzed the mRNA expression patterns of the CRTC2 and ELOVL6 genes in various tissues of Kalmyk cattle to investigate their tissue-specific expression profiles and potential biological roles. The mRNA expression of the CRTC2 gene (Figure 1) was highest in the heart (p < 0.05), followed by the liver (p < 0.01) and visceral fat (p < 0.05). Moderate expression levels were detected in the large intestine, back muscle, gonad, and kidney, all showing significant differences (p < 0.05). Low expression was observed in the jejunum, duodenum, lung, subcutaneous fat, spleen, and skin, also with significant differences (p < 0.05). The highest transcriptional activity observed in the heart and liver, may indicate its potential role in the regulation of energy metabolism and glucose metabolism.
Expression analysis of bovine CRTC2 gene in different tissues.
Figure 2 shows the relative expression of ELOVL6 mRNA in various tissues of Kalmyk cattle. According to the analysis results, the highest level of ELOVL6 mRNA expression was observed in the spleen and large intestine (p < 0.01). Medium expression levels were recorded in the small intestine, liver, spinal muscle, gonads, subcutaneous adipose tissue, and cardiac tissue (p < 0.05). The lowest expression levels were observed in the lung, duodenum, visceral fat, kidney, and skin tissue (p < 0.05). The results obtained indicate the tissue-specific nature of ELOVL6 gene expression in the tissues of Kalmyk cows. This gene is actively transcribed in the spleen and large intestine, which may indicate its role in lipid metabolism and energy exchange in these tissues.
Expression analysis of bovine ELOVL6 gene in different tissues.
Correlation analysis of body measurement traits
3.2.
To examine the phenotypic relationships among these traits, we conducted correlation analysis (Figure 3). A strong positive correlation was observed between LW and BOL (r = 0.71), suggesting that heavier animals tend to have longer body frames. Similarly, MT was strongly associated with BFT (r = 0.63), indicating parallel development of muscle and fat deposition. A moderate correlation was detected between BFT and ChD (r = 0.31), while weak correlations were observed between HW and ChG (r = 0.25), reflecting that animals with greater frame size tended to have slightly broader chest dimensions. In contrast, most other trait pairs showed weak or negligible correlations (r values between −0.05 and 0.25), suggesting little phenotypic association. Overall, these results highlight that growth traits are interconnected, with body size and carcass composition traits developing in parallel, thereby providing a foundation for subsequent genetic association analysis.
Correlation diagram for growth traits. LW, live weight, BOL, body oblique length, HW, height at the withers, ChD, chest depth, ChG, chest girth, BFT, backfat thickness, MT, muscle thickness. The size of the circles reflects the absolute value of the correlation coefficient, while the color represents the direction and magnitude of the correlation (blue = positive, red = negative). Correlation values range from −1 (perfect negative) to +1 (perfect positive).
Identification of genetic variations and genetic parameters
3.3.
The sequencing results revealed no polymorphisms in the CRTC2 gene in Kalmyk cattle. In contrast, analysis of the ELOVL6 gene revealed a single polymorphic site (g.16511290A > G) located in the 3′UTR region. The gel electrophoresis results are presented in Figure 4. The sequencing data further confirmed the presence of three genotypes, namely AA, AG, and GG, at this locus (Figure 5).
Electrophoresis of ELOVL6-g.16511290A > G locus.
Sequencing results of the ELOVL6-g.16511290A > G locus.
The genetic parameters, including genotypic frequency, allelic frequency, homozygosity, heterozygosity, effective allele numbers, polymorphism information content of the SNP in the ELOVL6 gene in the Kalmyk cattle are shown in Table 3. For g16511290A > G locus, the GG genotype as present at a higher frequency (0.370) than the AA (0.325) and AG (0.305) genotypes, the frequency of the A allele was 0.477, and the G allele was the dominant allele (0.523). SNPs showed a high genetic diversity (0.375). In addition, this marker showed a deviation from Hardy-Weinberg equilibrium (HWE) in the tested sample (P = 0.006).
Association of SNP with body measurement traits in Kalmyk cattle
3.4.
Furthermore, we examined the association of ELOVL2 polymorphism with growth traits (Table 4). The GLM analysis revealed a significant effect of genotype on live weight (p < 0.001). The effect size (Partial η^2^ = 0.121) indicates that approximately 12.1% of the variance in body weight can be explained by differences among genotypes, which represents a moderate effect. Animals with the AG genotype had the highest mean body weight (351.15 ± 10.65 kg) compared to the AA and GG genotypes (Table 4). Similarly, a significant association between genotypes of g16511290A > G and BOL (p = 0.004). Individuals with genotype AG showed the highest mean BOL (141.62 ± 6.84). Genotype accounted for approximately 5.5% of the variance in BOL, suggesting a small but statistically significant effect.
No significant differences were observed among genotypes for height at withers, chest depth, chest girth, backfat and muscle thickness (P > 0.05), suggesting that the effect of the g16511290A > G polymorphism is specific to live weight and body oblique length rather than general body conformation traits.
Discussion
The Kalmyk cattle is a unique source of genetic material, which has been used to create modern meat cattle breeds such as the Kazakh white-headed cattle.3 MAS is a powerful tool in livestock breeding that accelerates the development of improved varieties by using molecular markers linked to desirable traits. Understanding gene function is crucial when selecting genes for MAS because it enables breeders to target traits that significantly improve economically important traits.24
In the present study, ELOVL6 showed predominant expression in the spleen and large intestine, which may reflect its function in fatty acid elongation and immune–metabolic interactions, as the spleen is central to immune regulation and the intestine plays a critical role in nutrient absorption and lipid metabolism. Plenty studies have been proposed that ELOVL6 plays a significant role in energy metabolism and insulin sensitivity (Matsuzaka, 2020)25. In the study by Junjvlieke et al.21^,^26 ELOVL6 has been studied for its potential impact on the fatty acid composition in bovine adipocytes. Transcriptome analysis of adipose tissue revealed that miR-211 and miR-331-5p showed an inverse relationship with the elongation of ELOVL6.26 It was observed that ELOVL6 knockout mice exhibited weight gain, increased subcutaneous white adipose tissue mass, and impaired carbohydrate metabolism.27
In this study, we observed one polymorphic SNP (g.16511290A > G) in the ELOVL6 gene, and the observed deviation from Hardy–Weinberg equilibrium at this locus may be attributed to selection pressure, small effective population size, or potential sampling effects influencing the allele distribution in the studied population. Furthermore, the association study results exhibited that g.16511290A > G variation in the ELOVL6 gene was significantly related to live weight and body oblique length in Kalmyk cattle, which is mainly attributed to its function. To the best of our knowledge, this is first on mRNA expression and genetic variations in this gene and their association with body measurement traits in Kalmyk cattle.
Previously, SNPs in this gene were contributed to somatic cell score and milk fat content in cattle.22 More recently, it was found that variation in ELOVL6 was correlated with carcass composition and meat quality in pigs.28 In sheep, RNA-sequencing analysis has identified ELOVL6 as a gene involved in lipid metabolism and fat deposition.29–31 This gene was identified as a significant locus in the genome-wide association study, which plays a role in the genetic regulation of fatty acid composition in pigs.32 Study on ELOVL6 in milk composition revealed that miR-206 hinders milk fatty acid production and lipid buildup by targeting ELOVL6 in bovine mammary epithelial cells.33 Therefore, variations in this gene may lead to changes in the fatty acid profile in tissues, potentially influencing body composition and fat distribution in cattle.
The tissue-specific expression analysis demonstrated that CRTC2 was most highly expressed in the heart and liver, suggesting a potential role in regulating energy metabolism and cardiac function, consistent with its known involvement in gluconeogenesis and stress response pathways.16^,^34 In obese mice, hepatic overexpression of an mTOR-defective CRTC2 mutant improved lipogenesis and insulin sensitivity, highlighting the role of CRTC2 in mTOR-dependent lipid regulation in fed and obese states.16 It was reported that CRTC2 (also known as TORC2) expression was greatest in the abomasum in Qinchuan cattle.35 siRNA-mediated knockdown of the TORC2 gene followed by RNA sequencing revealed that its downregulation impairs bovine adipocyte differentiation.36
The absence of polymorphisms in the CRTC2 gene observed in Kalmyk cattle may reflect breed-specific genetic background, strong purifying selection, or a relatively small effective population size, in contrast to reports of variation in other breeds. Previously, observed that SNPs in CRTC2 were associated with several growth and meat traits in cattle. CRTC1 gene acts as a coactivator for the transcription factor CREB (cAMP response element-binding protein), which is important in metabolism and skeletal muscle disorders.34 For instance, previous study identified the core promoter region of the TORC1 gene and it is regulated via NRF1 and Smad3 transcription factors, providing insights for improving intramuscular fat in cattle.37 It was demonstrated that bta-miR-149-5p directly targets CRTCs, specifically CRTC1 and CRTC2 and plays a role in regulating adipogenesis.38 Also, CRTC2 interacts with AMP-activated protein kinase (AMPK), which is a critical energy sensor in cells. Activation of AMPK can promote fatty acid oxidation and suppress lipogenesis, influencing body composition and fat deposition.39 Notably, the expression levels of CRTC2 in the mouse mammary gland were significantly elevated during lactation compared to the dry and puberty stages, while the phosphorylation of CRTC2 at Ser171 remained unchanged, which further reinforces the idea that CRTC2 plays a crucial role as a transcriptional coactivator in the process of milk fat synthesis via mechanistic target of rapamycin (mTOR).40 The mTOR pathway is essential for regulating cell growth and metabolism in response to nutrients and growth factors.41 Hence, CRTC1 gene may interact with these pathways to influence muscle growth and fat deposition.
Furthermore, the identified SNP (g.16511290A > G) was located in the 3′UTR region of the ELOVL6 gene, a regulatory region that can influence mRNA stability, localization, and translation efficiency, thereby potentially affecting gene expression and growth traits. Specifically, the SNP could create or disrupt microRNA (miRNA) seed sites or RNA-binding-protein (RBP) motifs, thereby changing mRNA decay rates and translation efficiency.42 It may also change the 3′UTR structure or polyadenylation, which can affect mRNA stability and translation.43 For instance, the SNP in the 3′UTR of NCF4 lies within the bta-miR-2426 binding site, and cows carrying the GG genotype exhibited higher NCF4 mRNA expression than those with the AA genotype, suggesting regulation through a miRNA–mRNA interaction.44 Coding variations or loci in regulatory regions in genes play a crucial role in determining phenotypic traits in livestock, influencing characteristics such as growth rate, milk production, and disease resistance.45 By studying these variations, we can gain insights into the biological mechanisms that underpin phenotypic diversity in livestock, leading to innovations in animal husbandry practices. Together, these findings contribute to the molecular characterization of fat metabolism related genes in Kalmyk cattle and provide candidate genetic markers for further evaluation in breeding programs.
Conclusion
This study provides novel insights into the functional roles and genetic variation of the CRTC2 and ELOVL6 genes in Kalmyk cattle. The tissue-specific expression patterns, with CRTC2 highly expressed in the heart and liver and ELOVL6 predominantly in the spleen and large intestine, suggest their involvement in metabolic and growth-related processes. Moreover, the identification of a polymorphic SNP (g.16511290A > G) in the 3′UTR of ELOVL6, which was significantly associated with live weight and body oblique length, highlights its potential as a molecular marker. Collectively, these findings indicate that the SNP g.16511290A > G in ELOVL6 may serve as useful marker for marker-assisted selection aimed at improving body measurements and meat production traits in beef cattle.
Supplementary Material
Original Image for Figure 4.jpg
The reference list from the paper itself. Each links out to its DOI / PubMed record.
- 1Abdelmanova AS, Kharzinova VR, Volkova VV, et al. Comparative study of the genetic diversity of local steppe cattle breeds from Russia, Kazakhstan and Kyrgyzstan by microsatellite analysis of museum and modern samples. Diversity (Basel). 2021;13(8):351.
- 2Sermyagin AA, Dotsev AV, Gladyr EA, et al. Whole-genome SNP analysis elucidates the genetic structure of Russian cattle and its relationship with Eurasian taurine breeds. Genet Sel Evol. 2018;50(1):37.29996786 10.1186/s 12711-018-0408-8PMC 6042431 · doi ↗ · pubmed ↗
- 3Khamzina AK, Yurchenko AA, Yudin NS, Ibragimov PS, Ussenbekov YS, Larkin DM. History, status and genetic characteristics of native cattle breeds from the Republic of Kazakhstan. Vavilovskii Zhurnal Genet Selektsii. 2024;28(4):416–423.39027129 10.18699/vjgb-24-47PMC 11253020 · doi ↗ · pubmed ↗
- 4Bissembayev AT, Shamshidin AS, Kasenov ZM, Chindaliyev AE, Yuldashbayev YA, Baimukanov DA. Selection of Kalmyk cattle in Kazakhstan. Online J Biol Sci. 2024;24(1):121–130.
- 5Schenkel FS, Miller SP, Jiang Z, et al. Association of a single nucleotide polymorphism in the calpastatin gene with carcass and meat quality traits of beef cattle. J Anim Sci. 2006;84(2):291–299.16424255 10.2527/2006.842291 x · doi ↗ · pubmed ↗
- 6Zhang Z, Yang P, He P, et al. Distribution and association study of PLAG 1 gene between copy number variation and Chinese cattle populations. Anim Biotechnol. 2022;33(2):273–278.32723213 10.1080/10495398.2020.1793769 · doi ↗ · pubmed ↗
- 7Lyu S, Yang P, Liu Y, et al. Genetic effects of MOGAT 1 gene SNP in growth traits of Chinese cattle. Gene. 2021;769:145201.33035617 10.1016/j.gene.2020.145201 · doi ↗ · pubmed ↗
- 8Bila L, Malatji DP, Tyasi TL. Single nucleotide polymorphisms of growth hormone gene in cattle and their association with growth traits: a systematic review. Trop Anim Health Prod. 2024;56(4):141.38662270 10.1007/s 11250-024-03985-1PMC 11045646 · doi ↗ · pubmed ↗