Associations between metabolic and structural retinal parameters and depression in individuals with type 2 diabetes
Frederik Nørregaard Pedersen, Lonny Stokholm, Noemi Lois, Dawei Yang, Carol Y. Cheung, Rafael Simó, Tunde Peto, Frans Pouwer, Jakob Grauslund

TL;DR
This study found that higher retinal oxygen levels in some areas are linked to depression in people with type 2 diabetes.
Contribution
The study is the first to link retinal metabolic parameters with depression in type 2 diabetes patients.
Findings
Depression was associated with higher retinal arteriolar oxygen saturation in the lower temporal quadrant.
No significant associations were found between depression and structural vascular retinal parameters.
The results only partially support the role of vascular factors in depression among type 2 diabetes patients.
Abstract
We aim to examine whether a spectrum of retinal parameters, are associated with depression in individuals with type 2 diabetes. We performed a cross sectional study of elderly patients with type 2 diabetes. Depression was measured with the Self-rated Inventory of Depressive Symptomatology 30 questionnaire, with scores ≥ 18 indicating depression. We evaluated retinal oxygen saturation, and retinal microvascular structures in individuals with type 2 diabetes and whether these were associated with increased risk of depression. Structural retinal parameters were measured in fundus photographs, and OCT-angiography scans, whereas retinal oxygen saturation was assessed with Oxymap Model T1. Main outcome was risk of depression. Multivariable logistic regression was used to investigate the association between retinal parameters and depression. We included 134 individuals with type 2 diabetes,…
Genes, proteins, chemicals, diseases, species, mutations and cell lines named across the full text — each resolved to its canonical identifier and authoritative record.
Click any figure to enlarge with its caption.
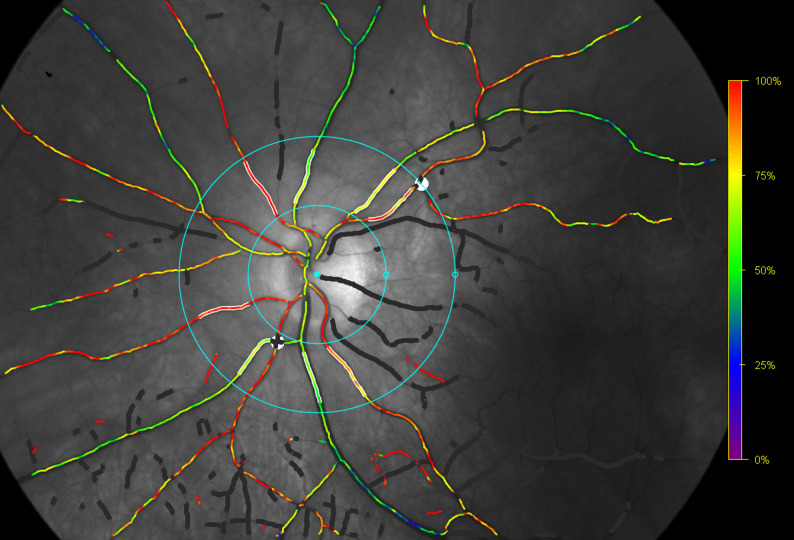 Figure 1
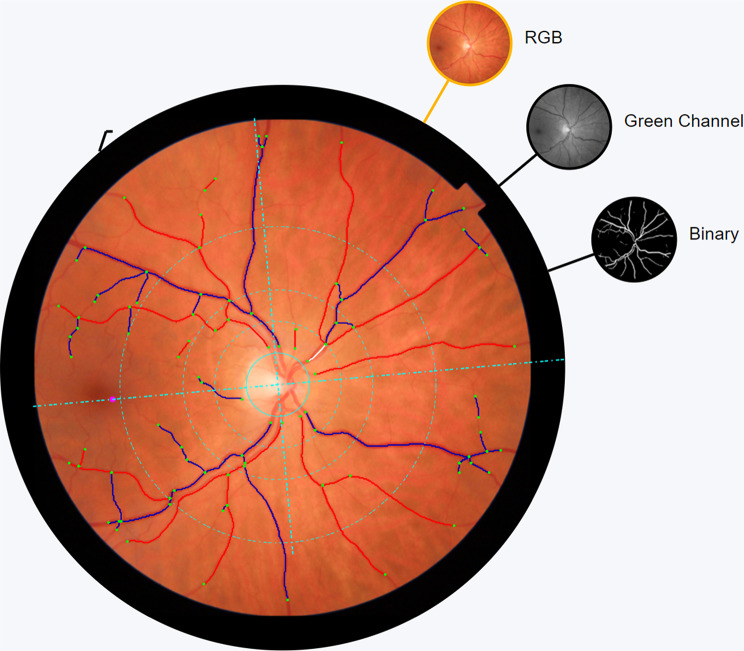 Figure 2
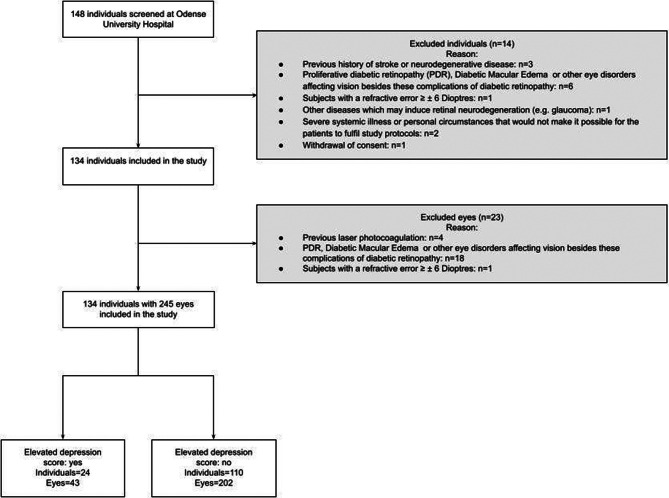 Figure 3
- —University of Southern Denmark
Peer Reviews
No public reviews on file for this paper yet. If you reviewed it on a platform where reviews are public (OpenReview, ICLR, NeurIPS, ICML), you can paste yours below so the community can read it here.
Videos
No videos yet. Explain this paper in a talk, walkthrough, or lecture? Add one.
Taxonomy
TopicsRetinal Diseases and Treatments · Retinal Imaging and Analysis · Ophthalmology and Visual Impairment Studies
Introduction
Depression is a mood disorder characterized by several symptoms that alter functionality of an individual [1]. It is a common psychiatric disease with an estimated lifetime prevalence of 15% which causes emotional, cognitive and behavioral changes [2]. Depression can be regarded as a common psychiatric complication of type 2 diabetes that is linked to poor health outcomes and higher mortality rates [3]. A systematic review of longitudinal studies indicated that the association between depression and diabetic retinopathy (DR) is probably bidirectional [4]. The burden of being diagnosed with DR or having impaired vision or other associated diabetes-related complications may contribute to depression. On the contrary, depression may increase the risk for incident DR by sub-optimal medication use and subsequent higher HbA_1c_ levels, a less healthy diet, and lower physical activity levels [5, 6]. The heterogeneity within the disease of depression also needs to be taken into account, as the clinical presentation and treatment response various according to subtypes of depression including melancholic and atypical depression. According to the Diagnostic and Statistical Manual of Mental Disorders-5, atypical depression is characterized by a reactivity in mood and increased appetite and hyperinsomina whereas melancholic depression is described as non-reactivity in mood, insomnia, loss of appetite, and weightless [1]. Recent studies have shown that atypical depression is associated with metabolic syndrome and inflammation, whereas melancholic depression is primarily associated with hyperactivity of the hypothalamic-pituitary-adrenal axis, which subsequently may affect the vasculature. Although multiple factors may explain the relationship between type 2 diabetes and depression, a shared vascular pathogenesis has been proposed as a common denominator, with endothelial dysfunction being associated with depressive symptoms [7]. If the vascular hypothesis of depression is correct, conceivably, it could be hypothesized that non-invasive parameters of the retina could be associated with depressive symptoms. Studies have reported an association between retinal parameters and depression with reduced retinal arteriolar tortuosity [8], and wider retinal arterioles [9], but results have been inconsistent with no association found between retinal vessels width and symptoms of depression in other studies [10, 11]. Most studies were comparing people with and without diabetes and depression, except for one cross-sectional study. That study found an association between wider retinal arterioles in individuals with type 2 diabetes and depression, but did not evaluate other relevant retinal parameters e.g. vessel tortuosity, density or fractal dimension [9].
We aim to investigate the association between retinal metabolism, vascular structure and depression in individuals with type 2 diabetes as well as the relationships between retinal parameters and melancholic and atypical depression symptomatology.
Subjects, material and methods
Subjects
We conducted a cross-sectional study with participants recruited from the Funen Diabetes Database (FDDB); a regional database of individuals diagnosed with diabetes [12]. Potential participants were invited by a secure digital mailbox which is mandatory for individuals above 15 years of age to sign up for. If exempted from this service e.g. blindness or physical impairment, a formal letter was sent. Individuals who were willing to participate were screened for inclusion and exclusion criteria (excl. criteria iii-v) by telephone for efficiency purposes. We included individuals of 65 years or more with type 2 diabetes for five years or longer. We excluded individuals in case of (i) prior history of diagnosis of stroke or any neurodegenerative disease, (ii) known present retinal neurodegeneration due to previous laser photocoagulation, glaucoma or diabetic macular edema, (iii) presence of other eye disorders (beside DR and complications here of) affecting vision, (iv) Refractive error ≥6 diopters (D), (v) media opacities impeding retinal imaging and (vi) severe systemic illness or personal circumstances, which prevents completion of the study protocol.
Systemic examination
All clinical visits were performed at the department of Ophthalmology, Odense University Hospital, Denmark between 25 November 2020 and 25 February 2022. General medical and ophthalmologic history were obtained. Duration of diabetes was obtained from FDDB, and in cases of discrepancy between the medical notes and the registry, the first registration date of type 2 diabetes diagnosis was used to calculate the duration of disease. Current use of antihypertensive, cholesterol lowering, glucose lowering, and antidepressant drugs were noted. Smoking was categorized as former, never and current user. Four-hour fasting blood samples were collected in order to examine HbA_1c_, lipid levels, and kidney function. Furthermore, a morning urine sample was collected to measure albumin excretion. With the individual sitting, brachial blood pressure was measured with Omron M6 (HEM-7001-E, Hoofddorp, The Netherlands), and mean arterial pressure was calculated as BP_d_+(BP_d_+BP_s_) / 3 where BP_d_ and BP_s_ are the diastolic and systolic blood pressure, respectively. Waist circumference, height and weight were measured and body mass index (BMI) calculated.
Depressive symptoms score
Depressive symptoms were measured using the Self-rated Inventory of Depressive Symptomatology (IDS-SR-30) questionnaire, which consists of 30 items that rate the nine symptoms domain used to define major depressive episodes (DSM-IV criteria) as well as items to define atypical and melancholic symptoms. All items are rated on a scale from 0 (symptom is not present) to 3 (strongest impairment) and the total score ranging from 0 to 84 points (only 28 of the 30 items are rated). In the present study, the IDS-SR-30 was used primarily as a dichotomous variable with a cut-off point of 18 or above which indicates the presence of relevant depressive symptomatology [13]. The IDS-SR-30 can also be used to distinguish between melancholic and atypical forms of depression. We used a previous definition of the subtypes developed by the STAR*D research group based on selected items of the IDS-SR-30 [14, 15]. On a continuous scale of either atypical or melancholic depressive symptomatology, we investigated the association with alterations in retinal metabolic and vascular parameters.
Ophthalmologic evaluation
Visual acuity, fundus examination and color fundus photography
Best-corrected visual acuity (BCVA) was obtained first, using Early Treatment Diabetic Retinopathy Study charts at 4 m (Precision Vision, Illinois, USA). Then, fundus examination was undertaken after pupillary dilation with tropicamide 10 mg/ml and phenylephrine 10%, followed by 45-degree 7-field color fundus photography (TRC-50DX fundus camera, Topcon, Tokyo, Japan). DR grading was carried out by a certified grader according to the International Clinical Diabetic Retinopathy Disease Severity Scale, with each eye categorized as level 0 (no DR), 1 through 3 (mild, moderate and severe none-proliferative DR, respectively), or 4 (proliferative DR) [16].
Retinal oximetry
Retinal vessel oxygen saturation measurements were performed using the Oxymap Model T1 (Oxymap, Iceland), utilizing 50-degree disc centered images [17]. Two concentric circles (1.5 and 3 times diameter of optic disc) were positioned around the optic disc. The largest venule and arteriole in each quadrant were marked in length between 50 and 200 μm in order to measure the mean retinal oxygen saturation as well as perform quadrant analysis. Images with a quality score below five were excluded according to the Oxymap software (Fig. 1).
Fig. 1. Retinal vessel oxygen measurements using the Oxymap Model T1. Overlaid colour map represents oxygen saturations in retinal vessels. The traced vessel representing the four retinal quadrants are highlighted within the circles and excluded vessel segments are covered in white
OCT-A parameters
Macula centered 4.5x.4.5 mm OCT-angiography (OCT-A) images were obtained with DRI OCT Triton (Topcon, Topcon Europe Medical B.V., The Netherlands). MATLAB (MathWorks, Natick, MA) was used for quantification of retinal microvasculature from OCT-A images [18]. The size of the foveal avascular zone (FAZ), vessel density, and fractal dimension in the superficial capillary plexus (SCP) and deep capillary plexus (DCP) were all retinal parameters of interest. Scans with image quality below 40, according to Topcon software, were excluded.
Retinal vessel analysis based on CPF
VAMPIRE-Web (Vessel Assessment and Measurement Platform for Images of the Retina, Universities of Dundee and Edinburgh, UK) [19], a semiautomatic program was used to measure retinal vessel width, density, tortuosity and fractal dimension in 45-degree disc centered, color fundus photos (TRC-50DX fundus camera, Topcon, Tokyo, Japan). In cases of vessel mislabeling or misdetection, the annotation was manually corrected. The retinal vessel width was calculated as the central retinal artery and vein equivalent (CRAE and CRVE, respectively) through areas of one-half to one disc diameter from the disc margin [20]. Vessel density, tortuosity and fractal dimension were measured in the area of one-half disc diameter to two disc diameters from the disc margin (Fig. 2) [21].
Fig. 2. Example of the VAMPIRE-Web software used to measure retinal vessel width, density, tortuosity and fractal dimension. Venules are delineated with blue whereas arterioles are outlined with red colours. White lines indicate excluded vessels
Statistical analysis
Descriptive statistics with categorical data are presented as numbers and percentages, and numerical data with medians and interquartile range (IQR). We applied Pearson chi-squared test (χ^2^) or Wilcoxonto test differences between groups (Table 1). We performed univariable logistic regression analysis to investigate the association between depression and baseline characteristics and retinal parameters (retinal oxygen saturation, vessel width, density, tortuosity, fractal dimension, area of FAZ and non-perfusion area) (Table 2). Cluster robust standard error was applied to the logistic regression model, when retinal parameters were investigated, while both eyes were included if eligible. We then performed multivariable logistic regression analysis adjusting for age, sex, HbA1c, diabetes duration, MAP, and history of depression (Table 2).
Lastly, we investigated whether presence of atypical or melancholic symptomatology on a continuous scale was associated with retinal vessel width, density, tortuosity, fractal dimension area of FAZ and non-perfusion area. This was performed in a multivariable mixed regression analysis with cluster robust standard error adjusted for age, sex, HbA1c, diabetes duration, MAP, and history of depression. Since the IDS-SR-30 scale was left-skewed and included zero, we tested whether the estimates differed between using the untransformed left-skewed scale and a square root-transformed scale. We found no substantial differences between the two models and thus present result from the analysis of the untransformed scale. We tested for interaction between age, sex and DR, which revealed interaction for DR and retinal oximetry, and therefore we performed stratified analysis (DR yes / DR no) (Supplementary material). Power calculation was performed in another study from our study unit [22]. P-values below 0.05 or 95% confidence intervals (CI) that did not include zero in the mixed regression model or CI that did not include 1.0 in the logistic regression model were considered statistically significant. Abovementioned statistics were performed with STATA version 17.0 (StataCorp LLC, College Station, TX, USA).
Results
We included 134 individuals with type 2 diabetes (Fig. 3), with a median age of 72 years (IQR: 69–76) and a median duration of diabetes of 19 years (IQR: 13–23). Of these participants, 70.2% were male. Based on IDS-SR-30 scores, 22% had depression (Table 1). Those with depression were more likely to have a previous history of depression (29% vs. 6%, p < 0.001), be current smokers (25% vs. 5% p = 0.004), have higher levels of total cholesterol (4.1 vs. 3.6 mmol/L, p = 0.021) and LDL cholesterol (2.0 vs. 1.5 mmol/L, p = 0.042), have an albumin excretion rate above 300 mg/g (17% vs. 1.8% p = 0.005) and be current users of antidepressants drugs (13% vs. 3%, p = 0.037). There was no difference in age, sex, civil status, BMI, waist circumference, BCVA or DR severity level between groups. Missing descriptive data included waist circumference (n = 1), total cholesterol (n = 1), LDL cholesterol (n = 2), estimated glomerular filtration rate (n = 1), and albumin excretion rate (n = 1). Of the 245 eyes examined, one person did not have retinal oxygen saturation measurement performed due to equipment failure. In addition, the VAMPIRE software were not able to calculate venular and arterial fractal in 4 and 33 eyes, respectively. Analysis of vessel width, density, fractal dimension area of the FAZ and area of non-perfusion was based on all included eyes.
Fig. 3. Flowchart of inclusion
Table 1. Characteristics of individuals and eyes with and without depression in people with type 2 diabetesDepressionp-valueYesNoIndividuals, n24110Sex, male %(n)66.7% (16)70.9% (78)0.68Age, years median (IQR)71.0 (69.0, 76.5)72.0 (69.0, 75.0)0.84 Current partner status %(n) Single37.5% (9)20.9% (23)0.084 Married or living together62.5% (15)79.1% (87)History of ischemic heart disease yes %(n)25.0% (6)20.0% (22)0.59History depression yes %(n)29.2% (7)6.4% (7)< 0.001Diabetes duration (years), median (IQR)19.5 (16.0, 23.0)18.0 (13.0, 24.0)0.43Present DR yes %(n)70.8% (17)68.2% (75)0.80BMI (kg/m^2^), median (IQR)29.3 (25.9, 34.2)29.3 (26.2, 32.4)0.95 Smoking %(n) Current25.0% (6)4.5% (5)0.004 Never33.3% (8)40.0% (44) Former41.7% (10)55.5% (61)MAP (mmHg), median (IQR)103.7 (94.5, 110.5)101.3 (93.3, 108.0)0.47Waist circumference (Cm), median (IQR)108.0 (98.0, 117.0)106.0 (99.0, 116.0)0.64Medication use %(n): Current use of antidepressants12.5% (3)2.8% (3)0.037 Antihypertensive treatment4.2% (1)15.5% (17)0.14 Statin treatment75.0% (18)82.7% (91)0.38 Antidiabetic treatment Glucose lowering treatment excluding insulin87.5% (21)87.3% (96)0.98 Insulin treatment62.5% (15)48.2% (53)0.20Laboratory tests: HbA_1c_ (mmol/L), median (IQR)59.5 (50.5, 68.0)55.0 (50.0, 62.0)0.30 Total cholesterol (mmol/L), median (IQR)4.1 (3.4, 5.0)3.6 (3.1, 4.1)0.021 LDL cholesterol (mmol/L), median (IQR)2.0 (1.3, 2.7)1.5 (1.2, 1.9)0.042 HDL cholesterol (mmol/L), median (IQR)1.3 (1.0, 1.6)1.2 (1.1, 1.6)0.89 Triglycerides (mmol/L), median (IQR)1.8 (1.2, 3.1)1.5 (1.0, 2.0)0.11 eGFR (ml/min/1.73 m2), median (IQR)76.0 (46.0, 90.0)77.0 (58.0, 88.0)0.91Albumin excretion rate (mg/g),** %(n)** <3070.8% (17)78.2% (86)0.005 30–30012.5% (3)20.0% (22) >30016.7% (4)1.8% (2)Eyes included43202Pseudophakia, yes %(n)30.2% (13)31.7% (64)0.85BCVA ETDRS letters, median (IQR)84.0 (80.0, 85.0)84.5 (81.0, 86.0)0.13Diabetic retinopathy,** ICDR %(n)** Level 025.6% (11)32.7% (66)0.71 Level 123.3% (10)19.8% (40) Level 246.5% (20)45.0% (91) Level 34.7% (2)2.5% (5)IQR: Interquartile range. ICDR: the International Clinical Diabetic Retinopathy. MAP: Mean arterial pressure. GDS-15: Geriatric depression scale. BMI: Body mass index. eGFR: estimated glomerular filtration. BCVA: Best corrected visual acuity. ETDRS: Early Treatment Diabetic Retinopathy Study
In a univariable logistic regression model, a previous history of depression was associated with depression (OR 6.06 95% CI 1.89–19.45, yes vs. no), total cholesterol (OR 1.59 95% CI 1.06–2.39 per 1 mmol/L increase), higher retinal arteriolar oxygen saturation in the lower temporal quadrant (OR 1.58 95% CI 1.08–2.30 per SD increase) and higher retinal venular oxygen saturation in the upper nasal quadrant (OR 1.48 95% CI 1.03–2.11 per SD increase) (Table 2). History of depression (OR 6.16 95% CI 1.8–20.8 pr. SD increase) and retinal arteriolar oxygen saturation in the lower temporal quadrant (OR 1.71 95% CI 1.07–2.75 pr. SD increase) was still statistical significant in the multivariable adjusted model. There was no association between retinal vessel width, tortuosity, vessel density, fractal dimension, area of FAZ, area of non-perfusion, mean retinal vessel oxygen saturation and depression.
Table 2. Uni- and multivariable logistic regression model with OR and 95% CI for baseline characteristics and retinal parameters associated with depressionIncrementUnivariable logistic regression OR (95% CI)p-valueMultivariable logistic regression OR (95% CI)p-value Individuals characteristics SexMale vs. female1.22 (0.48–3.13)0.681.13 (0.42–3.09)0.80Age1 year1.00 (0.91–1.09)0.981.02 (0.93–1.13)0.60Civil statusPartner vs. no partner2.27 (0.88–5.84)0.092.02 (0.73–5.54)0.17History of Ischemic heart diseaseYes vs. no1.33 (0.47–3.75)0.591.45 (0.46–4.57)0.53History of depressionYes vs. no6.06 (1.89–19.45)0.0026.16 (1.8–20.8)0.003History of smokingYes vs. no1.33 (0.53–3.38)0.551.32 (0.47–3.70)0.59Diabetes duration5-year1.06 (0.80–1.42)0.67Present DRYes vs. no1.13 (0.43–2.98)0.800.99 (0.33-3.00)0.99MAP5 mmHg1.07 (0.88–1.30)0.521.06 (0.85–1.31)0.62BMI1%-point1.00 (0.92–1.09)0.991.00 (0.91–1.09)0.98Abdominal circumferencePr. 1 cm1.00 (0.97–1.03)0.871.00 (0.97–1.04)0.92 Laboratory tests Total cholesterol1 mmol/L1.59 (1.06–2.39)0.031.63 (1.00-2.65)0.05HDL-cholesterol1 mmol/L0.89 (0.31–2.56)0.840.78 (0.20–2.97)0.71LDL-cholesterol1 mmol/L1.61 (0.99–2.62)0.061.65 (0.92–2.97)0.09Triglycerides1 mmol/L1.49 (1.00-2.23)0.051.43 (0.89–2.29)0.14eGFR1 ml/min/1.73 m21.00 (0.98–1.02)0.840.99 (0.97–1.02)0.48HbA1c10 mmol/L1.18 (0.82–1.69)0.381.10 (0.75–1.63)0.62Albumin excretion rateAbove vs. below 30 ml/min/1.73 m^2^1.48 (0.55–3.97)0.441.43 (0.49–4.21)0.51 Use of medication AntidepressantsYes vs. no5.05 (0.95–26.74)0.057Insulin useYes vs. no0.56 (0.23–1.38)0.210.58 (0.18–1.88)0.36Glucose lowering excl. insulinYes vs. no1.05 (0.35–3.13)0.830.95 (0.29–3.11)0.93Lipid lowering useYes vs. no0.63 (0.22–1.79)0.380.70 (0.22–2.27)0.56AntihypertensiveYes vs. no0.24 (0.03–1.88)0.170.20 (0.02–1.71)0.14 Retinal parameters IncrementUnivariable logistic regression^^ OR (95% CI)p-valueMultivariable logistic regression^^ OR (95% CI)p-valueRetinal vessel oxygen saturation Mean arterial saturationSD1.01 (0.96–1.06)0.691.02 (0.96–1.08)0.64 Mean venular saturationSD1.03 (0.99–1.07)0.161.03 (0.98–1.080.30Quadrant arterial analysis Upper nasalSD1.15 (0.80–1.67)0.451.18 (0.80–1.73)0.41 Lower nasalSD0.80 (0.48–1.34)0.390.94 (0.65–1.37)0.76 Upper temporalSD0.92 (0.68–1.25)0.600.86 (0.63–1.19)0.38 Lower temporalSD1.58 (1.08–2.30)0.021.71 (1.07–2.75)0.02Quadrant Venular analysis Upper nasalSD1.48 (1.03–2.11)0.031.38 (0.92–2.07)0.12 Lower nasalSD1.15 (0.79–1.67)0.471.04 (0.69–1.57)0.19 Upper temporalSD1.06 (0.74–1.51)0.741.04 (0.68–1.57)0.86 Lower temporalSD1.30 (0.88–1.92)0.191.38 (0.90–2.10)0.14OCT-A parameters macular regionSuperficial capillary plexusFoveal avascular zoneSD0.89 (0.67–1.19)0.420.88 (0.66–1.17)0.38Vascular density CircleSD1.02 (0.73–1.43)0.921.05 (0.74–1.49)0.79 Superior sectorSD1.03 (0.71–1.48)0.881.06 (0.72–1.56)0.77 Right sectorSD1.14 (0.86–1.52)0.351.16 (0.87–1.55)0.31 Inferior sectorSD0.98 (0.74–1.31)0.911.00 (0.76–1.33)0.98 Left sectorSD0.94 (0.66–1.33)0.730.97 (0.67–1.39)0.85Non-perfusion area CircleSD0.93 (0.67–1.30)0.680.91 (0.64–1.28)0.58 Superior sectorSD0.91 (0.64–1.28)0.580.88 (0.61–1.26)0.48 Right sectorSD0.81 (0.60–1.10)0.180.81 (0.59–1.10)0.17 Inferior sectorSD1.04 (0.79–1.37)0.771.03 (0.78–1.37)0.81 Left sectorSD1.07 (0.76–1.50)0.711.04 (0.73–1.49)0.83Fractal DimensionSD0.95 (0.69–1.30)0.730.97 (0.70–1.35)0.88Deep capillary plexusFoveal avascular zoneSD0.91 (0.66–1.26)0.570.90 (0.66–1.24)0.53Vascular Density CircleSD0.93 (0.69–1.24)0.600.94 (0.71–1.24)0.65 Superior sectorSD1.02 (0.77–1.37)0.881.05 (0.80–1.40)0.71 Right sectorSD1.20 (0.95–1.53)0.131.21 (0.95–1.54)0.12 Inferior sectorSD0.81 (0.59–1.13)0.220.81 (0.59–1.12)0.21 Left sectorSD0.89 (0.65–1.22)0.460.90 (0.66–1.22)0.49Non-perfusion area CircleSD1.06 (0.77–1.46)0.711.08 (0.77–1.50)0.66 Superior sectorSD0.94 (0.68–1.29)0.700.92 (0.68–1.25)0.61 Right sectorSD0.79 (0.59–1.06)0.120.80 (0.59–1.08)0.15 Inferior sectorSD1.35 (0.96–1.88)0.091.38 (0.97–1.95)0.07 Left sectorSD1.13 (0.82–1.54)0.461.13 (0.83–1.52)0.44Fractal dimensionSD0.97 (0.68–1.39)0.881.02 (0.72–1.43)0.92Retinal structural parameters (Vampire analysis)CRAESD0.96 (0.68–1.36)0.810.93 (0.64–1.34)0.68CRVESD1.27 (0.87–1.84)0.221.17 (0.80–1.71)0.43Arteriolar tortuositySD0.95 (0.63–1.44)0.811.0 (0.64–1.56)0.99Venular tortuositySD1.07 (0.79–1.46)0.651.12 (0.83–1.50)0.46Arteriolar densitySD0.91 (0.61–1.35)0.630.91 (0.63–1.31)0.60Venular densitySD1.06 (0.69–1.63)0.790.98 (0.67–1.43)0.90Arteriolar fractal dimensionSD0.96 (0.70–1.31)0.780.95 (0.67–1.35)0.78Venular fractal dimensionSD1.14 (0.76–1.72)0.521.06 (0.73–1.55)0.76Total fractal dimensionSD1.00 (0.69–1.45)1.000.98 (0.68–1.40)0.90^*^In analysis of retinal parameters cluster robust standard error was employed to the model while both eyes, if eligible, were included. The multivariate model included age, sex, HbA1c, diabetes duration, MAP, and history of depression. BMI: Body mass index. CRAE: Central retinal arterial equivalent. CRVE: Central retinal arterial equivalent. DR: Diabetic retinopathy. eGFR: estimated glomerular filtration. MAP: Mean arterial pressure. OR: Odds ratio. SD: standard deviation
Lastly, on a continuous scale of atypical or melancholic depressive symptomatology, we investigated the association with retinal metabolic and vascular parameters. We found an association between higher retinal arteriolar oxygen saturation in the lower temporal quadrant and melancholic depressive scores (β: 0.56 95% CI 0.09–1.30). We found a lower retinal venular saturation in the lower nasal quadrant and atypical depressive scores (β -1.39 95% CI -2.43-(-0.35)), but only in a subgroup of those with DR. Finally, we did not find any correlations between retinal vessel width, tortuosity, vessel density, fractal dimension, area of FAZ, area of non-perfusion with atypical or melancholic depression scores (Supplementary Tables 1–3).
Discussion
We found almost one-fourth to have depression in patients with type 2 diabetes, which is in line with results of earlier studies [23]. Alterations in measures of retinal arteriolar and venular oxygen saturation levels were found to be associated with some extent to depression and higher melancholic and atypical depressive score.
A few individuals had a previous history of depression or were current users of antidepressant medication, but still a high proportion had relevant clinical depression scores based on IDS-SR-30. The prevalence of depression in patients with type 2 diabetes has varied significantly with estimates between 5.0 and 71.8% [24]. Multiple factors may lead to this differences between reported prevalence in which differences in study population, ethnicity, socioeconomic status, accessibility to health care and method to assess depression may be the causes. In the present study we used the IDS-SR-30 which has previous been validated to be suitable for clinical use, and comparable with other well-known instruments for screening for depression including the Hamilton Rating Scale for Depression [25]. Still the accuracy of the tests can vary between populations and should be taken into account interpretation the results with risk of overestimating or underestimating the prevalence. Furthermore, there can be an overlap between symptoms of diabetes distress and depression e.g. fatigue which could result in false positive scores [26]. Nevertheless, the high-observed prevalence of depression in this study, indicate that a high proportion of individuals with type 2 diabetes express undetected depressive symptomatology, which may lead to poorer health outcomes.
It is over two decades since Alexopoulos et al. described the vascular depression hypothesis proposing that cerebrovascular disease may predispose geriatric depressive syndromes [27]. Since then, some evidence has been presented that vascular disease may be related to depression, but data has overall been inconsistent [28]. Endothelial dysfunction, characterized by circulating inflammatory biomarkers, has been associated with elevated depression scores, which again strengthens the hypothesis that microvascular abnormalities play a role in the pathogenesis of depression [7].
We found higher retinal arteriolar saturation in the lower temporal quadrant to be associated with depression, which we speculate to be associated with retinal flow. The retinal vessel oxygen saturation measurements are inversed affected by the retinal blood flow, meaning a decreased blood flow equals a higher saturation measurement [29]. Depression in elderly is associated with increased hypertension, diabetes and atherosclerosis, which subsequently leads to vascular wall hypertrophy, reduced arterial lumen, and reduced blood flow, subsequently resulting in a higher retinal arterial saturation [30]. Even though this may be a plausible pathophysiological pathway, we were not able to find a difference in retinal vessel width between the two groups.
We did not find a clear association between retinal oxygen saturation and melancholic or atypical depressive symptomatology. The heterogeneity within depression and variety in clinical presentation may also come to present in the retina meaning that certain depressive symptomatology present with different alterations in the retina, which may also be the reason for our findings of altered retinal saturation. It is important to address that previous studies have shown an adverse effect on retinal oxygen saturation as well as several retinal structural parameters in individuals with diabetes. These adverse effects may also be present to some extent in our study population. But, as we only investigated individuals with type 2 diabetes and the groups were comparable between diabetes duration, presence of DR, Hb1Ac levels and blood pressure, these adverse retinal effects may be balanced between groups.
It is also important to mention that several of our results were not in line with the vascular depression hypothesis. We found no associations between depression and retinal vessel structure, which is opposite to previous findings. A cross-sectional study reported that wider retinal arterioles were associated with major depression in persons with type 2 diabetes and major depression (n = 43), compared to individuals with type 2 diabetes without depression (n = 49) and a healthy control group without diabetes or depression (n = 54) [9]. Even though that study reports a difference in arteriolar width, the statically method described does not compare individuals with type 2 diabetes and depression but all three groups simultaneously. Therefore, it does not directly assess the difference in a population of type 2 diabetes alone.
Strengths of this study include the standardized software programs to assess retinal vessel parameters and vessel saturation. Limitations include the lack of masking of depressive scores to the researcher performing retinal analysis, with the exception of OCT-A analysis. Furthermore we did not have data on socio-economic factors which may have a role in depression. To our knowledge, no prior study has investigated the association between oxygen saturation in the retinal vasculature in people with type 2 diabetes and depression. Even though these are novel findings, caution should be made when interpreting the data presented, with the potential of spurious associations due to multiple testing.
In conclusion, we report that oxygen saturation in the retinal vasculature is altered in individuals with depression and type 2 diabetes. Therefore, this study partly supports the vascular hypothesis, but further studies are warranted to investigate, how retinal parameters may be used as a proxy to identify people with depression.
Supplementary Information
Below is the link to the electronic supplementary material.
Supplementary Material 1
The reference list from the paper itself. Each links out to its DOI / PubMed record.