Infectious Causes of Acute Febrile Illness in Belize, 2020–2022
Adrianna Maliga, Shannon E. Ronca, Russell Manzanero, Roberto Melendez, Sarah M. Gunter, Allison Lino, Joy Mackey, Andres Espinosa-Bode, Beatriz Lopez, Rafael Chacon-Fuentes, Freedom M. Green, Oluwadara Okeremi, Sarah Strobel, Daniel P. Rehm, Flor M. Muñoz, Loren Cadena

TL;DR
This study identifies various infectious causes of acute febrile illness in Belize from 2020 to 2022, highlighting key pathogens and improving disease monitoring.
Contribution
The study reports the first case of acute Chagas disease in Belize and provides comprehensive pathogen data from a new surveillance network.
Findings
Dengue was the most common vector-borne disease, with all four serotypes detected.
SARS-CoV-2 and human rhinovirus/enterovirus were the most common respiratory pathogens.
Diarrheagenic Escherichia coli and norovirus were the most common gastrointestinal pathogens.
Abstract
Acute febrile illness (AFI) surveillance networks can play a key role in identifying emerging pathogens and promoting global health security, especially for vulnerable populations in low- and middle-income countries. In January 2020, the Belize AFI Surveillance network was formed, and 5,643 participants were enrolled over the first 3-year period across 11 participating public hospitals. Using real-time polymerase chain reaction testing for vector-borne pathogen detection and BioFire® diagnostic testing for respiratory and gastrointestinal pathogens, the causes of illness were examined in relation to 54 pathogens in these participants. In response to the coronavirus disease 2019 pandemic, surveillance was expanded to detect severe acute respiratory syndrome coronavirus 2 (SARS-CoV-2) infections. Overall, one or more pathogens were successfully identified in 51% of participants, with 43…
Genes, proteins, chemicals, diseases, species, mutations and cell lines named across the full text — each resolved to its canonical identifier and authoritative record.
Click any figure to enlarge with its caption.
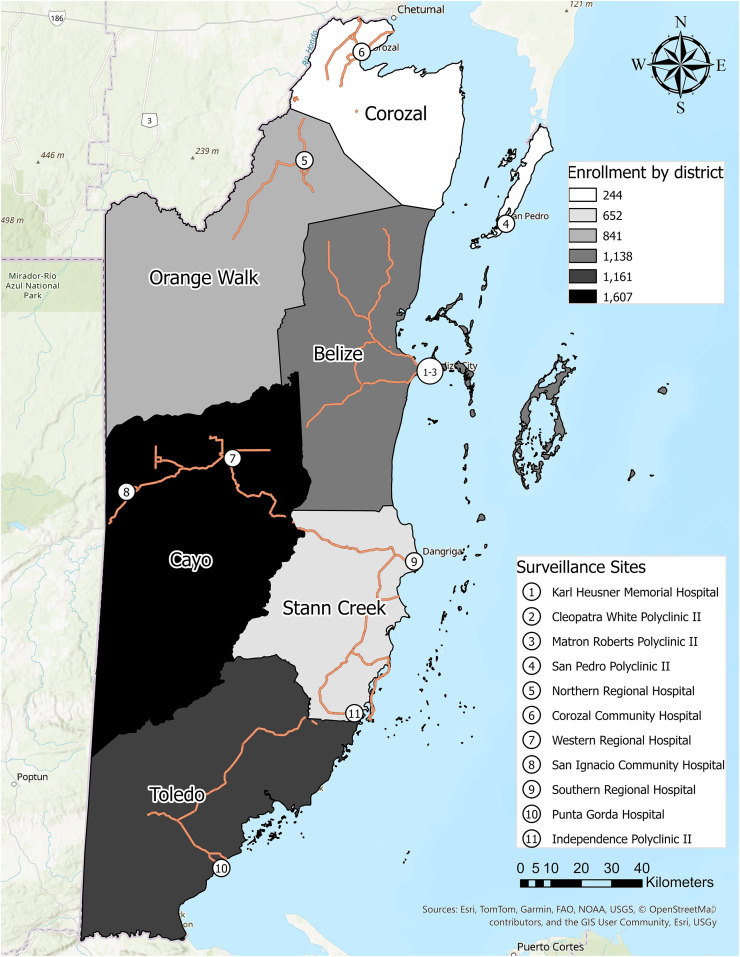 Figure 1
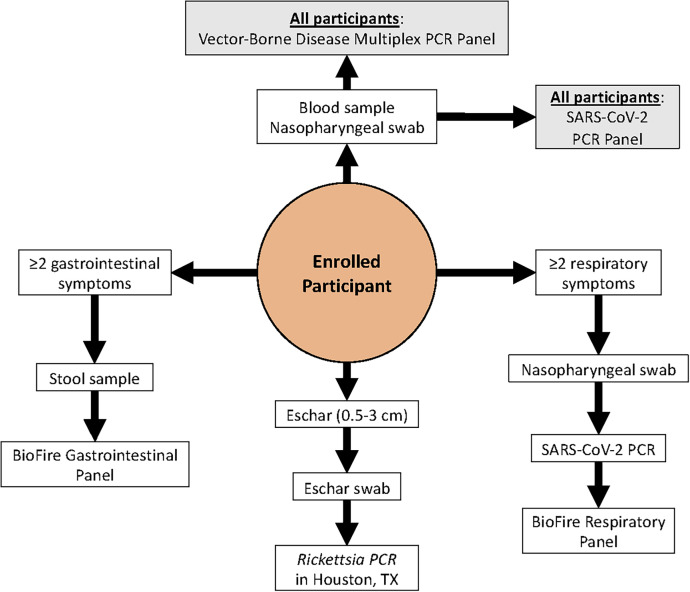 Figure 2
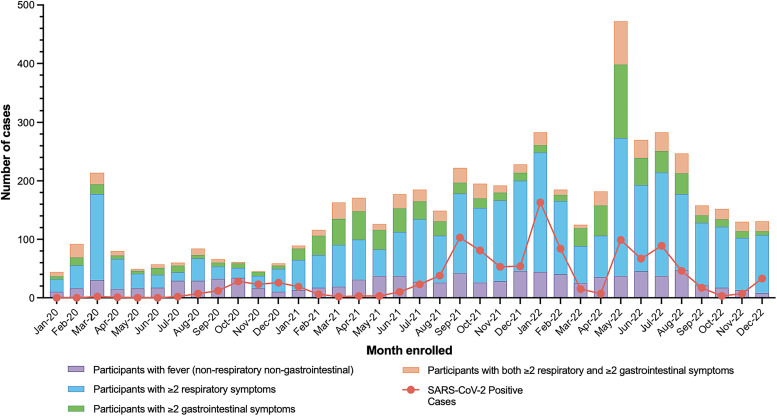 Figure 3
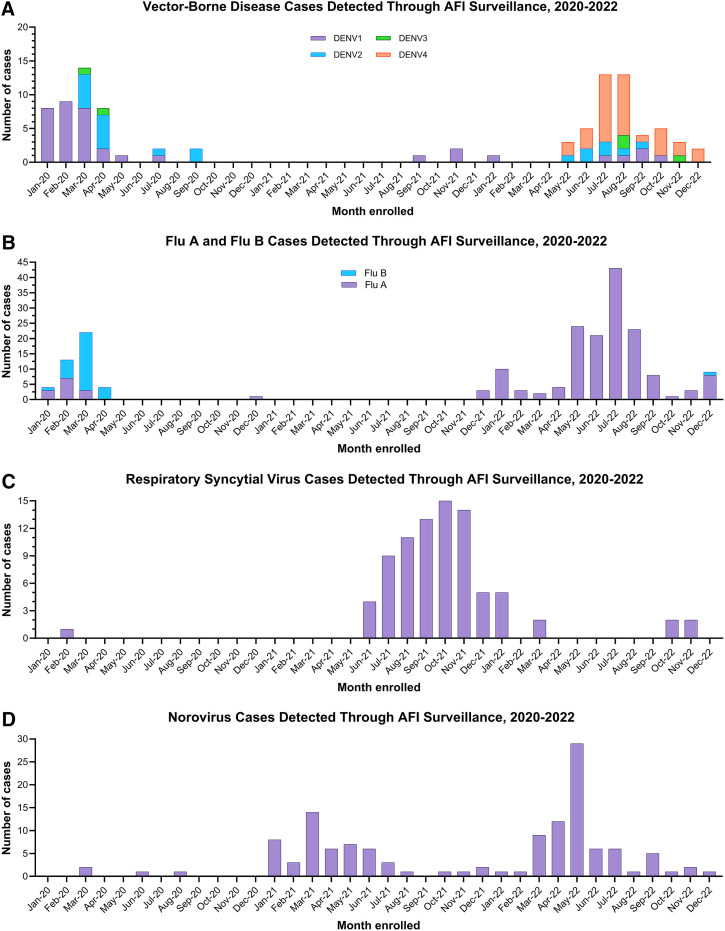 Figure 4
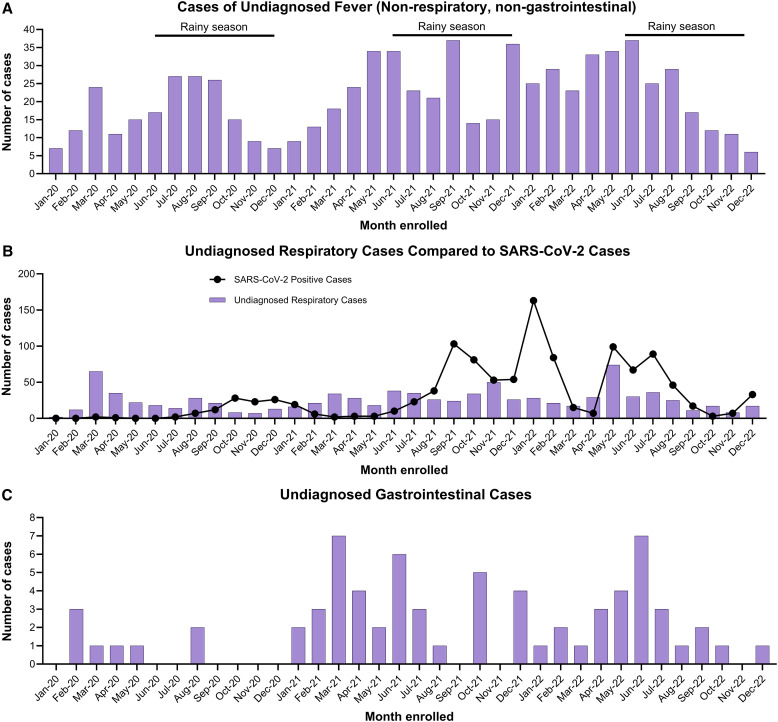 Figure 5
|
| % | |
|---|---|---|
| District Health Facility | ||
| Cayo District | ||
| San Ignacio Community Hospital | 1,019 | 18.1 |
| Western Regional Hospital | 588 | 10.4 |
| Toledo District | ||
| Punta Gorda Community Hospital | 1,095 | 19.4 |
| Belize District | ||
| Matron Roberts Polyclinic II | 127 | 2.3 |
| Karl Heusner Memorial Hospital | 31 | 0.6 |
| Cleopatra White Polyclinic II | 736 | 13.0 |
| San Pedro Polyclinic II | 85 | 1.5 |
| Stann Creek District | ||
| Independence Polyclinic II | 139 | 2.5 |
| Southern Regional Hospital | 512 | 9.1 |
| Orange Walk District | ||
| Northern Regional Hospital | 841 | 14.9 |
| Corozal District | ||
| Corozal Community Hospital | 243 | 4.3 |
| Other health facilities | ||
| Other health facility | 227 | 4.0 |
| Belize Healthcare Partners Limited (Belize District) | 109/227 | 48.0 |
| Central Medical Laboratory (Belize District) | 36/227 | 15.9 |
| Isabella Palma Polyclinic II (Toledo District) | 23/227 | 10.1 |
| San Antonio Polyclinic II (Toledo District) | 27/227 | 11.9 |
| Variable | % ( | % of | |
|---|---|---|---|
| Female | 2,970 | 52.6 | – |
| Pregnant | 70/2,970 | 2.3 | – |
| Age (median [range]) | 26.7 years | 61 days to 97.7 years | – |
| <5 years | 958 | 17.0 | – |
| 5 to 20 years | 1,084 | 19.2 | – |
| 21 to 40 years | 2,552 | 45.2 | – |
| 41 to 65 years | 1,090 | 19.3 | – |
| >65 years | 259 | 4.6 | – |
| Occupation ( | Of 1,534 | ||
| Not reported | 4,109 | 72.8 | – |
| Not applicable | 1,094 | 19.4 | 71.3 |
| Professional, technical, managerial | 403 | 7.1 | 26.3 |
| Student | 258 | 4.6 | 16.8 |
| Sales and services | 248 | 4.4 | 16.2 |
| Unemployed/retired | 196 | 3.5 | 12.8 |
| Domestic services | 125 | 2.2 | 8.1 |
| Skilled manual | 88 | 1.6 | 5.7 |
| Agriculture, forestry, fishery | 76 | 1.4 | 5.0 |
| Armed forces | 55 | 1.0 | 3.6 |
| Clerical support | 52 | 0.9 | 3.4 |
| Unskilled manual | 52 | 0.9 | 3.4 |
| Other occupation | 40 | 0.7 | 2.6 |
| Two or more occupations | 53 | 0.9 | 3.5 |
| Recent travel (within 30 days; | 547 | 9.8 | – |
| Exposure to ill individuals | 1,209 | 21.7 | – |
| Exposure to vectors | 3,630 | 64.9 | Of 3,630 |
| Mosquito | 3,523 | 63.0 | 97.1 |
| Sand fly | 1,211 | 21.7 | 33.4 |
| Tick | 197 | 3.5 | 5.4 |
| Flea | 195 | 3.5 | 5.4 |
| Triatomine | 50 | 0.9 | 1.4 |
| Other vector | 3 | 0.1 | 0.1 |
| Exposure to animals | 903 | 52.0 | of 903 |
| Dogs | 828 | 47.7 | 91.7 |
| Cats | 300 | 17.3 | 33.2 |
| Chickens or other poultry | 198 | 11.4 | 21.9 |
| Rodents | 39 | 2.2 | 4.3 |
| Pigs | 37 | 2.1 | 4.1 |
| Small ruminants (sheep and goats) | 29 | 1.7 | 3.2 |
| Cows | 27 | 1.6 | 3.0 |
| Bats | 11 | 0.6 | 1.2 |
| Horses | 6 | 0.3 | 0.7 |
| Other animal(s) | 16 | 0.9 | 1.8 |
| Self-Reported Symptoms | Total ( | % |
|---|---|---|
| General symptoms | ||
| Fever | 4,379 | 77.6 |
| Headache | 2,739 | 48.5 |
| Fatigue | 2,030 | 36.0 |
| Chills | 1,807 | 32.0 |
| Muscle pains and aches | 1,415 | 25.1 |
| Arthralgia | 1,138 | 20.2 |
| No appetite | 1,049 | 18.6 |
| Retro orbital pain | 597 | 10.6 |
| Unusual sweating | 318 | 5.6 |
| Rash | 195 | 3.5 |
| Dizzy | 170 | 3.0 |
| Stiff neck | 136 | 2.4 |
| Conjunctivitis | 122 | 2.2 |
| Weight loss | 108 | 1.9 |
| Swelling | 57 | 1.0 |
| Dysuria | 48 | 0.9 |
| Eschar | 43 | 0.8 |
| Swollen lymph nodes | 42 | 0.7 |
| Other general symptom(s) | 37 | 0.7 |
| Jaundice | 29 | 0.5 |
| Convulsions | 28 | 0.5 |
| Flush | 26 | 0.5 |
| Unusual bleeding | 18 | 0.3 |
| Paralysis | 7 | 0.1 |
| Chagoma or Romaña sign | 5 | 0.1 |
| Respiratory symptoms | ||
| Reported two or more respiratory symptoms | 3,725 | 66.0 |
| Cough | 3,365 | 59.6 |
| Runny nose/nasal congestion | 2,804 | 49.7 |
| Sore throat/painful swallowing | 2,387 | 42.3 |
| Sneezing | 1,559 | 27.6 |
| Shortness of breath | 1,190 | 21.1 |
| Chest pain | 895 | 15.9 |
| Loss of smell/taste | 404 | 7.2 |
| Wheezing | 384 | 6.8 |
| Other respiratory symptom(s) | 30 | 0.5 |
| GI symptoms | ||
| Reported two or more GI symptoms | 1,455 | 25.8 |
| Diarrhea | 1,286 | 22.8 |
| Vomiting | 1,124 | 19.9 |
| Abdominal or stomach pain | 1,040 | 18.4 |
| Nausea | 932 | 16.5 |
| Upset stomach | 564 | 10.0 |
| Black stool or blood in stool | 67 | 1.2 |
| Other GI symptom(s) | 13 | 0.2 |
| Vector-Borne Disease Infection | Total Tested, | 2020, | 2021, | 2022, | ||||
|---|---|---|---|---|---|---|---|---|
| Number of Positive Tests | % | Number of Positive Tests | % | Number of Positive Tests | % | Number of Positive Tests | % | |
| ZIKV | 0 | 0 | 0 | 0 | 0 | 0 | 0 | 0 |
| WNV | 0 | 0 | 0 | 0 | 0 | 0 | 0 | 0 |
| DENV (all serotypes) | 99 | 1.8 | 44 | 5.2 | 3 | 0.1 | 52 | 2.0 |
| DENV-1 | 41 | 0.7 | 29 | 3.4 | 3 | 0.1 | 9 | 0.3 |
| DENV-2 | 20 | 0.4 | 13 | 1.5 | 0 | 0 | 7 | 0.3 |
| DENV-3 | 5 | 0.09 | 2 | 0.2 | 0 | 0 | 3 | 0.1 |
| DENV-4 | 33 | 0.6 | 0 | 0 | 0 | 0 | 33 | 1.3 |
| CHIKV | 0 | 0 | 0 | 0 | 0 | 0 | 0 | 0 |
| 0 | 0 | 0 | 0 | 0 | 0 | 0 | 0 | |
|
| 1 | 0.02 | 1 | 0.1 | 0 | 0 | 0 | 0 |
| 0 | 0 | 0 | 0 | 0 | 0 | 0 | 0 | |
| Total | 2020 | 2021 | 2022 | |||||
|---|---|---|---|---|---|---|---|---|
| Respiratory Testing | Number of Positive Results/Number of Subjects Tested | % | Number of Positive Results/Number of Subjects Tested | % | Number of Positive Results/Number of Subjects Tested | % | Number of Positive Results/Number of Subjects Tested | % |
| SARS-CoV-2 RT-PCR | 1,127/4,516 | 25.0 | 102/632 | 16.1 | 395/1,766 | 22.4 | 630/2,118 | 29.7 |
| Human rhinovirus/enterovirus | 586/2,518 | 23.3 | 111/635 | 17.5 | 334/1,108 | 30.1 | 141/775 | 18.2 |
| Influenza A/H3 | 149/2,518 | 5.9 | 0/635 | 0.0 | 3/1,108 | 0.3 | 146/775 | 18.8 |
| Coronavirus OC43 | 94/2,518 | 3.7 | 0/635 | 0.0 | 91/1,108 | 8.2 | 3/775 | 0.4 |
| Human metapneumovirus | 91/2,518 | 3.6 | 14/635 | 2.2 | 34/1,108 | 3.1 | 43/775 | 5.5 |
| Respiratory syncytial virus | 89/2,587 | 3.4 | 1/635 | 0.2 | 71/1,108 | 6.4 | 17/844 | 2.0 |
| Adenovirus | 71/2,518 | 2.8 | 21/635 | 3.3 | 30/1,108 | 2.7 | 20/775 | 2.6 |
| Parainfluenza virus 3 | 66/2,518 | 2.6 | 1/635 | 0.2 | 15/1,108 | 1.4 | 50/775 | 6.5 |
| Coronavirus 229E | 39/2,518 | 1.5 | 9/635 | 1.4 | 2/1,108 | 0.2 | 28/775 | 3.6 |
| Influenza A | 43/2,591 | 1.7 | 1/635 | 0.2 | 0/1,108 | 0.0 | 42/848 | 5.0 |
| Influenza B | 31/2,591 | 1.2 | 30/635 | 4.7 | 0/1,108 | 0.0 | 1/848 | 0.1 |
| Parainfluenza virus 1 | 28/2,518 | 1.1 | 18/635 | 2.8 | 5/1,108 | 0.5 | 5/775 | 0.6 |
| Coronavirus NL63 | 24/2,518 | 1.0 | 2/635 | 0.3 | 21/1,108 | 1.9 | 1/775 | 0.1 |
| Parainfluenza virus 4 | 19/2,518 | 0.8 | 6/635 | 0.9 | 2/1,108 | 0.2 | 11/775 | 1.4 |
| Coronavirus HKU1 | 15/2,518 | 0.6 | 8/635 | 1.3 | 1/1,108 | 0.1 | 6/775 | 0.8 |
| Influenza A/H1-2009 | 13/2,518 | 0.5 | 13/635 | 2.0 | 0/1,108 | 0.0 | 0/775 | 0.0 |
| Parainfluenza virus 2 | 11/2,518 | 0.4 | 6/635 | 0.9 | 2/1,108 | 0.2 | 3/775 | 0.4 |
|
| 4/2,518 | 0.2 | 3/635 | 0.5 | 1/1,108 | 0.1 | 0/775 | 0.0 |
|
| 3/2,518 | 0.1 | 3/635 | 0.5 | 0/1,108 | 0.0 | 0/775 | 0.0 |
| Influenza A/H1 | 1/2,518 | 0.04 | 0/635 | 0.0 | 0/1,108 | 0.0 | 1/775 | 0.0 |
|
| 0/2,518 | 0.0 | 0/635 | 0.0 | 0/1,108 | 0.0 | 0/775 | 0.0 |
|
| 0/2,518 | 0.0 | 0/635 | 0.0 | 0/1,108 | 0.0 | 0/775 | 0.0 |
| One or more pathogens detected on BioFire® panel | 1,196/2,518 | 47.5 | 212/635 | 33.4 | 556/1,108 | 50.2 | 428/775 | 55.2 |
| Total Tested, | 2020, | 2021, | 2022, | |||||
|---|---|---|---|---|---|---|---|---|
| GI pathogen detected on BioFire® panel | Number of Positive Results | % | Number of Positive Results | % | Number of Positive Results | % | Number of Positive Results | % |
|
| 315 | 46.3 | 38 | 40.0 | 112 | 43.8 | 165 | 50.2 |
|
| 204 | 30.0 | 24 | 25.3 | 70 | 27.3 | 110 | 33.4 |
| Norovirus GI/GII | 130 | 19.1 | 4 | 4.2 | 52 | 20.3 | 74 | 22.5 |
|
| 116 | 17.1 | 25 | 26.3 | 34 | 13.3 | 57 | 17.3 |
| 110 | 16.2 | 16 | 16.8 | 40 | 15.6 | 54 | 16.4 | |
|
| 100 | 14.7 | 12 | 12.6 | 35 | 13.7 | 53 | 16.1 |
| Rotavirus A | 70 | 10.3 | 1 | 1.1 | 13 | 5.1 | 56 | 17.0 |
|
| 64 | 9.4 | 8 | 8.4 | 15 | 5.9 | 41 | 12.5 |
|
| 33 | 4.9 | 9 | 9.5 | 10 | 3.9 | 14 | 4.3 |
|
| 28 | 4.1 | 5 | 5.3 | 10 | 3.9 | 13 | 4.0 |
|
| 27 | 4.0 | 2 | 2.1 | 13 | 5.1 | 12 | 3.6 |
| Adenovirus F40/41 | 23 | 3.4 | 4 | 4.2 | 7 | 2.7 | 12 | 3.6 |
|
| 20 | 2.9 | 1 | 1.1 | 14 | 5.5 | 5 | 1.5 |
|
| 17 | 2.5 | 1 | 1.1 | 5 | 2.0 | 11 | 3.3 |
| Astrovirus | 14 | 2.1 | 1 | 1.1 | 7 | 2.7 | 6 | 1.8 |
| Sapovirus | 14 | 2.1 | 2 | 2.1 | 2 | 0.8 | 10 | 3.0 |
|
| 12 | 1.8 | 2 | 2.1 | 4 | 1.6 | 6 | 1.8 |
|
| 9 | 1.3 | 3 | 3.2 | 2 | 0.8 | 4 | 1.2 |
|
| 8 | 1.2 | 0 | 0.0 | 1 | 0.4 | 7 | 2.1 |
|
| 2 | 0.3 | 0 | 0.0 | 1 | 0.4 | 1 | 0.3 |
|
| 1 | 0.1 | 0 | 0.0 | 0 | 0.0 | 1 | 0.3 |
|
| 0 | 0.0 | 0 | 0.0 | 0 | 0.0 | 0 | 0.0 |
| Had one or more pathogens detected on BioFire panel | 575 | 84.6 | 76 | 80.0 | 206 | 80.5 | 293 | 89.1 |
- —Baylor College of Medicine in a cooperative agreement with the CDC
Peer Reviews
No public reviews on file for this paper yet. If you reviewed it on a platform where reviews are public (OpenReview, ICLR, NeurIPS, ICML), you can paste yours below so the community can read it here.
Videos
No videos yet. Explain this paper in a talk, walkthrough, or lecture? Add one.
Taxonomy
TopicsViral Infections and Outbreaks Research · Vibrio bacteria research studies · Mosquito-borne diseases and control
INTRODUCTION
Emerging and reemerging pathogens are global public health threats. Countries in Central America face disproportionately high risks for transmission because of large population centers, areas of extreme poverty, limited resources for surveillance and diagnostics, and tropical climates.1 In the Central American country of Belize, 41% of its ∼400,000 residents live in poverty,2 increasing the risk of infections and poor health outcomes. Additionally, with ∼1 million tourist visits each year, the risk of introducing and spreading vector-borne, respiratory, and enteric pathogens, both to and from the country, is amplified.3
Mosquito-borne viruses are common in Belize, especially during the rainy season (June to December). Dengue virus (DENV) outbreaks have been reported almost annually since the 1980s,4 and the first locally acquired cases of chikungunya virus (CHIKV) and Zika virus (ZIKV) were reported in 2014 and 2015, respectively.5??^–^8 With Aedes aegypti mosquito populations established throughout the region and limited resources for vector surveillance and control, pathogen transmission continues. West Nile virus (WNV) has been detected in birds in Central America, but no human cases have yet been identified.9^,^10 The autochthonous transmission of parasitic and bacterial vector-borne diseases (VBDs) also occurs; however, the true incidence and prevalence of these infections are not well documented because of limited diagnostics.11
In addition to VBDs, respiratory pathogens pose a significant global health threat, particularly in children. In 2008, Nair et al. estimated that 28,000 to 111,500 deaths in children <5 years of age were attributable to influenza-associated acute lower respiratory tract illness, with 99% of these deaths occurring in low- and middle-income countries (LMICs).12 Similarly, in 2015, 33.1 million respiratory syncytial virus (RSV) infections occurred in children in LMICs, in contrast to the 2.8 million cases that occurred in high-income countries.12^,^13 Infection with enteric pathogens also contributed to morbidity and mortality, with poor sanitation and high population densities in urban settings influencing ongoing transmission.14 Additionally, up to 50% of visitors to Central America (for 2 weeks or longer) are estimated to develop enteric infections, with foodborne transmission being a primary contributor.15^,^16 There is a clear need for enhanced surveillance and improved public health infrastructure to detect, report, and respond to infectious diseases.
Acute febrile illness (AFI) surveillance networks can play a key role in identifying emerging pathogens and promoting global health security, especially for vulnerable populations in LMICs.17 To better detect, characterize, and define these disease threats in Belize, Baylor College of Medicine (BCM), along with the Ministry of Health and Wellness (MOHW) of Belize and the US CDC, created a country-wide, multi-disciplinary AFI surveillance network. Vector-borne, respiratory, and enteric pathogens were monitored in hospitals and outpatient clinics (polyclinics) across the country to detect and respond to infectious disease threats. The study surveillance findings from 2020 to 2022, including the integration of severe acute respiratory syndrome coronavirus 2 (SARS-CoV-2) into emergency response surveillance at the onset of the pandemic, are presented in this work.
MATERIALS AND METHODS
Surveillance sites.
The Belize AFI surveillance network enrolled participants at all 11 MOHW-supported regional hospitals and polyclinics throughout the country. Each had established transportation networks for specimen transport to the MOHW Central Medical Laboratory in Belize City (Figure 1). Clinical sites include the Karl Heusner Memorial Hospital Authority, Matron Roberts Polyclinic II, Cleopatra White Polyclinic II, San Pedro Polyclinic II, and Dr. Otto Rodriguez in Belize District; the Corozal Community Hospital and Polyclinic in Corozal District; the Northern Regional Hospital and Polyclinic in Orange Walk District; the Western Regional Hospital and Polyclinic and San Ignacio Community Hospital in Cayo District; the Southern Regional Hospital and Polyclinic and Independence Polyclinic II in Stann Creek District; and the Punta Gorda Community Hospital and Polyclinic in Toledo District (Figure 1).
Map of enrollment sites. Pins indicate locations of the healthcare facilities participating in the acute febrile illness surveillance network.
Inclusion criteria.
Beginning January 16, 2020, patients presenting to participating sites were invited to enroll as study participants if their axillary, oral, or rectal temperature met or exceeded 38°C or if they presented with a history of new-onset objective or subjective fever within the past 7 days. All participants who were at least 60 days old were eligible for inclusion.
In response to the SARS-CoV-2 pandemic, on March 17, 2020, the inclusion criteria were expanded to include nonfebrile patients presenting with two or more respiratory symptoms, including cough, loss of taste or smell, sore throat, painful swallowing, wheezing, chest pain, sneezing, shortness of breath, runny nose, and nasal congestion. On September 29, 2020, the criteria were further expanded to include nonfebrile patients presenting with two or more gastrointestinal (GI) symptoms, including diarrhea, nausea, vomiting, abdominal or stomach pain, upset stomach, black stool, and blood in stool, as well as those considered high risk for SARS-CoV-2 infection because of a known exposure, occupation as a healthcare worker, residence in a nursing home or prison, recent travel to an endemic area, or atypical clinical presentation suspected to be caused by SARS-CoV-2 (Figure 2).
Participant testing algorithm based on clinical presentation for the acute febrile illness study. All enrolled participants received testings against the vector-borne disease panels, as well as additional testing related to symptoms at enrollment. Beginning August 19, 2020, all participants underwent severe acute respiratory syndrome coronavirus 2 testing using samples from a collected nasopharyngeal swab, regardless of respiratory symptoms.
Exclusion criteria.
Participants were excluded from the study if they 1) did not or were unable to provide consent or assent; 2) did not consent to follow-up 2 to 3 weeks after enrollment; 3) had been previously enrolled in the AFI surveillance study within the past 7 days or returned with an unresolved illness related to prior enrollment; 4) returned for the continuation of treatment of a known cause of fever; or 5) presented with a chief complaint of injury or trauma, a known cause of fever (nonenteric, non-respiratory, non-vector-borne), or other clear source of infection (i.e., abscess) when examined by a healthcare provider.
Enrollment procedures.
Written informed consent was obtained from all participants or their legal representative if the participant was unable to provide consent because of a medical condition or was under 9 years of age. For children aged 9 to 18 years, written assent was obtained in addition to parental or guardian permission. Participants were interviewed at the time of enrollment to capture demographic data (date of birth, sex, pregnancy status, race/ethnicity, and occupation), epidemiological information (travel history, exposure to ill individuals, and vector and animal exposure history), and clinical data (general, respiratory, and GI symptoms and coronavirus disease 2019 [COVID-19] vaccine history).
Sample collection.
Whole blood (WB; up to 3 mL collected in Ethylenediaminetetraacetic acid) and serum (up to 3 mL) were collected on all participants (Figure 2). From January 16, 2020 through August 19, 2020, nasopharyngeal (NP) swabs were only collected from those presenting with two or more respiratory symptoms. After August 19, 2020, NP swabs were collected from all participants for SARS-CoV-2 testing. Throughout the study period, stool samples were collected from participants presenting with two or more GI symptoms, and eschar swabs were collected from those presenting with an eschar between 0.5 cm and 3 cm in size.
Vector-borne disease real-time polymerase chain reaction testing.
Whole blood samples from all participants were preserved in Zymo 2X DNA/RNA shield (Zymo Research Inc., Irvine, CA) in a 1:1 ratio and then extracted using a modified protocol of Zymo Research Quick-DNA/RNA Pathogen Miniprep extraction kit (Zymo Research Inc.). Eluted nucleic acid samples were tested on two multiplex real-time polymerase chain reaction (RT-PCR) panels for ZIKV, WNV, pan-DENV, CHIKV, pan-Rickettsia, Trypanosoma cruzi (T. cruzi), and pan-Plasmodium (Supplemental Tables 1 and 2).18????^–^23 Specimens that were pan-DENV positive by RT-PCR were serotyped using RT-PCR.24 After it was determined that pan-DENV PCR exhibited low sensitivity for DENV-4 serotypes circulating in Central America, all specimens were retested using a multiplex DENV1–4 serotyping assay. Eschar swabs were extracted using a modified protocol for the Qiagen DNeasy Blood & Tissue Kit (Qiagen, Hilden, Germany) and tested for pan-Rickettsia via RT-PCR.
Respiratory pathogen testing.
Nasopharyngeal swabs from patients with two or more respiratory symptoms were tested on the BioFire® FilmArray Torch 2 System Respiratory 2 (RP2) panel according to the manufacturer’s instructions (BioFire Diagnostics, Salt Lake City, UT) until May 7, 2021, after which the BioFire Respiratory 2.1 panel with SARS-CoV-2 was implemented (BioFire Diagnostics; see product disclaimer). Both panels test for 22 viral and bacterial pathogens, including adenovirus; coronaviruses HKU1, NL63, 229E, and OC43; human metapneumovirus; human rhinovirus/enterovirus; influenzas A, A/H1, A/H1-2009, A/H3, and B; parainfluenza virus (1, 2, 3, and 4); RSV; SARS-CoV-2; Bordetella parapertussis; Bordetella pertussis; Chlamydia pneumoniae; and Mycoplasma pneumoniae (Supplemental Table 1). Beginning August 8, 2020, NP swabs from patients with respiratory symptoms were first screened via RT-PCR for SARS-CoV-2 using Charité – Universitätsmedizin Berlin Institute of Virology (Berlin, Germany) protocols and TaqPath 1-Step Multistep Master Mix (Applied Biosystems, Waltham, MA).25 If SARS-CoV-2 test results were negative, then samples from patients with two or more respiratory symptoms were tested on the BioFire respiratory panel. Because of resource constraints that occurred toward the end of the surveillance period, 67 COVID-19-negative subjects with fever and two or more respiratory symptoms were unable to be tested on the BioFire RP2 panel. As an alternative approach, samples were tested for influenza and RSV using the Xpert® Xpress CoV-2/Flu/RSV plus* (Cepheid United States, Sunnyvale, CA; see product disclaimer).
Gastrointestinal pathogen testing.
Stool samples were tested using the BioFire FilmArray Torch System (BioFire Diagnostics) on the GI panel, according to the manufacturer’s instructions. The GI panel is used to test for 22 pathogens, including Campylobacter jejuni, Campylobacter coli, Campylobacter upsaliensis, Clostridium difficile (C. difficile; toxin A/B), Plesiomonas shigelloides, Salmonella, Yersinia enterocolitica, Vibrio parahaemolyticus, Vibrio vulnificus, Vibrio cholerae (V. cholerae), enteroaggregative Escherichia coli (E. coli; EAEC), enteropathogenic E. coli (EPEC), enterotoxigenic E. coli (ETEC) lt/st, Shiga-like toxin-producing E. coli (STEC) stx1/stx2, E. coli O157, Shigella/enteroinvasive E. coli (EIEC), Cryptosporidium, Cyclospora cayetanensis (C. cayetanensis), Entamoeba histolytica (E. histolytica), Giardia lamblia, adenovirus F40/41, astrovirus, norovirus genotypes GI and GII (GI/GII), rotavirus A, and sapovirus I, II, IV, and V (Supplemental Table 1).
Data handling, storage, and analysis.
Demographic, epidemiological, clinical, and test result data were entered into a secure Research Electronic Data Capture database (REDCap, Vanderbilt University, Nashville, TN). Simultaneously, these results were entered into the Belize Healthcare Information System (BHIS), a nationwide electronic medical record system, so that participants’ healthcare providers would be informed of them. All positive pathogen results were communicated to the provider for clinical decision-making, treatment, and patient management. Data were analyzed using Stata v. 17.0 (StataCorp, College Station, TX), and data figures were generated using Prism 10 (Graphpad, San Diego, CA). Geospatial mapping was performed using ArcGIS Pro v. 3.0 (ESRI, Redlands, CA).
RESULTS
Enrollment and demographics.
Between January 16, 2020 and December 31, 2022, 5,643 participants were enrolled in the Belize AFI surveillance network. The highest number of participants was enrolled in Cayo District (28.5%; n = 1,607), followed by Toledo (19.4%; n = 1,095) and Belize Districts (17.3%; n = 979) (Table 1). In the first year, the highest monthly enrollment occurred in March 2020 (n = 217), which was followed by a steep decline in subsequent months, coinciding with COVID-19 pandemic lockdowns and curfews initiated on March 21, 2020 (Figure 3). Enrollment steadily increased in late 2020 as cases of SARS-CoV-2 emerged across the country.26^,^27 In February 2021, enrollment was strengthened when AFI surveillance field officers were hired and placed at participating healthcare facilities to assist with enrollment. Enrollment numbers increased in September 2021, January 2022, and May 2022, coinciding with waves of increased SARS-CoV-2 cases. Throughout the 3 years of AFI surveillance in Belize, participants with two or more respiratory symptoms made up 50% or more of participants enrolled monthly, whereas those with two or more GI symptoms comprised 4.6–28.3% of the total participants enrolled per month.
Epidemiological curve of all enrolled participants with acute febrile illness by month of enrollment date and disease presentation.
The median participant age was 26.7 years (range 61 days to 97.7 years), and almost one-third of the participants (n = 1,642; 29.1%) were 15 years of age or younger. Slightly more than half of the participants (n = 2,970; 52.6%) were female; 70 (2.3%) were pregnant. The most commonly reported occupations were professional/technical/managerial (n = 403; 7.1%) and student (n = 258; 4.6%); 1,094 (19.4%) participants responded as not applicable, with the majority of those being <5 years old (n = 1,037; 94.8%; Table 2). A total of 53 participants reported two or more occupations. Occupation was missing or not reported for 4,109 participants, including 2,581 adults (62.8%) and 1,030 children under 5 years of age (25.1%).
Only 9.8% of participants reported travel history within 30 days of presentation, and nearly one-quarter (21.7%) of participants reported contact with an ill individual within the previous 2 weeks (Table 2). More than half of participants (64.9%) reported exposure to vectors within the previous 2 weeks, with most reporting mosquitoes (97.1%). Other reported vectors included sand flies (33.4%), ticks (5.4%), fleas (5.4%), and triatomines (1.4%; Table 2). Approximately half of the participants (52.0%) reported animal exposure within 2 weeks of presentation; the most common contacts were dogs (91.7%), cats (33.2%), and chickens or other poultry (21.9%; Table 2).
Symptoms.
The median temperature of all participants was 37.9°C (with a range of 35.0–42.2°C). The median time from the onset of symptoms to enrollment was 2 days. The most commonly reported symptoms included fever (77.6%), headache (48.5%), fatigue (36.0%), chills (32.0%), muscle pain or aches (25.1%), arthralgia (20.2%), and loss of appetite (18.6%; Table 3). More than half of the participants (n = 3,725; 66.0%) reported two or more respiratory symptoms, whereas one-quarter of the participants (n = 1,455; 25.8%) reported two or more GI symptoms. The most commonly reported respiratory symptoms were cough (59.6%), runny nose or nasal congestion (49.7%), sore throat (42.3%), sneezing (27.6%), shortness of breath (21.1%), chest pain (15.9%), loss of smell or taste (7.2%), and wheezing (6.8%; Table 3). The most commonly reported GI symptoms included diarrhea (22.8%), vomiting (19.9%), abdominal or stomach pain (18.4%), nausea (16.5%), and upset stomach (10.0%; Table 3).
Vector-borne pathogen detection.
Almost all participants (n = 5,488; 97.3%) had WB samples available for testing on the VBD RT-PCR panels, with 1.7% of participants (91/5,488) testing positive. The most common VBD detected was DENV, with 99 DENV-positive cases, including 44 DENV-positive cases in 2020 (5.2% of the 845 tested), three cases in 2021 (0.1% of the 2,005 tested), and 52 cases in 2022 (2.0% of the 2,588 tested). One T. cruzi case was detected in 2020. All participants were negative for ZIKV, WNV, CHIKV, pan-Rickettsia, and pan-Plasmodium across all 3 years (Table 4). Eschar swabs were collected from 26 participants (0.47%), and none were found to be positive for Rickettsia spp. The majority of the VBDs found in 2020 (26/39; 67%), including one T. cruzi case, were detected during the first quarter of the year, with a dramatic drop in identified cases after the onset of the COVID-19 pandemic and nationwide lockdowns beginning in late March 2020. In 2020, the serotypes detected included DENV-1 (n = 29), DENV-2 (n = 13), and DENV-3 (n = 2). In 2022, DENV cases were detected between May and December, with a peak in July and August (Figure 4A). All four serotypes were detected; however, most participants were positive for DENV-4 (33/52; 63%). Those who were DENV-positive had two times higher odds of reporting mosquito exposures in the 2 weeks before illness onset compared with those who were DENV-negative (77% versus 62%; odds ratio = 2.0; 95% confidence interval = 1.3 to 3.2; P = 0.0032).
Number of disease cases detected via acute febrile surveillance in Belize (2020–2022) for vector-borne diseases, flu, respiratory syncytial virus, and norovirus.
Respiratory pathogen detection.
Most participants (n = 4,516; 80.0%) had NP swabs collected for SARS-CoV-2 PCR testing; 1,127 (25.0%) tested positive (Table 5). Of those tested for SARS-CoV-2, 3,161 (72.9%) presented with two or more respiratory symptoms, of whom 921 (29.1%) were positive. Among participants without two or more respiratory symptoms, 14.5% (171/1,178) were positive for SARS-CoV-2. The incidence of SARS-CoV-2 infection among participants was highest in 2022, with 630 (29.7%) testing positive (Table 5); one-quarter of these cases (n = 163; 25.9%) were detected during a surge in January 2022 (Figure 5B). Those who tested positive for SARS-CoV-2 but lacked two or more respiratory symptoms were significantly more likely to report two or more GI symptoms (37/171 [21.6%] versus 120/921 [13.0%]; P <0.01).
Undiagnosed cases in the Acute Febrile Illness Surveillance Study in Belize between 2020 and 2022 among participants with fever (non-respiratory, non-gastrointestinal), two or more respiratory symptoms, or two or more gastrointestinal symptoms.
Of the 4,380 participants with an NP swab collected, 2,518 (44.6%) were tested on the BioFire respiratory panel; almost half (n = 1,200; 47.7%) had at least one positive result (Table 5). Over the 3-year surveillance period, the most common respiratory pathogen detected on the BioFire respiratory panel was human rhinovirus/enterovirus (23.3%), followed by influenza A/H3 (5.9%), coronavirus OC43 (3.7%), human metapneumovirus (3.6%), and RSV (3.4%; Table 5). Of the 67 participants in 2022 who were tested on Xpert Xpress CoV-2/Flu/RSV plus, 11 (16.4%) were positive for influenza A, none were positive for influenza B, and six (9.0%) were positive for RSV. Influenza cases were detected during the first quarter of 2020 before lockdowns were conducted (Figure 4B), followed by an absence of detected cases for 19 months, except for a single positive case in December 2020. Most positive cases in 2020 were influenza B, whereas all positive cases in 2022 were influenza A. Conversely, most RSV cases were detected in 2021, with a peak in October 2021 (Figure 4B).
Gastrointestinal pathogen detection.
Stool was collected from 12.1% of participants (n = 680) and tested on the BioFire GI panel; most reported two or more GI symptoms (94%; 642/680). The majority (n = 575; 84.6%) yielded at least one positive result. Diarrheagenic E. coli pathogens (EPEC, EAEC, ETEC, EIEC, STEC, and E. coli 0,157) were common, with 69.4% (472/680) of participants having at least one strain detected. The most common diarrheagenic E. coli strains included EPEC (46.3%), EAEC (30.0%), EIEC (17.1%), and ETEC (16.2%; Table 6). Campylobacter bacterial infections were also prevalent (14.7%). Twelve participants tested positive for Vibrio species, including one child who tested positive for V. cholerae in 2021 and seven other participants who tested positive for V. cholerae in 2022. Three of the cholera patients in 2022 yielded a positive culture, and PCR and sequencing confirmed non-01/0139 (non-epidemic) strains.
Norovirus GI/GII was the most common viral GI pathogen detected (19.1%). Cases increased in January 2021 and continued through half the year, followed by a second wave beginning in March 2022, which peaked in May 2022 (Figure 4D). Rotavirus A was the second most detected viral GI pathogen (10.3%), with more cases detected in 2022 compared with the previous 2 years (Table 6). The majority (55/70; 79%) of positive rotavirus cases were among children 18 years of age and younger.
Although parasitic GI pathogens were less common, 9.4% of participants tested positive for Giardia. Cryptosporidium was the second most common parasitic infection, with 17 (2.5%) cases detected, whereas <1% of participants tested positive for C. cayetanensis and E. histolytica.
Unknown pathogens.
Approximately half of the participants (49.1%; 2,772/5,643) did not have a pathogen identified on testing. A higher percentage of febrile participants without respiratory or GI symptoms (77.8%; 756/972) were undiagnosed compared with those who reported two or more respiratory symptoms (41.3%; 908/2,197) or two or more GI symptoms (11.1%; 71/642). Cases of undiagnosed fever (non-respiratory, non-GI) appeared to have similar waves in all 3 years (Figure 5A), with increases in cases observed between May and September, which somewhat coincided with the rainy season (June to December). Increases in undiagnosed respiratory cases were observed at the beginning of the surveillance period (February to May 2020) and toward the end of the surveillance period (August to December 2022; Figure 5B). Undiagnosed GI (Figure 5C) case peaks mirrored increases in norovirus GI/GII cases (Figure 4D), with peaks between January and July 2021, as well as between March and September 2022.
Coinfections.
Coinfections were fairly common, with 601 participants (10.7%) testing positive for two or more pathogens. Coinfections were especially prevalent among those tested on the GI panel, with more than half of the participants (57.5%) having two or more pathogens detected; the most common coinfections were EPEC with EAEC, followed by EPEC with norovirus. Four or more pathogens were detected in 64 participants (2.1%). One 2.5-year-old child had eight pathogens detected, including adenovirus, coronavirus NL63, C. difficile, EAEC, EPEC, ETEC, EIEC, and Giardia. Fourteen participants were coinfected with a VBD and a respiratory pathogen (0.2%), nine participants were coinfected with a VBD and a GI pathogen (0.2%), 94 participants (1.7%) had a respiratory and GI coinfection, and two (0.04%) were coinfected with a VBD and respiratory and GI pathogens. Enterotoxigenic E. coli and human rhinovirus/enterovirus were most often detected in coinfection cases.
DISCUSSION
Before this AFI surveillance network was implemented, Belize had limited infrastructure and resources for detecting vector-borne, respiratory, and GI pathogens. Through the AFI surveillance program, Belize’s local capacity to diagnose 54 unique vector-borne, respiratory, and GI infections was markedly expanded. As a result, the first known case of acute Chagas disease was diagnosed in a 7-year-old child, leading to swift treatment and vector control measures.28 Along with VBD RT-PCR testing, the BioFire FilmArray Torch System was instrumental in expanding Belize’s diagnostic capabilities, and the GI panel enabled the detection of a small outbreak of non-epidemic V. cholerae, facilitating rapid response and control measures, thereby limiting its spread. Although BioFire is a cost-prohibitive platform for most LMICs, the comprehensive surveillance data produced in real-time provided an opportunity to define the key pathogens for future targeted testing using more sustainable approaches. Through comprehensive testing platforms, pathogens were successfully detected in half of the study participants over the 3-year surveillance period.
With the onset of the COVID-19 pandemic, testing was quickly expanded to include SARS-CoV-2. Unsurprisingly, SARS-CoV-2 was the most diagnosed pathogen among AFI cases, with one in four participants testing positive. The high incidence was partially driven by the decision to implement universal testing for SARS-CoV-2 regardless of presenting symptoms, as 9.2% of those without two or more respiratory symptoms tested positive for SARS-CoV-2 by PCR. The proportionally high rates of SARS-CoV-2 compared with other respiratory pathogens could also reflect changes in healthcare-seeking behaviors for non-COVID-19 illnesses during the pandemic. Those with mild symptoms may have elected not to seek care because of their perceived risk of being exposed to SARS-CoV-2 in a healthcare setting.29 Alternatively, non-pharmaceutical measures such as masks and quarantine measures likely played a role in limiting the transmission of other communicable diseases, especially in the first 2 years of the pandemic.30 This was likely the case with DENV because a sudden drop in cases was observed in 2020 at the onset of travel restrictions and quarantine measures, followed by only 3 detected cases in 2021, and the resurgence of cases in 2022 when restrictions were fully lifted. Ultimately, the SARS-CoV-2 pandemic exemplifies the importance of an adaptable AFI surveillance network to detect emerging infections in vulnerable and under-resourced settings.
Healthcare workers in resource-limited settings often empirically base their diagnoses on presenting symptoms and their knowledge of the local epidemiology of a disease.31^,^32 Through this enhanced AFI surveillance, surveillance findings could be communicated in real-time via automated data analytics presented in an online “story map” ArcGIS dashboard and weekly emails to stakeholders. These results not only informed timely public health responses but also provided healthcare providers with an evidence-based approach to patient assessment and care. Furthermore, the rapid turnaround time in communicating results enabled targeted therapies and infection control measures.33 Belize employs a country-wide electronic medical record system (BHIS), which has greatly improved communication of results to healthcare providers and public health officials.
Because of difficulties in collecting stool samples at the time of presentation, only approximately half of the participants (44.1%) who presented with GI symptoms could be tested on the GI pathogen panel. Nevertheless, the prevalence of GI pathogens in the population during the study period was successfully examined, with a high percentage (84.6%) of those tested having one or more pathogens identified. In a study on the patterns of illness among travelers returning to the United States, researchers reported acute diarrhea as one of the most commonly reported symptoms when returning from Central America.34 In another study, 63% of students who spent 5 weeks in Mexico developed diarrhea, with the majority of infections caused by ETEC and EAEC, which were also highly prevalent in the present study’s AFI population. Interestingly, almost half of the cases (42.7%) in the current study were positive for EPEC, which is higher than previously reported in Costa Rica (24%) and Guatemala (8% and 12% for hospitalized and outpatient diarrheal illness cases, respectively).35?^–^37
Norovirus was also a common GI pathogen detected in the present study, which is unsurprising, given its higher prevalence in LMICs compared with upper-middle- and high-middle-income countries.38 Rotavirus was the second most common viral GI pathogen, with the majority of cases presenting in children. Worldwide, rotavirus accounts for 37% of diarrhea-related deaths in children, with LMICs accounting for 92% of those deaths.39 In Belize, rotavirus vaccination is not included as part of the routine immunization schedule.39^,^40
Although the study panel of 54 pathogens was robust, it does not cover all potential disease-causing organisms in the region. The four arboviruses were chosen on the basis of their epidemiology in the Americas, but others in the flavivirus and alphavirus genera could be considered in future testing. In a syndromic surveillance study conducted in Ecuador, Peru, Bolivia, and Paraguay, additional viruses in the alphavirus and bunyavirus genera were included in testing, such as Venezuelan equine encephalitis virus, Mayaro virus, Oropouche virus, and Group C viruses.41 Much like in the present study, DENV was the most detected vector-borne virus.41 A large AFI surveillance study conducted in Puerto Rico from 2012 to 2015 revealed the presence of DENV 1–4, CHIKV, enterovirus, Leptospira spp., Burkholderia pseudomallei, and various respiratory pathogens.42 In the Puerto Rico study, the most common arbovirus was CHIKV, which reflected the widespread epidemic that occurred in 2014.43 In addition to the arboviruses listed above, other vector-borne and zoonotic pathogens to consider for inclusion are Leishmania spp., Ehrlichia spp., Borrelia spp., Leptospira spp., and Brucella spp. Although the BioFire panels are comprehensive, future respiratory and GI testing could include targeted diagnostics and sequencing to identify other pathogens in those who tested negative.
The pan-Rickettsia PCR test was designed to detect both spotted fever group and typhus group Rickettsia in both WB and eschar samples; however, the test yielded no positive results. It is possible that patients did not have high enough levels of bacteremia in their WB samples to be detectable via PCR, and other pathogens can cause eschar formation. Rickettsia-positive cases were expected in the present study because a previous study revealed that 54.0% of tested individuals were seropositive for spotted fever group Rickettsia in Belize.44 Future studies should be focused on the serological diagnosis of acute cases using both acute and convalescent specimens.
As with all surveillance efforts, the present study faced several limitations. One limitation is that the total number of patients with AFI who presented to each participating facility and would have been eligible for enrollment is unknown. This uncertainty limited the possibility of evaluating nonresponse bias, given that participants who enrolled may differ in important ways from those who did not enroll. Enrollment varied substantially by site and location, which could have been influenced by factors such as facility accessibility, healthcare provider participation in patient enrollment, and the presence of AFI technical staff to assist with enrollment. Surveillance system training and sensitizations were conducted at the onset of the study to provide knowledge and tools to encourage enrollment; however, staff turnover, transfers, and shortages, along with COVID-19 restrictions, may have impacted enrollment over time. Despite DENV being the predominant arbovirus in circulation in the Americas,45^,^46 this AFI surveillance system revealed relatively few cases of DENV, which may be due to physicians’ tendency to perform a dengue rapid test at the time of care rather than enroll suspected cases into the AFI surveillance system. Although enrollment was limited to those who presented within the first 7 days of symptom onset to optimize detection of pathogens using molecular diagnostics like PCR, there is the possibility of missing cases of disease if the number of circulating pathogens in the bloodstream is too low to detect. Alternatively, the detection of a pathogen may not necessarily indicate the etiology of the presenting illness, as some pathogens, particularly those on the GI panel, can occur in asymptomatic individuals. Finally, to conserve resources, BioFire respiratory panels were only run on those who first screened negative for SARS-CoV-2, which then limited the possibility of examining respiratory coinfections in SARS-CoV-2-positive patients.
CONCLUSION
The high enrollment across multiple healthcare facilities throughout the country, along with a robust and comprehensive pathogen testing panel, enabled this AFI surveillance network to successfully detect and further characterize the epidemiology of emerging and established vector-borne, respiratory, and GI pathogens in Belize. Importantly, this surveillance network proved adaptable to the rapid implementation of SARS-CoV-2 testing, and enrollment continued despite pandemic conditions, which provided critical support to the Belize MOHW. Similarly, continuous engagement and communication among the MOHW, BCM, and the CDC contributed to effective public health outcomes. With this infrastructure in place, the most common diseases responsible for febrile, respiratory, and GI illnesses in Belize could be identified. Important discoveries were also made, including the first reported case of acute Chagas disease in Belize and eight cases of V. cholerae. These data can be used to streamline and prioritize diagnostic testing for known common pathogens and facilitate the sustainability of AFI surveillance in the years to come.
Supplemental Materials
10.4269/ajtmh.25-0328Supplemental Materials
The reference list from the paper itself. Each links out to its DOI / PubMed record.
- 1Hotez PJ Damania A Bottazzi ME, 2020. Central Latin America: Two decades of challenges in neglected tropical disease control. P Lo S Negl Trop Dis 14: e 0007962.32214311 10.1371/journal.pntd.0007962 PMC 7098567 · doi ↗ · pubmed ↗
- 2Central Intelligence Agency, 2022. Belize. Available at: https://www.cia.gov/the-world-factbook/countries/belize/. Accessed October 5, 2022.
- 3Belize Tourism Board, 2024. Statistics. Available at: https://www.belizetourismboard.org/belize-tourism/statistics/. Accessed September 8, 2022.
- 4Dick OB Martín JLS Montoya R Hdel DJ Zambrano B Dayan GH, 2012. The history of dengue outbreaks in the Americas. Am J Trop Med Hyg 87: 584–593.23042846 10.4269/ajtmh.2012.11-0770 PMC 3516305 · doi ↗ · pubmed ↗
- 5Zeller H Van Bortel W Sudre B, 2016. Chikungunya: Its history in Africa and Asia and its spread to new regions in 2013–2014. J Infect Dis 214: S 436–S 440.27920169 10.1093/infdis/jiw 391 · doi ↗ · pubmed ↗
- 6Mitchell C; Pan American Health Organization, World Health Organization, 2014. Half the Population of the Americas is at Risk of Diseases Carried by Small Insects. Available at: https://www 3.paho.org/hq/index.php?option=com_content&view=article&id=9436:2014-half-population-americas-at-risk-diseases-carried-small-insects&Itemid=1926&lang=en#gsc.tab=0. Accessed September 8, 2022.
- 7Petersen LR Jamieson DJ Powers AM Honein MA, 2016. Zika virus. N Engl J Med 374: 1552–1563.27028561 10.1056/NEJ Mra 1602113 · doi ↗ · pubmed ↗
- 8Aliota MT, , 2017. Zika in the Americas, year 2: What have we learned? What gaps remain? A report from the Global Virus Network. Antiviral Res 144: 223–246.28595824 10.1016/j.antiviral.2017.06.001PMC 5920658 · doi ↗ · pubmed ↗