Global prevalence of different levels of anxiety and stress symptoms in healthcare students: A meta-analysis and meta-regression
Ying Xuan Loh, Ying Lau, Wen Wei Ang, Shean Ern Shannen Lee, Siew Tiang Lau

TL;DR
This study finds that healthcare students worldwide experience high rates of anxiety and stress, with factors like geography and study quality affecting prevalence.
Contribution
The paper provides the first global meta-analysis of anxiety and stress levels in healthcare students and identifies key factors influencing prevalence.
Findings
Moderate anxiety symptoms affect 22% of healthcare students globally.
Geographic region and study quality significantly influence prevalence estimates.
Stress symptoms are most commonly unspecified (36%) among healthcare students.
Abstract
There are limited reviews to report the different levels of anxiety and stress symptoms among students studying nursing, pharmacy, and allied health. To calculate the global prevalence of different levels of anxiety and stress symptoms among healthcare students and examine the factors that affect the different levels of prevalence estimates. A three-step comprehensive search of 10 databases was conducted. Meta-analysis, subgroup analyses, and meta-regression were performed using the meta package in R software. The Newcastle-Ottawa Scale and Grading of Recommendations Assessments, Development and Evaluation criteria were utilised for the quality appraisal of included studies and the certainty of the evidence, respectively. A total of 112 studies with 42,331 healthcare students across 43 countries were selected. The prevalences of unspecified, mild, moderate, severe, and extremely…
Genes, proteins, chemicals, diseases, species, mutations and cell lines named across the full text — each resolved to its canonical identifier and authoritative record.
Click any figure to enlarge with its caption.
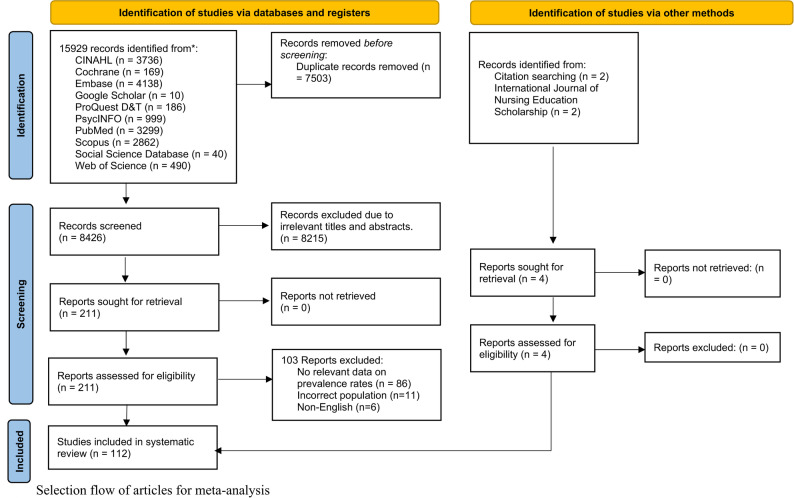 Figure 1
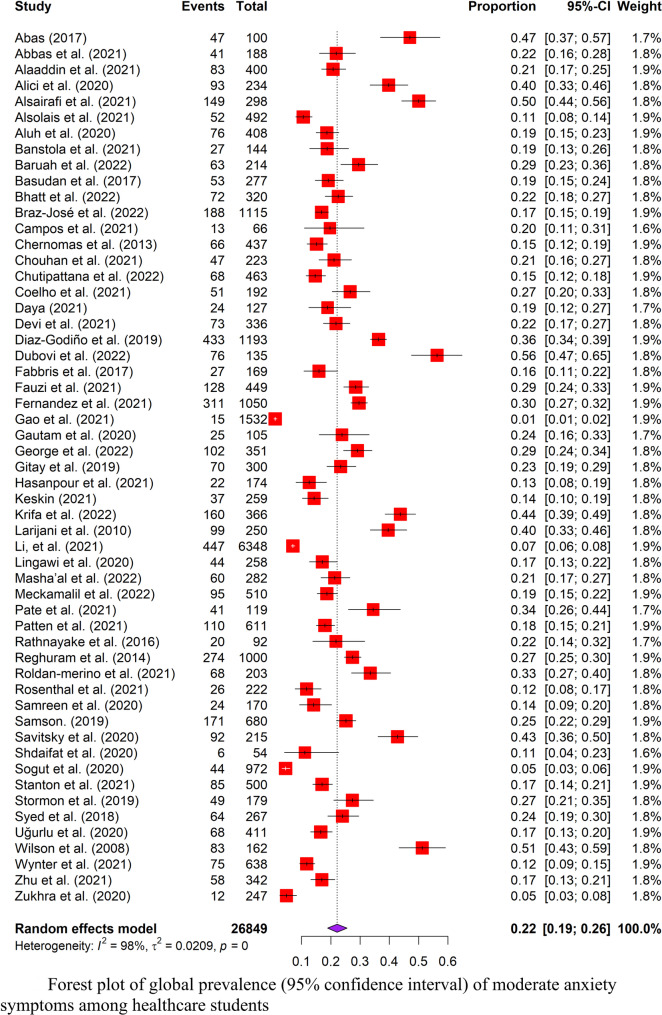 Figure 2
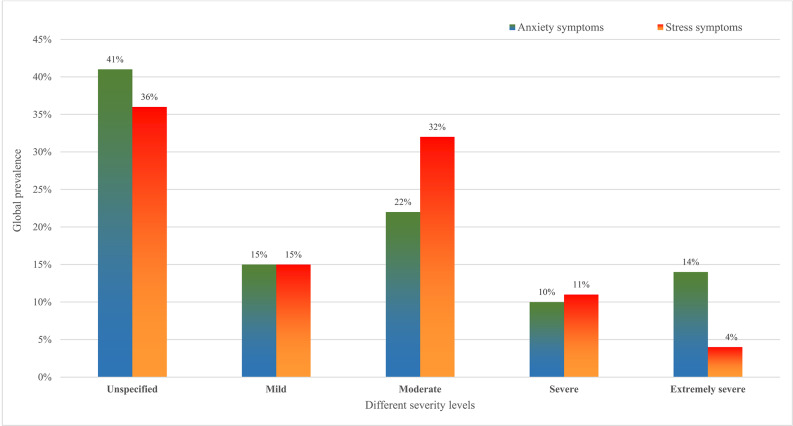 Figure 3
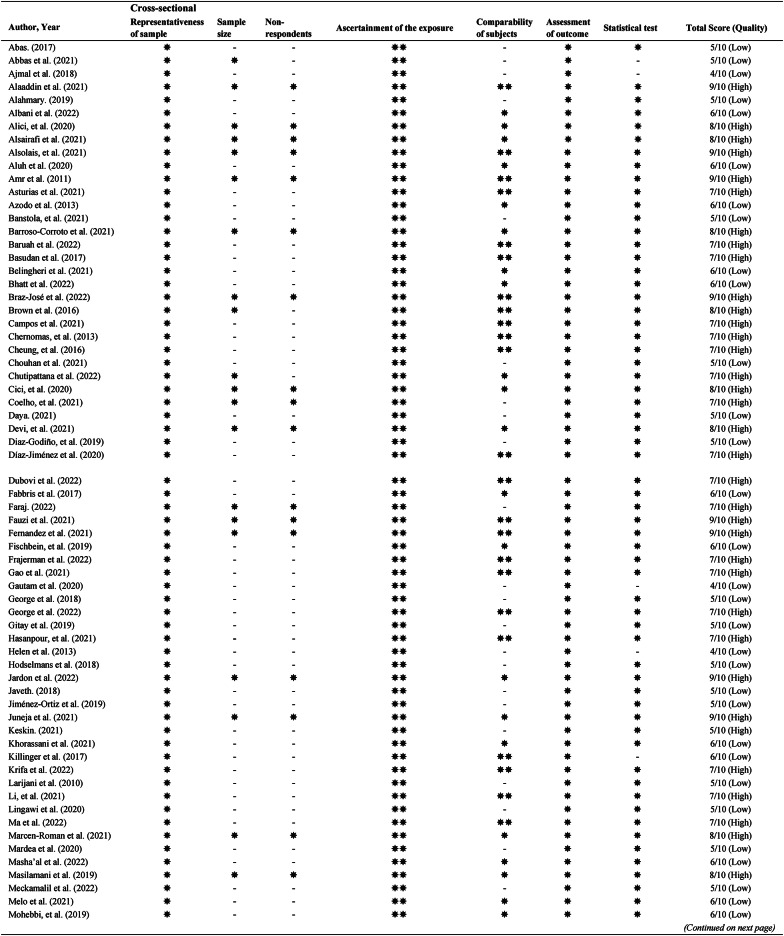 Figure 4
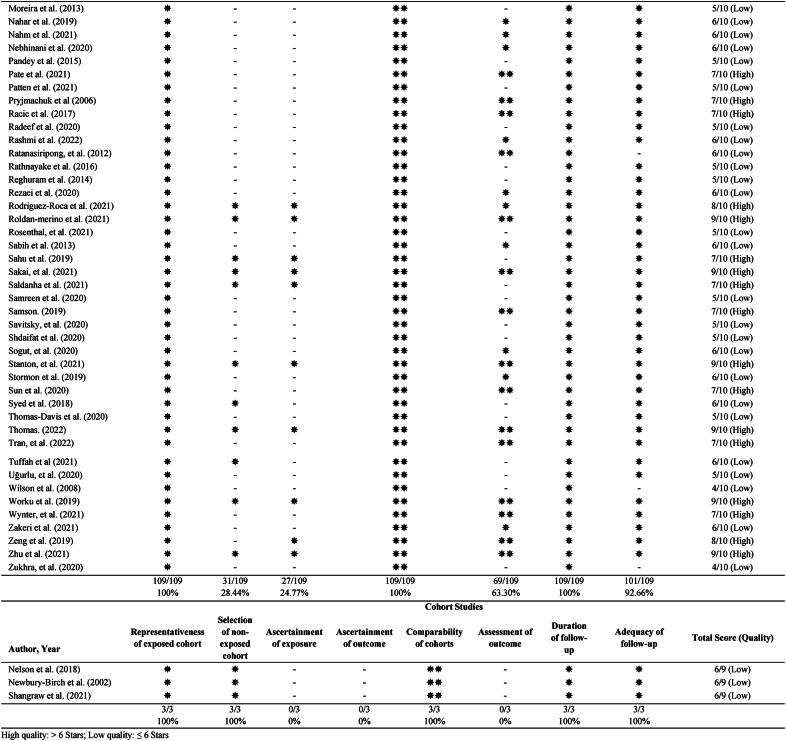 Figure 5
Peer Reviews
No public reviews on file for this paper yet. If you reviewed it on a platform where reviews are public (OpenReview, ICLR, NeurIPS, ICML), you can paste yours below so the community can read it here.
Videos
No videos yet. Explain this paper in a talk, walkthrough, or lecture? Add one.
Taxonomy
TopicsHealthcare professionals’ stress and burnout · Nursing education and management · Occupational Health and Burnout
Introduction
The field of healthcare education is recognised for its demanding nature, and students enrolled in these courses often experience higher levels of anxiety and stress due to their distinct curricula when compared to their peers at other universities [1], especially nursing, pharmacy, and allied health students [2–4]. In the pre-clinical years, students experience anxiety and stress due to workload, exams, and expectations [5, 6]. To put their education into practice, students in these courses are required to participate in clinical placements; yet the requirements to fulfil them are also a source of stress and anxiety [7]. The impact of anxiety and stress is multifaceted, leading to significant impacts on individuals, and their academic and professional careers. These healthcare students face various psychological consequences as a result of anxiety and stress, including fatigue, mood alterations, and sleep disturbances [5]. Furthermore, the burden of anxiety and stress brings about negative effects on overall academic performance, communication, professionalism, and empathy towards patients [8, 9]. If anxiety or stress symptoms are not recognised and relieved early, these may eventually affect the future workforce of healthcare professionals in providing quality care [10].
The prevalence of anxiety and stress symptoms has been well-researched among medical students [11–13], however, relatively few are known among nursing, pharmacy, dental, public health, and allied health students. Since these students make up more than half of the healthcare student population [14], there is an urgent need to assess the prevalence of anxiety and stress symptoms among these healthcare students. Two systematic reviews [15, 16] were found relating to the prevalence of stress and anxiety among nursing students. However, they have some methodological limitations on a few databases and included studies and a lack of assessment on the certainty of the evidence. None of them investigated the severity of anxiety and stress symptoms and factors affecting prevalence estimates of the different anxiety and stress symptom levels.
A previous study showed that the severity of anxiety and stress symptoms impacts outcomes differently [17]. By providing prevalence estimates on different levels of anxiety and stress symptoms, this valuable information will help healthcare educators improve awareness of the severity and place greater emphasis on different levels of screening, provide preventive intervention, and assist in the establishment of policies or services [15, 18]. The findings of this study provided healthcare educators with an understanding of the severity of these conditions among healthcare students and helped direct future tailored interventions to optimise learning and prepare students to manage their anxiety and stress symptoms effectively [15]. Hence, the objectives of this systematic review were to (1) calculate the global prevalence of different levels of anxiety and stress symptoms among healthcare students and (2) examine the factors that affect the different levels of prevalence estimates.
Methods
The Preferred Reporting Items for Systematic Reviews and Meta-Analysis Protocols (PRISMA) criteria were followed when conducting this research [19] (Table S1). The study’s protocol was registered under PROSPERO (CRD42023399499).
Eligibility criteria
To ensure relevant studies are identified, study selection is performed by strict eligibility criteria (Table S2) based on the population, condition and context framework [20] to ensure relevant studies are identified. The inclusion criteria for this review are as follows: (1) studies that were either experimental or observational, (2) included nursing, pharmacy, or allied health students, (3) showed a high prevalence of different severity of anxiety and stress symptoms; the severity was classified into unspecified (did not provide a specific level of anxiety and stress symptoms), mild, moderate, severe, and extremely severe severity is according to the corresponding scales, and (4) used reliable and validated measurement scales with cut-off points. Given that many studies investigated the prevalence of mental health in medical students, we excluded medical students from this review. No limits were placed on the publication year, and the language was limited to English. Published and unpublished studies were included.
Search strategy
The search strategy and process were guided by a three-phase process as recommended by the Joanna Briggs Institute (JBI) Manual for Evidence Synthesis [21]. The first reviewer (YXL) worked with an experienced medical librarian to build the index and key phrases (Table S3). Eight databases including the Excerpta Medica Database (EMBASE), the Cumulative Index to Nursing and Allied Health Literature (CINAHL), the ProQuest Social Science Database, PsycINFO, PubMed, Scopus, and Web of Science—were searched for studies. Google Scholar and ProQuest Theses and Dissertations were used to look for grey literature. Databases including electronic and gray literature were searched until December 2022. Boolean operators were used to combine important phrases, and appropriate truncations were made. Ultimately, an exhaustive manual search was conducted across pertinent journals and citations to find all relevant papers.
Study selection and process
EndNote 20 software was used to import and handle the search results [22]. Following the removal of duplicates, the study titles and abstracts were evaluated by two separate reviewers (YXL and SESL). If the two reviewers could not agree, a third reviewer (STL) was consulted. Finally, the complete manuscripts of the residual papers were acquired and evaluated for pertinence. The PRISMA flow diagram showed the outcomes of the selection procedure.
Data extraction
The data extraction form was modified based on the JBI Manual for Evidence Synthesis for Systematic Reviews of Prevalence and Incidence Data [20]. Data extracted included the last name of the first author, year of publication, geographical regions, study design, nature of the population, portion of gender, mean age, sample size, response rate, measurement tools used to assess anxiety or stress symptoms, and cut-off scores used. The global prevalence of anxiety or stress symptoms with five different severities was included, namely unspecific, mild, moderate, severe, and extremely severe. The period of data collection was before or after COVID-19. Pilot testing of the form was done on five studies to identify any possible missing data, and adaptations were made accordingly. Two independent reviewers (YXL and SESL) carried out the data extraction.
Quality assessment
The Risk of Bias Tool (ROB) version 2 was used for experimental studies [23]. The Newcastle Ottawa Scale (NOS) was used to rate cross-sectional, cohort, or case-control studies [24]. A study is considered high quality if it is rated more than 6 stars, while a low-quality study would have 6 stars or less. Two independent reviewers (YXL and SESL) carried out the quality assessment. If an agreement could not be reached, a third author (YL) was consulted. The Grading of Recommendation, Assessment, Development, and Evaluation (GRADE) criteria were used to rate the overall certainty of evidence [25, 26]. The criteria look at the risk of bias, inconsistency, indirectness, imprecision, and publication bias. The GRADE was rated from very low to high. Publication bias was analysed using a funnel plot and Egger’s regression test [27, 28]. Evidence of publication bias was found if the asymmetry of the funnel plot and p-value of the Egger test were < 0.05.
To guarantee consistency between the two reviewers for the selection of articles, individual quality, and overall quality of evidence ratings, inter-rater reliability was determined using Cohen’s kappa statistic (κ). According to McHugh (2012), values ranging from 0.01 to 0.20 were considered to indicate none to minor agreement, 0.21–0.40 to be fair, 0.41–0.60 to be moderate, 0.61–0.80 to be considerable, and 0.81–1.00.81.00 to be virtually perfect agreement [29].
Data synthesis
Statistical analyses for this review were conducted using the meta package in R software (Version 4.3.1) [30, 31]. Meta-analysis was performed where the prevalence of anxiety and stress symptoms retrieved from included studies were pooled and reported with 95% confidence intervals (CI). The prevalence (P) of stress and anxiety symptoms was calculated using the following equation:
\documentclass[12pt]{minimal} \usepackage{amsmath} \usepackage{wasysym} \usepackage{amsfonts} \usepackage{amssymb} \usepackage{amsbsy} \usepackage{mathrsfs} \usepackage{upgreek} \setlength{\oddsidemargin}{-69pt} \begin{document}$$\begin{aligned}&\:\mathrm{Prevalence}\:{(P)}\:\\&\quad=\:\frac{\text{number of }\text{healthcare students}\text{ anxiety }\mathrm{stress}\,\text{}\mathrm{symptoms}\text{}\mathrm{(n)}}{\mathrm{t}\mathrm{o}\mathrm{t}\mathrm{a}\mathrm{l}\:\mathrm{n}\mathrm{u}\mathrm{m}\mathrm{b}\mathrm{e}\mathrm{r}\:\mathrm{o}\mathrm{f}\:\mathrm{h}\mathrm{e}\mathrm{a}\mathrm{l}\mathrm{t}\mathrm{h}\mathrm{c}\mathrm{a}\mathrm{r}\mathrm{e}\:\mathrm{s}\mathrm{t}\mathrm{u}\mathrm{d}\mathrm{e}\mathrm{n}\mathrm{t}\mathrm{s}\:\mathrm{s}\mathrm{a}\mathrm{m}\mathrm{p}\mathrm{l}\mathrm{e}\mathrm{d}\:\left(\mathrm{N}\right)},\end{aligned}$$\end{document}where the number of healthcare students with anxiety or stress symptoms (n) was divided by the total number of healthcare samples (N) [32]. The prevalence estimates of anxiety and stress symptoms were calculated using a random effect model guided by the Hartung-Knapp-Sidik-Jonkman (HKSJ) method [33]. The Freeman-Tukey double arcsine transformation was used [34]. The random effects model was chosen as it involves an assumption of estimated effects from various studies [35]. Heterogeneity between pooled studies was reported using Cochran’s Q and I^2^ statistics. The interpretation of I^2^ values is as follows: 75% to 100% suggest considerable heterogeneity; 50% to 90% suggest substantial heterogeneity; 30% to 60% suggest moderate heterogeneity; 0% to 40% might not be important [35].
Additional data analysis
For categorical and continuous covariates, meta-regression and subgroup analyses were used to investigate the sources of heterogeneity [36]. Subgroups were categorised according to types of students (nursing vs. non-nursing), type of measurement tools (DASS vs. non-DASS), and geographical regions (Africa/Middle East, America, Asia Pacific, Europe, or Oceania), and data collection period (pre- vs. post-COVID pandemic). A p-value of < 0.1 indicates the subgroup analysis has a statistically significant difference between subgroups [37]. Meta-regression was performed to examine the effects of covariates on study effect size. The estimate (β) indicates the strength and direction of the relationship between our outcome (global prevalence and severity of anxiety or stress symptoms) and the continuous covariates (NOS scores, sample size, and publication year). We adopted p-values of 0.05 to indicate a significant effect of meta-regression analysis [38].
Results
Search results
Ten databases were searched, and the results showed 15,929 records, as shown in the PRISMA flowchart (Fig. 1). An additional four studies were found by searching for citations and target journals. Using EndNote 20 software, duplicates were eliminated, and 8,215 studies’ titles and abstracts were screened following eligibility requirements. The remaining 211 articles’ full texts were examined. One hundred and three reports (Table S4) were excluded because they lacked prevalence information, had the wrong population, or were non-English. Finally, a total of 112 studies [39–150] were included.
Fig. 1. Selection flow of articles for meta-analysis
Study characteristics
Table 1 displays the characteristics of 112 studies totalling 42,331 healthcare students from 20 healthcare courses in 43 countries. Sample sizes varied between 29 [141] and 6,348 [96], and the mean age varied between 18.8 [49] and 38 [59] years old. Asia accounted for 64 studies (57.14%), followed by America (number of studies, k = 25, 22.32%), Europe (k = 13, 11.61%), Africa/Middle East (k = 6, 5.36%), and Oceania (k = 4, 3.57%). Anxiety and stress symptoms were measured on difficult scales, and one third of them (33.03%) used scale was the 21-item Depression Anxiety Stress Scale (DASS-21) [151]. Two subscales of DASS measure both anxiety and stress symptoms in individuals [151].
Table 1. Characteristics of included studiesAuthors (Year)CountryStudy designType of studentsGender (%)Age (Mean/median/range)Sample size (n)Response rate (%)OutcomeScaleCut-offBefore/after COVIDAbas. (2017)IraqCross-sectionalNursingM: 16F: 84NR100100AnxietyBAINRBeforeAbbas et al. (2021)PakistanCross-sectionalPhysiotherapyM: 43.1F: 56.9Mean: 23.33188100AnxietyGAD-7GAD-7 ≥ 5BeforeAjmal et al. (2018)Saudi ArabiaCross-sectionalDentalM: NRF: NRNR122100AnxietyHADHAD ≥ 8BeforeAlaaddin et al. (2021)Saudi ArabiaCross-sectionalPharmacyM: 32.5F: 67.5NR400100AnxietyStresssDASS-21 (A)DASS-21 (S)NRBeforeAlahmary et al. (2019)Saudi ArabiaCross-sectionalDentalM: 8.6F: 91.4Range: 20–35105NRAnxietyHADS (A)HADS (A) ≥ 11BeforeAlbani et al. (2022)GreeceCross-sectionalNursingM: 13.5F: 86.5Mean: 22.8200NRAnxietyHADS (A)HADS (A) ≥ 8AfterAlici et al. (2020)TurkeyCross-sectionalNursingM: 32.1F: 67.9Mean: 20.1223478AnxietyBAIBAI ≥ 10AfterAlsairafi et al. (2021)KuwaitCross-sectionalHealthcare studentsM: 10.4F: 89.6NR298NRAnxietyGAD-7GAD-7 ≥ 5AfterAlsolais et al. (2021)Saudi ArabiaCross-sectionalNursingM: 44.3F: 55.7Mean: 21.7749246.5AnxietyStressDASS-21 (A)DASS-21 (S)NRAfterAluh et al. (2020)NigeriaCross-sectionalPharmacyM: 49.3F: 50.7Mean: 22.5740813.32AnxietyStressDASS-21 (A)DASS-21 (S)DASS-21 (A) ≥ 8DASS-21 (S) ≥ 15BeforeAmr et al. (2011)EgyptCross-sectionalNursingM: NRF: NRMean: 18.8Range: 17–2237392.8AnxietyStressHADPSSHAD ≥ 12NRBeforeAsturias et al. (2021)AustraliaCross-sectionalNursingM: 18.1F: 81.9NR37762StressPSSPSS ≥ 14BeforeAzodo et al. (2013)NigeriaCross-sectionalDentalM: NRF: NRNR5488StressISMA Stress QuestionnaireISMA Stress Questionnaire ≥ 5BeforeBanstola et al. (2021)NepalCross-sectionalNursingM: 0F: 100Mean: 19.55Range: 16–2214495AnxietyBAIBAI ≥ 11AfterBarroso-Corroto et al. (2021)SpainCross-sectionalNursing, MidwiferyM: 13.3F: 86.7Mean: 21.27Range: 18–37248NRAnxietyHADS (A)NRAfterBaruah et al. (2022)IndiaCross-sectionalNursingM: NRF: NRMean: 20.8Range: 17–24214100AnxietyStressDASS-21 (A)DASS-21 (S)DASS-21 (A) ≥ 8DASS-21 (S) ≥ 15AfterBasudan et al. (2017)Saudi ArabiaCross-sectionalDentalM: 54.2F: 45.7NR27795.8AnxietyStressDASS-21 (A)DASS-21 (S)NRBeforeBelingheri et al. (2021)ItalyCross-sectionalNursingM: 29.7F: 70.3Mean: 2220278StressGHQ-12GHQ-12 ≥ 5BeforeBhatt et al. (2022)IndiaCross-sectionalDentalM: 21.3F: 78.8Median: 21320NRAnxietyStressDASS-21 (A)DASS-21 (S)DASS-21 (A) ≥ 8DASS-21 (S) ≥ 15BeforeBraz-José et al. (2022)PortugalCross-sectionalDentalM: 21.8F: 78.2NR111538AnxietyStressDASS-21 (A)DASS-21 (S)DASS-21 (A) ≥ 7DASS-21 (S) ≥ 11AfterBrown et al. (2016)JamaicaCross-sectionalNursingM: NRF: NRMean: 38Range: 24–565773StressPSS-14PSS-14 ≥ 24BeforeCampos et al. (2021)BrazilCross-sectionalPharmacyM: 24.2F: 75.8Mean: 21.76622.4AnxietyStressDASS-21 (A)DASS-21 (S)DASS-21 (A) ≥ 8DASS-21 (S) ≥ 15AfterChernomas et al. (2013)CanadaCross-sectionalNursingM: 11F: 89NR43749.5AnxietyStressDASS-42 (A)DASS-42 (S)NRBeforeCheung et al. (2016)Hong KongCross-sectionalNursingM: 27.5F: 72.5Range: 18–3066152.6AnxietyStressDASS-21 (A)DASS-21 (S)DASS-21 (A) ≥ 10DASS-21 (S) ≥ 19Before (Continued on next page) Chouhan et al. (2021)IndiaCross-sectionalNursingM: NRF: NRMean: 21.16Range: 18–2722357.62AnxietyStressDASS-42 (A)DASS-42 (S)DASS-42 (A) ≥ 8DASS-42 (S) ≥ 15AfterChutipattana et al. (2022)ThailandCross-sectionalPublic HealthM: 11.7F: 88.3Mean: 19.8546392.6AnxietyStressDASS-21 (A)DASS-21 (S)DASS-21 (A) ≥ 8DASS-21 (S) ≥ 15AfterCici et al. (2020)TurkeyCross-sectionalNursingM: NRF: NRMean: 20.832269.8AnxietyBAISTAI-IBAI ≥ 16STAI-I ≥ 40AfterCoelho et al. (2021)BrazilCross-sectionalNursingM: 14.07F: 85.93Mean: 21.44192100AnxietyBAIBAI ≥ 11BeforeDaya. (2021)South AfricaCross-sectionalNursingM: 33.9F: 66.1Range: 18–3912784.7AnxietyStressDASS-42 (A)DASS-42 (S)DASS-42 (A) ≥ 8DASS-42 (S) ≥ 15AfterDevi et al. (2021)IndonesiaCross-sectionalNursingM: 28.3F: 71.7Mean: 23.15Range: 20–3333694.1AnxietyStressDASS-42 (A)DASS-42 (S)DASS-42 (A) ≥ 8DASS-42 (S) ≥ 15BeforeDiaz-Godiño et al. (2019)PeruCross-sectionalNursingM: 86.2F: 13.8NR1193100AnxietyStressDASS-21 (A)DASS-21 (S)NRBeforeDíaz-Jiménez et al. (2020)SpainCross-sectionalSocial workM: 9.9F: 90.1Mean: 23.22Range: 18–2736520AnxietyDASS-21 (A)NRAfterDubovi et al. (2022)IsraelCross-sectionalNursingM: 12F: 88Mean: 22.8135NRAnxietySTAI-SSTAI-S ≥ 40AfterFabbris et al. (2017)BrazilCross-sectionalNursingM: 9.5F: 90.5Mean: 21169100AnxietyBAIBAI ≥ 11BeforeFaraj. (2022)IraqCross-sectionalNursingM: 50F: 50Range: 18–2660100StressPSS-10PSS-10 ≥ 20AfterFauzi et al. (2021)MalaysiaCross-sectionalMedical Laboratory Sciences, Medical Imaging, NursingM: 9.9F: 90.1Mean: 21.86Range: 19–2844993.9AnxietyStressDASS-21 (A)DASS-21 (S)DASS-21 (A) ≥ 8DASS-21 (S) ≥ 15BeforeFernandez et al. (2021)BrazilCross-sectionalDentalM: 29.4F: 70.6Mean: 23.271050NRAnxietyGAD-7GAD-7 ≥ 5AfterFischbein et al. (2019)United StatesCross-sectionalPharmacyM: 40.7F: 59.3Mean: 26.7159NRAnxietyGAD-7GAD-7 ≥ 10BeforeFrajerman et al. (2022)FranceCross-sectionalDental, NursingM: 26.5F: 72.5NR32810.3AnxietyHADS (A)HADS (A) ≥ 11AfterGao et al. (2021)ChinaCross-sectionalNursingM: 11.8F: 88.2Mean: 19.95153286.1AnxietyStressDASS-21 (A)DASS-21 (S)DASS-21 (A) ≥ 8DASS-21 (S) ≥ 15AfterGautam et al. (2020)IndiaCross-sectionalPhysiotherapyM: 35.24F: 64.76Range: 17–25105NRAnxietyStressDASS-21 (A)DASS-21 (S)NRBeforeGeorge et al. (2018)IndiaCross-sectionalDentalM: 27F: 73NR100100StressPSS-10PSS-10 ≥ 14BeforeGeorge et al. (2022)MalaysiaCross-sectionalDentalM: 68.7F: 31.3Mean: 22.38351100AnxietyStressDASS-21 (A)DASS-21 (S)DASS-21 (A) ≥ 8DASS-21 (S) ≥ 15BeforeGitay et al. (2019)PakistanCross-sectionalHealth SciencesM: 38.3F: 61.7NR300NRAnxietyGAD-7NRBeforeHasanpour et al. (2021)IranCross-sectionalNursingM: 27F: 73Mean: 23.07Range: 18–43174100AnxietyGAD-7GAD-7 ≥ 10AfterHelen et al. (2013)IndiaCross-sectionalNursingM: 23F: 77NR200NRStressStress Rating ScaleNRBeforeHodselmans et al. (2018)Sweden and NetherlandsCross-sectionalPhysiotherapyM: 32.8F: 57.8NR116NRStressSSINRBeforeJardon et al. (2022)United StatesCross-sectionalNursingM: 10.9F: 89.1NR18230.1AnxietyStressGAD-7COVID Stress ScalesGAD-7 ≥ 10COVID Stress Scale ≥ 8After (Continued on next page) Javeth. (2018)IndiaCross-sectionalNursingM: 3F: 97NR150100StressMESSAMESSA ≥ 36BeforeJiménez-Ortiz et al. (2019)MexicoCross-sectionalDentalM: 35.62F: 64.38NR73NRStressPSS-14PSS-14 ≥ 22BeforeJuneja et al. (2021)IndiaCross-sectionalDentalM: 35.2F: 64.8NR25081StressDESCASPSSNRAfterKalkan Uğurlu et al. (2020)TurkeyCross-sectionalNursingM: 20.7F: 79.3Mean: 20.6Median: 21Range: 18–3341193.83AnxietyStressDASS-42 (A)DASS-42 (S)DASS-42 (A) ≥ 8DASS-42 (S) ≥ 15AfterKeskin. (2021)TurkeyCross-sectionalDentalM: 39.8F: 60.2Range: 20–25259100AnxietyStressDASS-42 (A)DASS-42 (S)DASS-42 (A) ≥ 8DASS-42 (S) ≥ 15AfterKhorassani et al. (2021)New YorkCross-sectionalPharmacyM: 27F: 73NR198NRAnxietySASSAS ≥ 36BeforeKillinger et al. (2017)North AmericaCross-sectionalVeterinary MedicineM: 11.2F: 88.4Mean: 25.62Range: 25.62124589.9StressVMSIVMSI ≥ 4BeforeKrifa et al. (2022)TunisiaCross-sectionalPodiatry, Emergency Care, Operating Instrumentation, Paediatric Care, Research MastersM: 6F: 94NR36688.8AnxietyStressDASS-21 (A)DASS-21 (S)DASS-21 (A) ≥ 8DASS-21 (S) ≥ 15AfterLarijani et al. (2010)IranCross-sectionalNursing, MidwiferyM: 27.2F: 72.8NR250100AnxietySTAISTAI ≥ 20BeforeLi et al. (2021)ChinaCross-sectionalNursingM: 9.63F: 90.37NR634897.66AnxietyGAD-7GAD-7 ≥ 5AfterLingawi et al. (2020)Saudi ArabiaCross-sectionalDentalM: 40.3F: 59.7Range: 18–2625886AnxietyGAD-7GAD-7 ≥ 5AfterMa et al. (2022)ChinaCross-sectionalNursingM: 7.1F: 92.9Mean: 19.8219798.5StressPSS-10PSS-10 ≥ 14AfterMarcen-Roman et al. (2021)SpainCross-sectionalNursing, Physiotherapy, Occupational TherapyM: 18.3F: 81.7Mean: 21.02252NRAnxietyStressGADSPSS-10-CGADS ≥ 4PSS-10-C ≥ 25AfterMardea et al. (2020)IndonesiaCross-sectionalPharmacyM: NRF: NRNR48798StressPSS-10PSS-10 ≥ 14BeforeMasha’al et al. (2022)JordanCross-sectionalNursingM: 25.9F: 74.1Mean: 20.0828270.5AnxietyGAD-7GAD-7 ≥ 5AfterMasilamani et al. (2019)MalaysiaCross-sectionalNursingM: 8.3F: 91.7Mean: 20.29677.4StressGHQ-12NRBeforeMeckamalil et al. (2022)CanadaCross-sectionalChiropracticM: 39.8F: 60.2Mean: 2551067AnxietyStressDASS-21 (A)DASS-21 (S)DASS-21 (A) ≥ 8DASS-21 (S) ≥ 15BeforeMelo et al. (2021)BrazilCross-sectionalNursingM: 13.4F: 86.6Mean: 19.8Median: 19Range: 18–398291.1AnxietyHADS (A)HADS (A) ≥ 9BeforeMohebbi et al. (2019)IranCross-sectionalNursingM: 34.9F: 65.1Range: 19–2913073.9AnxietyGHQ-28NRBeforeMoreira et al. (2013)BrazilCross-sectionalNursingM: NRF: NRMean: 23.65Range: 21–3388NRStressPSS-10PSS-10 ≥ 18.7BeforeNahar et al. (2019)United StatesCross-sectionalVeterinary MedicineM: 11.7F: 88.3Mean: 25.326477.2AnxietyPHQ-4NRBefore (Continued on next page) Nahm et al. (2021)KoreaCross-sectionalVeterinary MedicineM: 52F: 48NR106332.5AnxietyStressDASS-21 (A)DASS-21 (S)NRBeforeNebhinani et al. (2020)IndiaCross-sectionalNursingM: NRF: NRMean: 20.1922196.9StressSNSISNSI ≥ 22BeforePandey et al. (2015)NepalCross-sectionalNursingM: NRF: NRMean: 20.44Range: 16–27190100StressSAASSAAS ≥ 16BeforePate et al. (2021)United StatesCross-sectionalPharmacyM: 42F: 58NR11946AnxietyCTAS-2CTAS-2 ≥ 44BeforePatten et al. (2021)United StatesCross-sectionalDidactic Program in DieteticsM: 8.2F: 91.8NR61113AnxietyStressDASS-21 (A)DASS-21 (S)NRBeforePryjmachuk et al. (2006)EnglandCross-sectionalMidwiferyM: 0F: 100NR10285StressGHQ-12GHQ-12 ≥ 4BeforeRacic et al. (2017)Bosnia and HerzegovinaCross-sectionalDental, Nursing, Speech TherapyM: 30.8F: 69.2Mean: 21.527970.5StressPSS-14PSS-14 ≥ 29BeforeRadeef et al. (2020)MalaysiaCross-sectionalPharmacyM: 14.3F: 85.7NR223NRAnxietyStressDASS-21 (A)DASS-21 (S)NRBeforeRashmi et al. (2022)IndiaCross-sectionalNursingM: 22.9F: 77.1NR175NRStressPSS-10PSS-10 ≥ 14AfterRatanasiripong et al. (2012)ThailandCross-sectionalNursingM: 16F: 84Mean: 22.8Range: 20–31110100AnxietySTAINRBeforeRathnayake et al. (2016)Sri LankaCross-sectionalNursingM: 30.4F: 69.6Mean: 24.1Range: 21–279286.4AnxietyStressDASS-21 (A)DASS-21 (S)NRBeforeReghuram et al. (2014)IndiaCross-sectionalNursingM: NRF: NRNR1000100AnxietySASNRBeforeRezaei et al. (2020)IranCross-sectionalMidwiferyM: 0F:100NR7064.8StressPSS-14PSS-14 ≥ 15BeforeRodriguez-Roca et al. (2021)SpainCross-sectionalNursing, Physiotherapy, Occupational TherapyM: 18.3F: 81.7Mean: 21.02252NRAnxietyStressGADSPSS-10-CGADS ≥ 4PSS-10-C ≥ 25AfterRoldan-merino et al. (2021)SpainCross-sectionalNursingM: 12.8F: 87.2Mean: 24.7203NRAnxietyGAD-7GAD-7 ≥ 10AfterRosenthal, et al. (2021)United StatesCross-sectionalNursingM: 8F: 92NR22230AnxietyStressDASS-21 (A)DASS-21 (S)NRAfterSabih et al. (2013)PakistanCross-sectionalPhysiotherapyM: 32.5F: 67.5NR23192.4StressSLSINRBeforeSahu et al. (2019)IndiaCross-sectionalNursingM: 5.9F: 94.1Mean: 25.310292.7StressPSS-10PSS-10 ≥ 14BeforeSakai et al. (2021)JapanCross-sectionalNursingM: NRF: NRRange: 20–22104100AnxietyHADS (A)HADS (A) ≥ 8AfterSaldanha et al. (2021)IndiaCross-sectionalNursingM: 7.8F: 92.2Range: 17–22205100StressPSSPSS ≥ 14AfterSamreen et al. (2020)Saudi ArabiaCross-sectionalPharmacyM: 100F: 0Range: 18–30170NRAnxietyGAD-7GAD-7 ≥ 5BeforeSamson. (2019)NepalCross-sectionalNursingM: NRF: NRMean: 20.2968099.7AnxietyStressDASS-21 (A)DASS-21 (S)DASS-21 (A) ≥ 8DASS-21 (S) ≥ 15BeforeSavitsky et al. (2020)IsraelCross-sectionalNursingM: NRF: NRNR21588AnxietyGAD-7GAD-7 ≥ 10AfterShdaifat et al. (2020)Saudi ArabiaCross-sectionalNursingM: 35.2F: 64.8NR54NRAnxietyStressDASS-42 (A)DASS-42 (S)DASS-42 (A) ≥ 8DASS-42 (S) ≥ 15Before (Continued on next page) Sogut et al. (2020)TurkeyCross-sectionalMidwiferyM: 0F: 100Mean: 20.79Range: 18–389729.7AnxietyBAIBAI ≥ 22AfterStanton et al. (2021)AustraliaCross-sectionalNursingM: 5.6F: 94.4NR500NRAnxietyStressDASS-21 (A)DASS-21 (S)DASS-21 (A) ≥ 8DASS-21 (S) ≥ 15BeforeStormon et al. (2019)AustraliaCross-sectionalDentalM: 42.5F: 57.5NR17983.6AnxietyStressDASS-21 (A)DASS-21 (S)DASS-21 (A) ≥ 8DASS-21 (S) ≥ 15BeforeSun et al. (2020)ChinaCross-sectionalNursingM: 15.2F: 84.8NR474NRAnxietySASSAS ≥ 50AfterSyed et al. (2018)PakistanCross-sectionalPhysiotherapyM: 24.7F: 75.3Mean: 19.3267100AnxietyStressDASS-42 (A)DASS-42 (S)NRBeforeThomas-Davis et al. (2020)United StatesCross-sectionalOccupational therapy, PhysiotherapyM: 31F: 69Mean: 22.6Range: 22–2629100StressDASS-21 (S)NRBeforeThomas. (2022)United StatesCross-sectionalNursingM: 11.3F: 88.7Mean: 21.926721.4StressSSI-RNRAfterTran et al. (2022)VietnamCross-sectionalNursingM: 6.9F: 93.1Mean: 20.5185147.5AnxietyGAD-7GAD-7 ≥ 8AfterTuffah et al. (2021)IraqCross-sectionalNursingM: 31.2F: 68.8Mean: 21.5523713.1StressASISASIS ≥ 69AfterWilson et al. (2008)United StatesCross-sectionalSocial workM: 11F: 89Mean: 32Range: 21–61162NRAnxietyAnxiety scaleAnxiety scale ≥ 2BeforeWorku et al. (2019)EthiopiaCross-sectionalNursing, Midwifery, Public Health Officer, Pharmacy, Medical Laboratory, AnaesthesiaM: 57.6F: 42.4Mean: 20.9Range: 18–30384100StressPSS-14PSS-14 ≥ 15BeforeWynter et al. (2021)AustraliaCross-sectionalNursing, MidwiferyM: 6.1F: 92.8Mean: 23.5663822AnxietyStressDASS-21 (A)DASS-21 (S)DASS-21 (A) ≥ 4DASS-21 (S) ≥ 4AfterZakeri et al. (2021)United StatesCross-sectionalPharmacyM: 32.8F: 67.2NR23863AnxietyCCAPS-62 (A)CCAPS-62 (A) ≥ 1.22AfterZeng et al. (2019)ChinaCross-sectionalNursingM: 2.6F: 97.4Mean: 20.2Range: 17–2454489.9AnxietyStressDASS-21 (A)DASS-21 (S)NRBeforeZhu et al. (2021)ChinaCross-sectionalNursingM: 13.2F: 86.8Mean: 20.72342100AnxietyGAD-7GAD-7 ≥ 5AfterZukhra et al. (2020)IndonesiaCross-sectionalNursingM: 9.3F: 90.7NR247100AnxietyZSASNRAfterNelson et al. (2018)United StatesCohortNursingBaseline: M: 13.5F: 86.5Follow-up:M: 12.5F: 87.5Mean: 28.8 (baseline)30.5 (follow-up)Baseline: 37Follow-up: 3379 (baseline)70 (follow-upAnxietyStressGAD-7PSS-10GAD-7 ≥ 10PSS-10 ≥ 14BeforeNewbury-Birch et al. (2002)United KingdomCohortDentalM: 34F: 66NRBaseline: 47Follow-up: 53NRAnxietyStressHADS (A)GHQHADS (A) ≥ 8GHQ ≥ 5BeforeShangraw et al. (2021)ArizonaCohortPharmacyM: 38F: 62NRBaseline: 304Follow-up: 292NRAnxietyGAD-7GAD-7 ≥ 10BeforeNR = Not Reported, GAD-7 = Generalized Anxiety Disorder Scale, DASS-42 = Depression Anxiety Stress Scale 42-items, DASS-21 = Depression Anxiety Stress Scale 21-items, BAI = Beck’s Anxiety Inventory, GHQ-28 = Goldberg Health Questionnaire, STAI = State-Trait Anxiety Inventory, HADS = Hospital Anxiety and Depression Scale, STAIA = State-Trait Anxiety Inventory for Adults, PHQ-4 = Patient Health Questionnaire, ZSAS = Zung Self-Rating Anxiety Scale, SAS = Social Anxiety Scale, PHQ-9 = Patient Health Questionnaire, GADS = Goldberg abbreviated Anxiety and Depression Scale, PSS-4 = Perceived Stress Scale 4-items, PSS-10 = Perceived Stress Scale 10-items, ASNS = Assessment of Stress in Nursing Students, GHQ-12 = General Health Questionnaire, VMSI = Veterinary Medical Stressors Inventory, K10 = Kessler Psychological Distress Scale, SLSI = Student Life Stress Inventory, SSI-R = Gadzella’s Revised Student Life Stress Inventory, ASIS = Academic Stress Inventory Scale, SNSI = Student Nurse Stress Index, DES = Dental Environment Stress, CAS = COVID-19-associated Stress, CCAPS-62 = Counselling Center Assessment of Psychological Symptoms, SAAS = Scale for Assessing Academic Stress, CTAS-2 = Cognitive Test Anxiety Scale, MESSA = Modified Stress Scale for Adolescents
Quality assessment
There were only observational studies that could be discovered, comprising 109 cross-sectional and three cohort studies. Table 2 presents the quality assessments of individual studies using the NOS rating. There were 51 (45.5%) high-quality (NOS > 6) and 61 (54.5%) low-quality (NOS ≤ 6) studies. For cross-sectional studies, 78 studies did not justify the sample size calculation, and 82 studies failed to take non-respondents into account. For cohort studies, all used written self-report and did not demonstrate an outcome of interest at the start of the study. Inter-rater reliability was tested using the results of quality appraisal by two independent reviewers (YXL and SESL). The Kappa statistic (κ) of 0.754 showed substantial agreement on quality assessment between reviewers.
Table 2.Newcastle-Ottawa Scale grading for quality assessment of the selected articles
Global prevalence of anxiety stress symptoms among healthcare students
The pooled global prevalence of different severity levels of anxiety symptoms among healthcare students was 41% (95% CI: 33–50), 15% (95% CI: 12–19), 22% (95% CI: 19–26), 10% (95% CI: 8–13), 14% (95% CI: 11–17) for unspecified (Fig. S1), mild (Fig. S2), moderate (Fig. 2), severe (Fig. S3), and extremely severe anxiety (Fig. S4), respectively. The pooled global prevalence of stress symptoms among healthcare students was 36% (95% CI: 25–47), 15% (95% CI: 12–18), 32% (95% CI: 25–40), 11% (95% CI: 8–15), 4% (95% CI: 2–5) for unspecified (Fig. S5), mild (Fig. S6), moderate (Fig. S7), severe (Fig. S8), and extremely severe stress (Fig. S9), respectively. Figure 3 summarises the global prevalence of different severity levels of anxiety and stress symptoms among healthcare students. Subgroup and meta-regression analyses were conducted to account for the considerable heterogeneity observed across all studies.
Fig. 2. Forest plot of global prevalence (95% confidence interval) of moderate anxiety symptoms among healthcare students
Fig. 3. Bar chart of the global prevalence of different severity levels of anxiety and stress symptoms among healthcare students
Types of healthcare students
Table 3 summarises global and subgroup analyses of the prevalence of anxiety and stress symptoms among healthcare students. Fig. S10–S49 display the forest plots of subgroup analyses. A significant subgroup difference was found in the severe anxiety symptoms (p = 0.08) between nursing students (9%, 95% CI: 6–13) and non-nursing students (13%, 95% CI: 10–17). When comparing nursing and non-nursing students, the test for subgroup differences in the unspecific (p = 0.05), mild (p = 0.09), and moderate (p = 0.07) stress symptoms showed significant differences. Non-nursing students were found to have higher unspecific (48%, 95% CI:29–68) and mild (17%, 95% CI: 14–22) stress symptoms than nursing students, whereas nursing students (37%, 95% CI: 26–49) were found higher moderate stress symptoms than non-nursing students.
Table 3. Global and subgroup analyses of the prevalence of anxiety and stress symptoms among healthcare studentsAnxietyNo.Prevalence (95% CI) P subgroup StressNo.Prevalence (95% CI) P subgroup Global unspecified anxiety symptoms2841 (95% CI: 33, 50)-Global unspecified stress1536 (95% CI: 25, 47)-Subgroup analyses of the global unspecified anxietySubgroup analyses of global unspecified stressTypes of studentsNursing1739 (95% CI: 28, 51)0.60Nursing1131 (95% CI: 19, 45)0.05Non-Nursing1144 (95% CI: 30, 58)Non-Nursing448 (95% CI: 29, 68)Measurement instrumentsDASS550 (95% CI: 31, 70)0.19DASS431 (95% CI: 12, 53)0.46Non-DASS2339 (95% CI: 29, 49)Non-DASS1138 (95% CI: 23, 53)Geographical regionAfrica/Middle East147 (95% CI: 41, 52)0.06Africa/Middle East--0.56America840 (95% CI: 23, 58)America443 (95% CI: 24, 62)Asia Pacific1233 (95% CI: 20, 48)Asia Pacific637 (95% CI: 17, 60)Europe757 (95% CI: 41, 72)Europe529 (95% CI: 6, 61)COVID Pandemic PeriodPre-COVID-191641 (95% CI: 30, 52)0.93Pre-COVID-191139 (95% CI: 27, 52)0.31Post-COVID-191242 (95% CI: 27, 57)Post-COVID-19427 (95% CI: 3, 63)Global mild anxiety4815 (95% CI: 12, 19)Global mild stress3915 (95% CI: 12, 18)Subgroup analyses of global mild anxietySubgroup analyses of global mild stressTypes of studentsNursing2817 (95% CI: 12, 23)0.14Nursing1912 (95% CI: 8, 17)0.08Non-Nursing2013 (95% CI: 9, 17)Non-Nursing2017 (95% CI: 14, 22)Measurement instrumentsDASS319 (95% CI: 8, 11)< 0.001DASS3115 (95% CI: 12, 18)0.80Non-DASS1729 (95% CI: 23, 37)Non-DASS814 (95% CI: 4, 28)Geographical regionAfrica/Middle East313 (95% CI: 1, 35)< 0.001Africa/Middle East416 (95% CI: 2, 39)< 0.0001America1015 (95% CI: 8, 23)America612 (95% CI: 7, 18)Asia Pacific3117 (95% CI: 12, 22)Asia Pacific2415 (95% CI: 10, 19)Europe17 (95% CI: 6, 9)Europe225 (95% CI: 3, 60)Oceania311 (95% CI: 3, 22)Oceania313 (95% CI: 9, 18)COVID Pandemic PeriodPre-COVID-192616 (95% CI: 11, 21)0.92Pre-COVID-192515 (95% CI: 11, 19)0.83Post-COVID-192215 (95% CI: 10, 21)Post-COVID-191414 (95% CI: 9, 20)Global moderate anxiety5522 (95% CI: 19, 26)Global moderate stress5432 (95% CI: 25, 40) (Continued on next page) Subgroup analyses of global moderate anxietySubgroup analyses of global moderate stressTypes of studentsNursing3422 (95% CI: 17, 27)0.59Nursing3337 (95% CI: 26, 49)0.07Non-Nursing2123 (95% CI: 19, 27)Non-Nursing2125 (95% CI: 17, 34)Measurement instrumentsDASS3120 (95% CI: 16, 23)0.08DASS3215 (95% CI: 12, 17)< 0.0001Non-DASS2426 (95% CI: 19, 33)Non-DASS2262 (95% CI: 52, 72)Geographical regionAfrica/Middle East327 (95% CI: 2, 65)0.78Africa/Middle East535 (95% CI: 3, 77)0.59America1124 (95% CI: 17, 33)America1025 (95% CI: 12, 42)Asia Pacific3621 (95% CI: 17, 26)Asia Pacific3233 (95% CI: 23, 44)Europe224 (95% CI: 0, 100)Europe349 (95% CI: 3, 96)Oceania318 (95% CI: 3, 40)Oceania425 (95% CI: 0, 75)COVID Pandemic PeriodPre-COVID-192825 (95% CI: 21, 28)0.16Pre-COVID-193534 (95% CI: 25, 43)0.55Post-COVID-192720 (95% CI: 14, 26)Post-COVID-191929 (95% CI: 15, 44)Global severe anxiety5410 (95% CI: 8, 13)Global severe stress5211 (95% CI: 8, 15)Subgroup analyses of severe anxietySubgroup analyses of severe stressTypes of studentsNursing339 (95% CI: 6, 13)0.08Nursing3212 (95% CI: 7, 18)0.79Non-Nursing2113 (95% CI: 10, 17)Non-Nursing2011 (95% CI: 7, 15)Measurement instrumentsDASS3111 (95% CI: 8, 14)0.71DASS328 (95% CI: 6, 11)0.06Non-DASS2310 (95% CI: 6, 15)Non-DASS2017 (95% CI: 8, 28)Geographical regionAfrica/Middle East314 (95% CI: 0, 61)0.82Africa/Middle East68 (95% CI: 0, 24)0.94America1112 (95% CI: 8, 17)America812 (95% CI: 6, 19)Asia Pacific359 (95% CI: 6, 13)Asia Pacific3212 (95% CI: 7, 18)Europe215 (95% CI: 0, 100)Europe39 (95% CI: 0, 45)Oceania311 (95% CI: 3, 22)Oceania310 (95% CI: 1, 26)COVID Pandemic PeriodPre-COVID-192810 (95% CI: 8, 13)1.00Pre-COVID-193313 (95% CI: 8, 19)0.17Post-COVID-192611 (95% CI: 6, 16)Post-COVID-19199 (95% CI: 5, 14)Global extremely severe anxiety2914 (95% CI: 11, 17)Global extremely severe stress294 (95% CI: 2, 5) (Continued on next page) Subgroup analyses of extremely severe anxietySubgroup analyses of extremely severe stressTypes of studentsNursing1512 (95% CI: 8, 16)0.23Nursing154 (95% CI: 2, 7)0.63Non-Nursing1416 (95% CI: 11, 22)Non-Nursing143 (95% CI: 1, 6)Measurement instrumentsDASS2814 (95% CI: 11, 17)0.66DASS284 (95% CI: 2, 5)0.009Non-DASS112 (95% CI: 8, 18)Non-DASS19 (95% CI: 5, 15)Geographical regionAfrica/Middle East312 (95% CI: 7, 17)< 0.001Africa/Middle East31 (95% CI: 0, 9)< 0.0001America67 (95% CI: 5, 9)America62 (95% CI: 1, 4)Asia Pacific1716 (95% CI: 11, 21)Asia Pacific174 (95% CI: 2, 7)Europe126 (95% CI: 24, 29)Europe112 (95% CI: 10, 14)Oceania217 (95% CI: 9, 27)Oceania28 (95% CI: 0, 39)COVID Pandemic PeriodPre-COVID-191815 (95% CI: 11, 19)0.30Pre-COVID-19184 (95% CI: 2, 6)0.85Post-COVID-191112 (95% CI: 6,18)Post-COVID-19114 (95% CI: 1, 7)No. = number, CI = Confidence interval, *p < 0.05; **p < 0.01; ***p < 0.001. DASS = Depression, Anxiety and Stress Scale; COVID = coronavirus disease 2019
Types of measurement
Notably, a series of subgroup analyses revealed that healthcare students experienced significantly (p < 0.1) lower prevalences of mild (9%, 95% CI: 8–11) and moderate (20%, 95% CI: 16–23) anxiety symptoms when the DASS-21 was used as the measurement tool than other measurements. The DASS-21 also showed that moderate stress (15%, 95% CI: 12–17), severe stress (8%, 95% CI: 6–11), and extremely severe stress (4%, 95% CI: 2–5) symptoms were significantly less common than with other measures.
Geographical region
Healthcare students had significantly (p < 0.1) higher prevalences of unspecific anxiety symptoms (57%, 95% CI: 41–72), extremely severe anxiety symptoms (26%, 95% CI: 24–29), mild stress symptoms (25%, 95% CI: 3–60), and extremely severe stress symptoms (12%, 95% CI: 10–14) in Europe than other regions. However, healthcare students had a significantly higher prevalence of mild anxiety symptoms in Asia Pacific (17%, 95% CI: 12–22) when compared to other regions. However, only one to three studies were in counterparts, and the interpretation of this result was cautious.
COVID-19 pandemic period
The global prevalence of different levels of anxiety and stress symptoms was similar before and after the COVID-19 pandemic. Studies conducted before the COVID-19 pandemic had a prevalence of 10%–41% (95% CI: 8–30, 13–52), while those conducted after the COVID-19 pandemic had a prevalence of 11%–42% (95% CI: 6–27, 16–57).
Meta-regression
A series of meta-regression analyses were conducted for different levels of anxiety and stress symptoms against sample size, study quality (NOS), and year of publication. The sample size was a significant covariate in the global prevalence estimates of moderate anxiety symptoms (β < −0.001, p = 0.02), severe anxiety symptoms (β < −0.001, p = 0.04), and moderate stress symptoms (β < −0.001, p = 0.01). These results indicated that lower prevalence estimates of moderate anxiety symptoms, severe anxiety symptoms, and moderate stress symptoms were found in the studies with a smaller sample size when compared to a larger sample size. Study quality was a significant covariate in the global prevalence estimates of severe anxiety symptoms (β = 0.027, p = 0.04), indicating the studies with higher quality have a higher prevalence estimate of severe anxiety symptoms. However, the year of publication did not have effects on the different levels of anxiety and stress symptoms.
Publication bias and certainty of evidence
To investigate publication bias, funnel plots and Egger’s test were used (Fig. S50–S59). Upon visual inspection, the prevalence of unspecified, mild, moderate, and severe anxiety symptoms and moderate stress symptoms were shown as asymmetrical funnel plots. The prevalence of unspecific anxiety (Fig. S50, p = 0.01), moderate anxiety (Fig. S52, p < 0.001), severe anxiety symptoms (Fig. S53, p < 0.001), and moderate stress symptoms (Fig. S57, p = 0.004), respectively, had p-values of less than 0.05 according to Egger’s test. These findings suggested that there could be publishing biases. Based on the GRADE criteria, the certainty of evidence was very low for different levels of prevalence estimates (Table S5), and the domain of inconsistency was downgraded because all meta-analyses had sustainable heterogeneities between studies and small sample sizes.
Discussion
Summary of findings
This systematic review comprised 112 studies totalling 42,331 healthcare students from 20 healthcare courses in 43 countries. The severity of anxiety and stress symptoms was classified as unspecified, mild, moderate, severe, and extremely severe (Fig. 3). The pooled global prevalence of unspecified, mild, moderate, severe, and extremely severe anxiety symptoms was 41%, 15%, 22%, 10%, and 14%, respectively. The pooled global prevalence of unspecified, mild, moderate, severe, and extremely severe stress symptoms was 36%, 15%, 32%, 11%, and 4%. A series of subgroup analyses revealed that types of healthcare students, geographical regions, and types of measurement were all significant factors influencing certain levels of anxiety and stress symptoms. The sample size and study quality were significant covariates on prevalence estimates of moderate anxiety, severe anxiety, and moderate stress symptoms. Although 45.5% of studies were rated as high quality based on NOS, the certainty of evidence was very low for all levels of anxiety and stress symptoms according to the GRADE criteria.
Global prevalence of different levels of anxiety symptoms in healthcare students
When comparing the different severity levels of anxiety symptoms, unspecific anxiety symptoms (41%) had the highest prevalence, followed by moderate (22%), mild (15%), extremely severe (14%) and severe (10%) anxiety symptoms (Fig. 3). Our results were consistent with a previous review among nursing students [16], which reported moderate anxiety being most prevalent (25.1%) and followed by mild anxiety (19.4%) and severe anxiety (15.1%). Some discrepancies were found might be due to different classifications of symptoms, and it may miss out on extremely severe anxiety symptoms between the two reviews. Our review found that the prevalence of unspecific anxiety symptoms was 41%. As all different severities of anxiety symptoms were combined into a single category, this may explain the higher prevalence. Disruptive symptoms of moderate anxiety might allow students to identify their adverse mental condition, thus seeking professional help and decreasing severe and extremely severe anxiety rates markedly. However, all studies in these categories were cross-sectional studies, whereby data was only collected at one time point [152]. This may cause fluctuations in anxiety levels depending on the period during which the studies were done. Many studies reporting anxiety were performed before the start of COVID-19 when healthcare education and clinical attachments were still in full force; thus, this may also have led to higher rates of moderate anxiety levels.
Global prevalence of different levels of stress symptoms among healthcare students
According to our review, unspecified stress symptoms (36%) were the most prevalent type of stress symptom among healthcare students, followed by moderate (32%), mild (15%), severe (11%), and extremely severe (4%) stress symptom levels. The highest prevalence of unspecified stress symptoms can be explained by combining all the severity of stress symptoms into a single group. The pattern of the global prevalence of different levels of stress symptoms was different when we compared the results of a previous systematic review [16]: moderate stress symptoms predominated (42.1%), with severe (19.5%) and mild (16.7%) in the second and third, respectively. This can be explained by the possibility of different populations; our reviews included different types of healthcare students, whereas the previous students focused on nursing students. Healthcare students frequently face stress because of clinical training and academic sources [15]. However, it has been found that mild to moderate stress among healthcare students has positive benefits on working memory and encourages them to perform better [153, 154]. The much lower rates of severe and extremely severe stress may be attributable to enhanced emotional support from instructors in recent years, as well as expanded access to stress management programs and activities for healthcare students on campus [15].
Types of healthcare students
Our subgroup analyses showed that the global prevalence of anxiety and stress symptoms in non-nursing students was higher at 13%−44% and 3%−48%, respectively, as compared to nursing students, with a prevalence of 9%−39% and 4%−37%. This result is similar to the findings by Q Miao, L Xie, B Xing, X Wang, S Tang and H Luo [155], which found a difference between anxiety levels between nursing (15.3%) and non-nursing (18.9%) students. The lower prevalence of anxiety and stress symptoms in nursing students may be due to the nursing curriculum, which includes modules on psychology and mental health [155]. Thus, providing students with the ability to better manage their anxiety and stress levels. The nature of nursing profession might also have taught students to be more resilient as compared to their other healthcare counterparts [156]. Nursing students during the COVID-19 pandemic who had been through infection control courses in school would also be able to adapt easily to the ever-changing infection control practices. This would allow future nurses to be less anxious and stressed about changes that the pandemic may bring about [157]. This may allow nursing students to be able to overcome stressful situations easily and adapt positively, thus lowering anxiety and stress levels [158].
Use of different measurements
A series of subgroup analyses showed that a lower prevalence of anxiety and stress symptoms was found when using the DASS-21 as a measurement tool [151]. It seems that the different measurement tools could affect the findings. The anxiety domain of the DASS-21 measures the symptoms of worry, irritation, restlessness, and panic [151]. For other scales, such as the GAD-7 [159], it evaluates signs of concern and irritation. Since the different signs and symptoms included different tools, different prevalences may have resulted. Our review observed that the Perceived Stress Scale (PSS) was the most common tool for measuring stress symptoms [160]. PSS primarily measures two characteristics, namely: perceived helplessness and perceived self-efficacy [160], whereas the stress domain of the DASS-21 evaluates feelings of anxious arousal, annoyance, and impatience [151]. Healthcare students may feel helpless since tertiary education places a strong emphasis on self-discipline [161]. This may have resulted in a different prevalence using different tools.
Geographical region
Subgroup analyses showed that healthcare students in the European region reported a higher prevalence of stress and anxiety symptoms than in other regions, especially on unspecific anxiety symptoms, extremely severe anxiety symptoms, mild stress symptoms, and extremely severe stress symptoms. This could be attributed to the Spanish studies, which comprised 5 of the 13 studies in this category. Spain has an unemployment rate of 8.6% among those with tertiary education, compared to 6.18% globally [162]. The foreseeable likelihood of unemployment following graduation may have contributed to the increased anxiety and stress. In addition, the COVID-19 regulations, such as the duration of lockdowns in various nations and regions, may have had an impact on the prevalence estimations [163]. We also note that the unbalanced subgroups may have caused inaccurate estimation of effect sizes [36]. As there are only 1–3 studies from certain regions in the subgroup analyses, this may affect the accuracy of this result.
COVID-19 pandemic period
Due to unforeseen disturbances to the educational system, it was anticipated that the commencement of COVID-19 would increase the prevalence of anxiety and stress in healthcare students [164]. However, this analysis discovered no significant subgroup differences in the prevalence of anxiety. This finding suggests that healthcare educators should address the anxiety and stress phenomena of healthcare students, regardless of the COVID-19 circumstance. Notably, we found that healthcare students experienced more anxiety and stress symptoms at certain levels before the COVID-19 pandemic. These findings are in line with a previous review by M Mulyadi, SI Tonapa, S Luneto, WT Lin and BO Lee [18]. We speculate that this might be due to healthcare students knowing more about the pandemic and being able to use what they have learned to control and lessen anxiety and stress levels [1]. Given that online learning has been used in healthcare education around the world since pre-COVID-19 in addition to traditional face-to-face learning [165], students were able to quickly switch to online sessions when COVID-19 prevented the possibility of physical classes. After COVID-19 was declared a global pandemic, healthcare students had reduced clinical placements [166]. Hence reducing the anxiety and stress levels of healthcare students.
Study quality and sample size
According to the results of the meta-regression, the study quality and sample size had a substantial effect on the global prevalence estimates of moderate anxiety, severe anxiety, and moderate stress symptoms. Our review indicates that high-quality studies found a higher prevalence of severe anxiety symptoms in healthcare students. We observed that the main reasons for a good-quality study with reliable control of confounding factors will provide more precise and accurate results [167]. Given that this review has four levels of anxiety symptoms, it could be explained by this result. Furthermore, our results suggest a higher prevalence of moderate anxiety and stress symptoms in studies with a smaller sample size. One explanation could be a small sample size with low statistical power, which could overestimate the effect size [168].
Strengths and limitations
To the best of our knowledge, this is the first to compute the global prevalence of different levels of stress and anxiety symptoms in healthcare students including nursing, pharmacy, and allied health students. A thorough approach was employed, comprising a three-step search strategy that was carried out in ten databases along with grey literature. The results are more broadly applicable because 42,336 healthcare students were included in a total of 112 studies from five different regions. A comprehensive review of quality was also done at both the individual and overall levels. We adopted the Hartung-Knapp-Sidik-Jonkman (HKSJ) method, which was known to perform better by showing consistent results with adequate error rates than other methods [33]. The Freeman-Tukey double arcsine transformation was used to stabilise the variance of each study’s proportion in two-step meta-analysis methods [34]. By performing subgroup and meta-regression analyses, heterogeneity was investigated, and significant factors that influenced the prevalence estimates of different levels of anxiety and stress symptoms were explored.
Nevertheless, several limitations should be acknowledged. First, all studies were written and published in English, so the generalisability of the results was constrained. Second, many of the included papers were from Asia and America, which may have had an impact on how prevalent anxiety and stress symptoms were among healthcare students. Third, a less accurate prevalence could be the consequence of multiple studies using small sample numbers and various assessment tools. Fourth, a self-reported screening instrument was used to compute the prevalence instead of a diagnostic interview, which might lead to a bias towards social desirability. Fifth, the cut-off points utilised to characterise symptoms of stress and anxiety were different, which might have an impact on the prevalence estimates. Due to the significant heterogeneity of pooled prevalence estimates, which may indicate data variability, the results should be carefully evaluated. Lastly, this review showed very low certainty of the evidence, which diminished the internal validity of the results.
Future research direction
Future studies can investigate relevant strategies that could help reduce anxiety and stress symptoms in healthcare students. Although we performed a series of subgroup and meta-regression analyses, the reasons of substantial heterogeneity were unexplained. Future research may examine additional factors that might have an impact on healthcare students’ anxiety and stress symptoms. We adopted the NOS to assess the quality of cross-sectional studies, but few of them justified their sample sizes and provided information on non-respondents. Sample size justification is essential to prevent under- or overestimating the sample size in research [168], and response bias might arise from incomplete data on non-respondents [169]. Future studies should adhere to the checklist for Strengthening the Reporting of Observational Studies in Epidemiology [170], particularly the explanation of sample size calculation, and non-response rate. Future cohort studies should adequately consider the ascertainment and assessment of outcomes while carrying out the study.
Implications for clinical practice and healthcare policy
This review provided new knowledge on the different levels of anxiety and stress symptoms, and these findings alerted leaders of healthcare education to improve the awareness of the severity of problems among healthcare students. To benefit healthcare students, early detection and preventive interventions such as cognitive behavioural therapy and eHealth literacy [171] should be given a higher priority. Given that our subgroup analyses showed that non-nursing students in the European region experience higher prevalence estimates than their counterparts, targeted interventions should be developed for these high-risk groups. Our results demonstrate that different instruments employed can change prevalence estimates, indicating the need for standardised assessment methods in future.
Conclusion
Based on this review, healthcare students around the world frequently experience different levels of stress and anxiety symptoms. The meta-analysis has helped to advance knowledge of the potential effects of various healthcare student types, geographical regions, different instruments, sample sizes, and study quality on the prevalence of anxiety and stress symptoms. These findings add value to healthcare educators’ current knowledge by emphasizing the need for timely interventions to address the requirements of healthcare students globally and stressing the need to prioritise the psychological well-being of healthcare students.
Supplementary Information
Supplementary Material 1
The reference list from the paper itself. Each links out to its DOI / PubMed record.
- 1Naser AY, Dahmash EZ, Rabaa AR, Alwafi H, Hamzeh Mohammad A, Ghoul I, et al. Mental health status of the general population, healthcare professionals, and university students during 2019 coronavirus disease outbreak in jordan: A cross-sectional study. Brain Behav. 2020;10(8). 10.1002/brb 3.1730.10.1002/brb 3.1730 PMC 736106032578943 · doi ↗ · pubmed ↗
- 2Wells G, Shea B, O’Connell D, Peterson J, Welch V, Losos M et al. The Newcastle-Ottawa Scale (NOS) for assessing the quality of nonrandomised studies in meta-analyses., https://www.ohri.ca/programs/clinical_epidemiology/oxford.asp; 2013.
- 3Hartling L, Fernandes RM, Seida J, Vandermeer B, Dryden DM. From the trenches: a cross-sectional study applying the grade tool in systematic reviews of healthcare interventions. P Lo S One. 2012;7(4):e 34697. 10.1371/journal.pone.0034697.10.1371/journal.pone.0034697 PMC 332061722496843 · doi ↗ · pubmed ↗
- 4Mohebbi Z, Setoodeh G, Torabizadeh C, Rambod M. State of mental health and associated factors in nursing students from southeastern Iran. Investig Educ Enferm. 2019;37(3) ,e 04, 1-11. 10.17533/udea.iee.v 37n 3e 0410.17533/udea.iee.v 37n 3e 04PMC 787149531830402 · doi ↗ · pubmed ↗
- 5Sahu M, Gandhi S, Sharma MK, Marimuthu P. Perceived stress and resilience and their relationship with the use of mobile phone among nursing students. Investig Educ Enferm. 2019;37(3). 10.17533/udea.iee.v 37n 3e 05.10.17533/udea.iee.v 37n 3e 05PMC 787149631830403 · doi ↗ · pubmed ↗
- 6Syed A, Ali SS, Khan M. Frequency of depression, anxiety and stress among the undergraduate physiotherapy students. Pak J Med Sci. 2018;34(2):468. 10.12669/pjms.342.12298.10.12669/pjms.342.12298 PMC 595439929805428 · doi ↗ · pubmed ↗
- 7Thomas LMB. Stress and depression in undergraduate students during the COVID-19 pandemic: nursing students compared to undergraduate students in non-nursing majors. J Prof Nurs. 2022;38:89–96. 10.1016/j.profnurs.2021.11.013.10.1016/j.profnurs.2021.11.013PMC 864738735042595 · doi ↗ · pubmed ↗
- 8Tran HT, Nguyen MH, Pham TT, Kim GB, Nguyen HT, Nguyen N-M, et al. Predictors of e Health literacy and its associations with preventive behaviors, fear of COVID-19, anxiety, and depression among undergraduate nursing students: a cross-sectional survey. Int J Environ Res Public Health. 2022;19(7):3766. 10.3390/ijerph 19073766.10.3390/ijerph 19073766 PMC 899766135409448 · doi ↗ · pubmed ↗