Automated microscopy for malaria diagnosis in a reference laboratory in nonendemic settings
Alexandra Martín-Ramírez, Marta Lanza-Suárez, Pedro Berzosa Díaz, Agustín Benito, Victor Antón-Berenguer, José M. Rubio

TL;DR
This study evaluates an automated microscopy system for malaria diagnosis, showing it performs well compared to traditional methods in non-endemic regions.
Contribution
The study introduces and evaluates miLab™, an automated microscopy system using AI for malaria diagnosis in nonendemic settings.
Findings
miLab™ showed 90.8% concordance with conventional microscopy and 92.1% sensitivity.
Parasite density estimates by miLab™ were 11.6% lower than conventional microscopy.
miLab™ correctly identified 63.4% of P. falciparum cases confirmed by PCR.
Abstract
Malaria diagnosis plays a key role in case management, control, and elimination strategies. miLab™ is a digital microscopy with a fully integrated, sample-to-result approach, providing automated microscopic analysis of Plasmodium parasites and providing parasitemia levels of samples. It uses a deep learning model, a subfield of artificial intelligence (AI) that can differentiate from red blood cells that are infected with the malaria parasite from noninfected cells in blood smears. The aim of this study is to assess the performance of miLab™ microscopy for malaria diagnosis, in comparison with conventional microscopy and nested-multiplex malaria polymerase chain reaction (NM-PCR), in a malaria reference laboratory in a nonendemic country. From 2021 to 2024, 400 samples were analyzed prospectively using automated miLab™ microscopy, with NM-PCR and conventional microscopy as reference…
Genes, proteins, chemicals, diseases, species, mutations and cell lines named across the full text — each resolved to its canonical identifier and authoritative record.
Click any figure to enlarge with its caption.
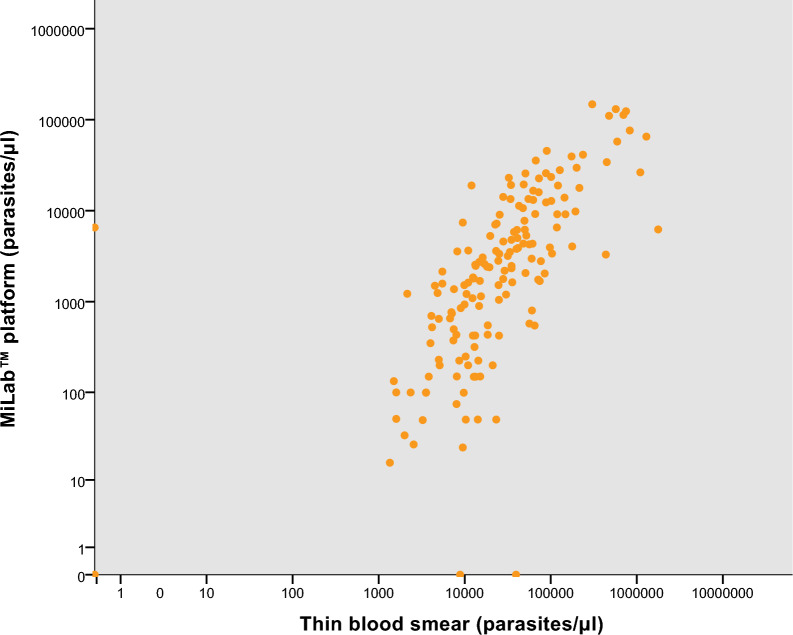 Figure 1
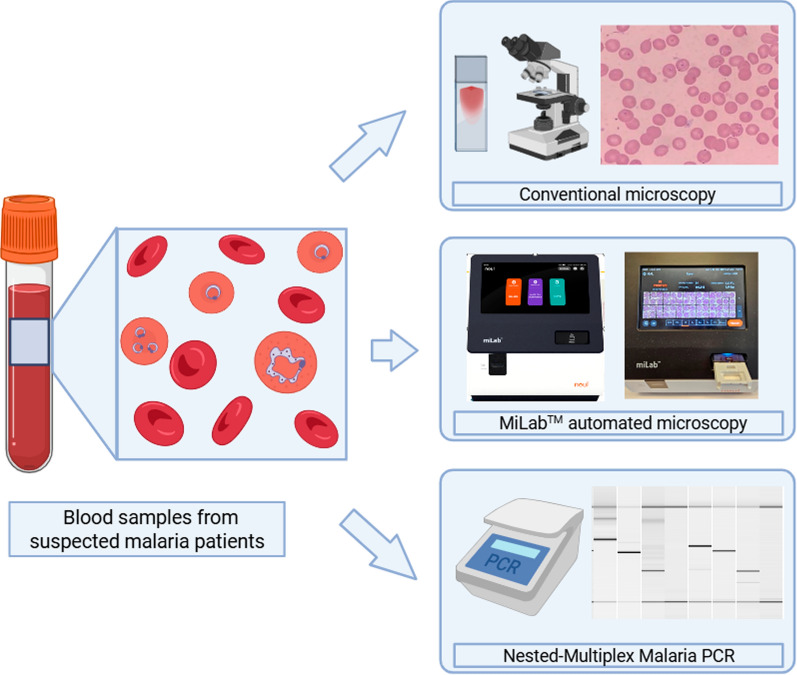 Figure 2
- —CIBER-Consorcio Centro de Investigación Biomédica en Red
- —Spanish Strategic Health Action (AESI-ISCIII)
- —Instituto de Salud Carlos III
Peer Reviews
No public reviews on file for this paper yet. If you reviewed it on a platform where reviews are public (OpenReview, ICLR, NeurIPS, ICML), you can paste yours below so the community can read it here.
Videos
No videos yet. Explain this paper in a talk, walkthrough, or lecture? Add one.
Taxonomy
TopicsDigital Imaging for Blood Diseases · Malaria Research and Control · Cell Image Analysis Techniques
Background
Malaria remains a significant global health burden, with an estimated 263 million cases and 597,000 deaths in 2023 [1]. Accurate diagnosis is critical for case management, disease control, and elimination efforts. Confirmatory testing is mandatory for all suspected cases prior to treatment [2, 3].
Conventional diagnostic methods, including light microscopy and rapid diagnostic tests (RDTs), remain the cornerstone of malaria diagnosis, with thick blood smear microscopy considered the gold standard owing to its low cost and ability to quantify parasitemia [4, 5]. However, microscopy is time-consuming and requires trained personnel. In many endemic areas, quality assurance (QA) programs are lacking or unsustainable, whereas in nonendemic regions, low case numbers lead to a decline in skilled microscopists [6, 7].
These limitations underscore the need for more sensitive and standardized alternatives, such as PCR-based molecular diagnostics [8, 9]. While PCR offers high sensitivity, its implementation in most malaria endemic settings is hindered by high costs, infrastructure requirements, and the need for technical expertise [10].
To overcome these challenges, several innovative diagnostic approaches have been explored. The Global Technical Strategy for Malaria 2016–2030 highlights the importance of evaluating emerging diagnostic technologies to strengthen surveillance and case management [3]. Recent research has focused on improving microscopy using AI-powered digital tools capable of detecting infected red blood cells [11, 12]. Automated systems offer standardized interpretation, faster processing times, and reduced reliance on manual expertise [13].
Smartphone-based solutions integrating AI have shown promise in resource-limited settings, although most remain semi-automated, requiring manual smear preparation and slide handling [14–16]. Fully automated, sample-to-result microscopic systems are rare. One such system is the miLab™ platform, developed by Noul in 2020, which automates blood smear preparation, staining, and scanning of over 200,000 RBCs in 20 min [17]. An integrated AI algorithm identifies Plasmodium falciparum and P. vivax (including mixed infections of these species), delivering a diagnosis and the estimated parasitemia [18, 19]. The miLab™ platform is designed for various applications, including malaria diagnosis using a modified Romanowsky stain, cytological evaluation with Papanicolaou stain, and blood cell morphology assessment with hematoxylin and eosin stain [17].
While conventional malaria microscopy is effective under optimal conditions, its performance varies widely in the field owing to equipment limitations, inconsistent training, and lack of QA. Nonendemic regions such as Europe also face diagnostic challenges owing to the scarcity of malaria cases and trained experts. Spain has been a malaria-free country since 1964; since then, the majority of cases have been imported, although occasionally some reported cases have no history of travel [20]. In 2022, Spain reported 669 malaria cases, ranking third in the European Union (EU) despite being malaria-free since 1964 [21].
In line with its assigned responsibilities, the Spanish National Reference Laboratory for Malaria (MAPELab) conducted this study to evaluate the diagnostic performance of the miLab™ system in comparison with conventional microscopy and nested multiplex PCR malaria diagnostic methods.
Methods
Study design and sample collection
A total of 400 blood samples were prospectively analyzed between 2021 and 2024 using the miLab™ automated microscopy platform (Noul Diagnostics, Republic of Korea). Results were compared against thin blood smear microscopy, using Quick Panoptic staining, and nested multiplex PCR (NM-PCR) for malaria molecular diagnosis [22, 23].
Ethical approval was granted by the Research Ethics Committee of the Instituto de Salud Carlos III, Spain (CEI PI 74_2020). The samples were obtained from travelers or migrant patients who presented with suspected malaria at Spanish hospitals and were subsequently referred to the National Center for Microbiology for diagnostic confirmation.
All blood samples were collected in ethylenediaminetetraacetic acid (EDTA) tubes and transported to the MAPELab within 5 days of collection.
Automated microscopy using the miLab™ system
Automated microscopy was carried out using the miLab™ diagnostic platform, which employs disposable cartridges comprising three sequential staining zones. The procedure was conducted strictly following the manufacturer’s protocol [4]. In brief, a plastic slide was placed over the cartridge, and 5 µL of whole blood was applied to the designated sample area. The system subsequently performed automated smearing and staining of the entire blood film. After an incubation period of approximately 12–15 min, the device software generated a preliminary diagnostic output. Results were displayed in one of the following categories: positive (subclassified as “Plasmodium falciparum positive suspected,” “P. vivax positive suspected,” or “Pf/Pv positive suspected”), negative, review needed, or error (Additional file 1: Fig. S1). Upon generation of the result, the operator was given the option to review the diagnostic image and, if required, manually adjust the classification through the user interface.
Conventional microscopy of malaria
Thin blood smear microscopy was performed on all collected samples using the Quick Panoptic staining method (Química Analítica Aplicada S.A., Spain). Between 2 and 5 µL of blood was used to prepare thin blood smears. Slides were examined by a certified expert microscopist, who was blinded to the results of both miLab™ automated microscopy and PCR assays. Parasite species identification and quantification were conducted assuming a standard concentration of 5,000,000 red blood cells (RBCs) per microliter of blood. A minimum of 100 high-power fields (1000× magnification achieved with a 100× oil immersion objective and a 10× eyepiece) were reviewed prior to categorizing slides as positive or negative.
Nested-multiplex malaria PCR (NM-PCR)
Genomic DNA for the performance of the nested multiplex PCR (NM-PCR) assay was extracted from whole blood samples using the QIAamp DNA Mini Blood Kit (QIAGEN^®^, Germany) on an automated QIAcube system (QIAGEN®, Germany), following the manufacturer’s protocol. A total of 200 µL of whole blood was processed and eluted in 100 µL of sterile distilled water. The DNA extracts were used immediately for NM-PCR reactions, and the remaining aliquots were stored at 4 °C for subsequent analyses.
NM-PCR was employed as the reference method in this study, as is the reference method commonly used for malaria diagnosis in MAPELab. This method is accredited under the UNE-EN ISO 15189:2022 standard (accreditation no. 175/LE1213) and was performed using the commercial BIOMALAR-2 Gel Form Kit (Biotools B&M Labs, Spain), in accordance with the manufacturer’s instructions and the protocols previously described [22, 23]. The method consists of two sequential multiplex PCR amplifications. The first reaction targets the Plasmodium genus and includes a human internal control to assess amplification quality. The second reaction uses the product of the first PCR as a template to detect and differentiate the most common Plasmodium species in humans (P. vivax, P. falciparum, P. ovale, P. malariae, and P. knowlesi).
Amplified products were resolved by capillary electrophoresis using the QIAxcel system (QIAGEN^®^), and species identification was based on the specific fragment sizes corresponding to each Plasmodium species.
For the initial PCR reaction, 5 µL of extracted DNA was added to the reaction mix. For the nested PCR, 2 µL of the first-round PCR product was used. The thermocycling conditions for the first PCR included initial denaturation at 94 °C for 7 min, followed by 40 cycles of denaturation at 94 °C for 20 s, annealing at 58 °C for 20 s, and extension at 72 °C for 30 s, with a final extension step at 72 °C for 10 min. The second PCR was performed with an initial denaturation at 94 °C for 5 min, followed by 35 cycles at 94 °C for 15 s, 53 °C for 15 s, and 72 °C for 20 s, concluding with a final extension at 72 °C for 10 min.
Data analysis
The performance of the miLab™ platform was evaluated in comparison with conventional light microscopy and NM-PCR. Sensitivity, specificity, positive predictive value (PPV), negative predictive value (NPV), and overall diagnostic accuracy were calculated along with their corresponding 95% confidence interval (CI). Method agreement was assessed using Cohen’s kappa statistic (κ), interpreted as follows: κ ≤ 0, no agreement; 0.01–0.20, slight agreement; 0.21–0.40, fair agreement; 0.41–0.60, moderate agreement; 0.61–0.80, substantial agreement; and 0.81–1.00, almost perfect agreement [24].
To minimize bias in the statistical analysis, a sample was considered positive if the miLab™ device detected Plasmodium-infected red blood cells, regardless of species (P. falciparum or P. vivax). “Review needed” results were reclassified according to the operator’s knowledge into the corresponding category, either a positive or negative result. Results labeled as “error” or “incomplete” were excluded from all statistical analyses. Cases in which miLab™ misidentified the Plasmodium species are reported separately.
Comparison of parasite density estimates between miLab™ and thin blood smear microscopy was performed using only samples that tested positive by both methods. The Spearman correlation coefficient (ρ) was calculated following verification of data distribution via the Kolmogorov–Smirnov normality test. The strength of correlation was assessed on the basis of the Spearman correlation coefficient value obtained, that is, no correlation (0.0 < 0.1) low correlation (0.1–0.3), moderate correlation (0.3–0.5), high correlation (0.5–0.7), and very high correlation (0.7–1) [25, 26]. Statistical analyses were conducted using SPSS software, version 22.
Results
The results of Plasmodium identification using each diagnostic method are summarized in Table 1. The miLab™ platform yielded 350 valid results (87.5%), while 28 samples (7%) generated errors and 22 samples (5.5%) produced incomplete results (Table 2). Among the valid outcomes provided by miLab™ platform, 156 samples (39%) were identified as positive, comprising 146 P. falciparum (Pf), 7 P. vivax (Pv), and 3 mixed Pf/Pv infections. A total of 131 samples (32.8%) were classified as negative, and 63 samples (15.8%) were categorized as “review needed” (Table 1).Table 1. Results obtained by the three malaria diagnostic methods tested in this study (miLab™ automated microscopy platform, thin blood smear microscopy, and NM-PCR)miLab™ automatedmicroscopy platform^1^Thin blood smearmicroscopyNM-PCRPositive Pf146178283Positive Pv7611Positive PoNA814Positive PmNA513Mixed infection (Pf + Pm)NA04Mixed infection (Pf + Pv)301Mixed infection (Pm + Po)NA01Mixed infection (Pf + Po)NA12Negative13119271HemolysisNA10NAReview needed63NANAError28NANAIncomplete22NANATotal number of samples400400400Pf Plasmodium falciparum, Pv P. vivax, Po P. ovale, Pm P. malariae, NA not applicable. ^1^miLab™ automated microscopy platform results provided by the system before “review needed” reclassificationTable 2Summary of Plasmodium detection results by diagnostic methodMethodValid results, n (%)Positive, n (%)Negative, n (%)Errors/incomplete/excluded, n (%)miLab™ microscopy350 (87.5%)182 (45.5%)168 (42.0%)50 (12.5%)Thin blood smear microscopy390 (97.5%)198 (49.5%)192 (48.0%)10 (2.5%)NM-PCR400 (100%)329 (82.2%)71 (17.8%)0 (0%)N number of samples
The “review needed” samples were further analyzed by an expert microscopist and reclassified as either positive (26 samples; 41.3%) or negative (37 samples; 58.7%). After expert review, the final results from the miLab™ platform were 182 positive samples (45.5%) and 168 negative samples (42%) (Table 2).
Thin blood smear microscopy was successfully performed on 390 samples (97.5%), with 10 samples excluded due to hemolysis (Table 1). These hemolysis samples provided seven “incomplete/error,” one “review needed,” one “negative,” and one ‘P. falciparum positive suspected” results with the miLab™ platform. Of the valid samples, 198 (49.5%) were identified as positive and 192 (48%) as negative (Table 2). One mixed infection involving P. falciparum and P. ovale was detected.
Using NM-PCR, all samples were successfully analyzed (Tables 1 and 2). Among them, 329 samples (82.2%) tested positive, while 71 samples (17.8%) were negative. Of the 329 positive cases, 283 were identified as P. falciparum, 11 as P. vivax, 14 as P. ovale, and 13 as P. malariae (Table 1). Additionally, eight mixed infections were detected: four P. falciparum + P. malariae, two P. falciparum + P. ovale, one P. malariae + P. ovale, and one P. falciparum + P. vivax.
The agreement between the miLab™ platform and conventional microscopy was substantial, with an overall concordance of 90.8% and a Cohen’s kappa coefficient of 0.8 (95% CI 0.8–0.9) (Table 3, Additional file 2: Table S1).Table 3. Comparison of the three malaria diagnostic methodsSensitivity% (CI 95%)Specificity% (CI 95%)PPV% (CI 95%)NPV% (CI 95%)Kappacoefficientvalue (CI 95%)Comparison ofmiLab™and conventional microscopy92.1%(87.8–96.4%)89.4%(84.5–94.3%)90.1%(85.4–94.7%)91.6%(87.0–96.1%)0.8(0.8–0.9)Comparison ofmiLab™and NM-PCR62.8%(57.0–68.6%)95.4%(89.5–100.0%)98.4%(96.2–100.0%)36.9%(29.3–44.5%)0.4(0.3–0.4)Comparison ofconventional microscopy and NM-PCR62.1%(56.6–67.6%)100%(99.3–100%)100%(99.8–100%)37.0%(29.9–44.1%)0.4(0.3–0.5)CI confidence intervalThe table shows the agreement between results obtained using the miLab™ automated microscopy platform, thin blood smear microscopy, and NM-PCR, summarizing the sensitivity, specificity, positive predictive value (PPV), negative predictive value (NPV), and the kappa coefficient, with their 95% confidence intervals
The comparison between the miLab™ platform and NM-PCR (Table 4) yielded a sensitivity of 62.8% (95% CI 57.0–68.6%) and a specificity of 95.4% (95% CI 89.5–100.0%). The overall concordance between both methods was 68.9%, with a kappa coefficient of 0.4 (95% CI 0.3–0.4) (Table 3).Table 4. Comparative results between the miLab™ automated microscopy platform and NM-PCRNM-PCRPositivePfPositivePvPositivePoPositivePmMixed infection(Pf + Pm)Mixed infection(Pf + Po)Mixed infection(Pm + Po)Mixed infection(Pf + Pv)NegativemiLab™malariamicroscopy^1^Pf positive suspected15602210103Pv positive suspected610110000Pf/Pv positive suspected002001000Po positive003000000Pm positive000100000Plasmodium spp.100000000Negative83946210162Error2201000005Incomplete1512300001^1^Categorized results after reclassification of “review needed” results by an expert microscopist. Pf P. falciparum, Pv P. vivax, Po P. ovale, Pm P. malariae
Conventional thin blood smear microscopy was also compared with NM-PCR (Additional file 2: Table S2), providing 62.1% (95% CI 56.6–67.6%) and 100% (95% CI 99.3–100%) values of sensitivity and specificity, respectively (Table 3).
Regarding miLab™ platform species identification, out of the 246 valid P. falciparum results identified by NM-PCR, the miLab™ platform correctly detected 156 cases as P. falciparum (Table 4), representing a detection rate of 63.4%. When excluding negative miLab™ results, the identification accuracy increased to 95.7% (156/163). However, six P. falciparum infections were misclassified as P. vivax by the miLab™ platform (Additional file 3: Fig S2).
One P. vivax, three P. ovale, and one P. malariae infections identified by NM-PCR were correctly classified by the miLab™ platform after expert review of the initial “review needed” result. Additionally, four P. ovale infections identified by NM-PCR were misclassified by the miLab™ platform as P. falciparum (n = 2) or as P. falciparum/P. vivax mixed infections (n = 2). Similarly, three P. malariae infections were misclassified as P. falciparum (n = 2) or P. vivax (n = 1) (Table 4).
The mixed infection of P. falciparum + P. vivax detected by NM-PCR was not detected by the miLab™ platform. In contrast, one mixed infection of P. falciparum + P. malariae was detected as a single P. falciparum infection, and one mixed infection of P. falciparum + P. ovale was detected as mixed P. falciparum/P. vivax infection. The remaining mixed infections were either misclassified or not detected by the miLab™ platform and reported as negative (Table 4).
Parasitemia values (parasites/µL) obtained using the miLab™ platform were compared with those determined by thin blood smear microscopy in 161 samples. A significant Spearman correlation was observed (p = 0.0), with a correlation coefficient of 0.77 (Fig. 1), indicating a very high positive correlation. On average, parasite counts estimated by the miLab™ device were 11.6% lower than those obtained by conventional microscopy.Fig. 1. Correlation between parasite density (parasites/µL) measured by the miLab™ platform and expert thin blood smear microscopy for samples positive by both diagnostic methods
Discussion
Timely diagnosis of malaria is critical for appropriate patient treatment and management. In this study, the performance of the miLab™ platform for malaria diagnosis was prospectively evaluated at the Spanish National Malaria Reference Laboratory, located in a nonendemic malaria area. Its diagnostic accuracy was compared with two established methods: conventional light microscopy using thin blood smears, as a conventional method for malaria diagnosis, and nested multiplex malaria PCR (NM-PCR), as a molecular method with increased sensitivity compared with conventional methods and able to detect submicroscopic malaria infections.
The comparison of miLab™ digital microscope with conventional microscopy yielded high values of sensitivity and specificity. Even 15 out of 18 samples that were classified as positive by miLab™ microscopy (6 after expert microscopist reclassification) but negative by conventional microscopy were positive by NM-PCR (12 P. falciparum, 1 P. vivax, 1 P. ovale, and 1 Plasmodium spp.), pointing out the proper diagnosis made by miLab™ and incorrect diagnosis by thin blood smear microscopy in those samples. The similar performance of the miLab™ device to blood smear microscopy found in this study was also found in previous articles [4, 18], although a previous study showed increased sensitivity of miLab™ microscopy compared with conventional microscopy at a health post in Ethiopia and with expert microscopy in Ghana [27].
The comparison of the miLab™ platform and NM-PCR results showed moderate values of sensitivity, while the specificity was high. However, the kappa coefficient showed fair agreement. Similar results of sensitivity, specificity, and kappa coefficient were obtained for thin blood smear microscopy in comparison with NM-PCR. These results can be explained by the higher sensitivity of molecular methods [8, 28], and the characteristics of the setting where the study was performed. The MAPELab acts as the malaria reference laboratory where samples from patients suspected of having malaria are sent from different Spanish hospitals. These samples mainly include travelers and visiting friends and relatives patients (VFRs), most of them with suspected malaria symptoms but others without clinical symptoms returning from endemic areas. In addition, malaria symptoms are very unspecific and may overlap with other infectious diseases [29–31], leading to the detection of submicroscopic malaria infections when molecular techniques are used in a reference center, even in cases where other pathogens are primarily responsible for the clinical symptoms of the patients. Submicroscopic malaria can be defined as patients with negative blood smears and detection of Plasmodium spp. DNA by a molecular method [32]. A previous study showed a prevalence of submicroscopic malaria in afebrile immigrants in Spain of 5.7% [32]. Furthermore, in malaria-endemic areas, submicroscopic malaria accounts for a high percentage of infections, with studies showing detection rates of 14.2% in Kenya [33], 1.2% and 12.8% in different areas in Ethiopia [34], and 11.8% in Cameroon [35]. In fact, 90 out of 106 samples that were negative by the miLab™ platform but positive by NM-PCR were also negative by conventional microscopy, suggesting that, irrespective of clinical symptoms, these could be considered submicroscopic malaria infections. Then, if these negative samples with low parasitemias are not taken into account, the miLab™ automated microscopy sensitivity would increase to 91.8%.
Among samples positive by the miLab™ device, it assigned the wrong species to 13 of 175 monoinfections detected by NM-PCR, and in 1 sample the species could not be determined by the operator after a “review needed” result. Accuracy in the identification of P. falciparum infections was high, with 95.7% of these samples providing a positive result, and just six samples classified such as P. vivax infections and another one as Plasmodium spp. The main reason for this P. vivax misidentification was the detection of gametocyte forms, which the device classified as P. vivax. Nevertheless, this misidentification occurred in samples assessed during 2021, with the first version of the device, but not with successive versions. The Plasmodium spp. sample was a “review needed” infection where the expert microscopist could not achieve species identification owing to the low number of parasite forms. The identification of P. vivax, P. ovale, P. malariae, and mixed malaria infections was not successful with the miLab™ device; however, operator review of “review needed” results could achieve the identification of some of these species. Among the 11 P. vivax infections detected by NM-PCR, miLab™ provided 9 negative results, 1 Pv positive suspected (after reclassification of a “review needed” result), and 1 incomplete result. Conventional microscopy did identify six P. vivax infections (four negatives, the Pv positive suspected result, and one incomplete result by miLab™), while the other five infections were negative. The misidentification of P. ovale and P. malariae parasites responds to the design of the miLab™ algorithm, which has not been trained to identify them with the current AI model, so these are not yet included as detectable targets. Nevertheless, operator review of “review needed” results provided the identification of three P. ovale and one P. malariae infections. This is also the reason for the low accuracy in detecting mixed malaria infections. The miLab™ platform provided three “Pf/Pv suspected” results, one corresponding to a sample positive for P. falciparum and P. ovale by NM-PCR, correctly identified by conventional microscopy, and two corresponding to P. ovale infections, detected by conventional microscopy, too. The other mixed infections detected by NM-PCR were not detected by either automated or conventional microscopy. The higher sensitivity of molecular methods in the identification of mixed infections compared with microscopy is well known [36]. In addition, just one of the mixed infections in this study comprised P. falciparum and P. vivax parasites, the two species which are the target of the miLab™ device, and this sample provided a negative result by both microscopy techniques, suggesting a low level of parasites. The accuracy of the miLab™ device in detecting mixed infections in this study was low, although in a previous study, mixed infections identification by the miLab™ platform was moderate, with 5 of 18 mixed-species infections correctly identified [27].
In addition to positive (P. falciparum positive suspected, P. vivax positive suspected, and Pf/Pv positive suspected) and negative results, the miLab™ device provides “incomplete,” “error,” and “review needed” results. The number of incomplete and error results found in this study was quite similar (22 and 28 samples, respectively). The occurrence of these results may be related to the delay in receiving the samples at the reference laboratory from the hospitals, which may lead to blood hemolysis or to failures in storage and transportation of the samples. “Review needed” results, given for 15.8% of samples, were more frequent in samples positive by NM-PCR (38/63). This classification of the sample made by the miLab™ device allows the operator to review the suspected results and categorize them as either negative or positive, which has been shown to increase the specificity of the automated microscope [4]. In this study, such operator review reclassified 25 samples negative by NM-PCR as negative results, while the remaining 38 “review needed” samples were classified as either positive (26 samples) or negative (12 samples).
Parasite density calculations obtained by both microscopy techniques, viz. automated and conventional, were compared, showing a high correlation coefficient. However, the calculated parasitemia was relatively lower with the miLab™ device than with expert conventional microscopy. One of the possible reasons for this difference is the lack of identification of parasite shapes other than rings. This may also be influenced by the delay in receiving the samples at a reference center, about 2–5 days from blood collection at Spanish hospitals. This might alter parasite forms [37], leading to failure to identify or misidentification of Plasmodium parasites, which may underestimate parasitemia values.
Some limitations of this study may have influenced the results. The main one is the delay in receiving some samples. This delay might alter parasite forms and affect the ability of the miLab™ device to provide results. However, the operator is able to verify the result provided by the automated microscopy when it is displayed on the screen and change it if necessary. Also, improvements in the miLab™ diagnostic algorithm are ongoing, which will provide improvements in parasite species identification [27]. In addition, the low number of P. falciparum + P. vivax mixed infections (just one sample) limited the assessment of mixed infections identification by the miLab™ platform. This low number of P. falciparum + P. vivax mixed infections derives from the fact that the majority of the migrant population in Spain comes from sub-Saharan Africa, where P. vivax and therefore mixed P. vivax infections are less common [38].
The operational characteristics of the miLab™ platform make it a suitable tool for use in both endemic and nonendemic malaria settings. In nonendemic areas, the typically low demand for malaria diagnostics often leads to a decline in the number of expert microscopists. Conversely, many endemic countries face increasing case numbers but lack the infrastructure and resources to systematically train and retain skilled personnel, making it difficult to ensure consistent microscopy quality.
Conclusions
In this study, the miLab™ platform demonstrated sensitivity comparable to that of conventional microscopy, and it may serve as a valuable tool for malaria diagnosis in both endemic and nonendemic malaria settings. Furthermore, performing the test shortly after sample collection could address some of the limitations observed in this study related to delayed sample processing, which affected parasite detection.
Overall, the miLab™ platform offers a promising solution for malaria diagnosis without the need for expert microscopists. However, further improvements are needed in terms of species identification and parasite quantification to enhance its diagnostic utility.
Supplementary Information
Supplementary material 1. The miLab™ device screen showing a Pf positive suspected result (A) and a negative result (B) after automated analysisSupplementary material 2. Additional file 2: Table S1. Comparative results between the miLab™ automated microscopy platform and the thin blood smear microscopy (n=400). Table S2. Comparative results between the thin blood smear microscopy and the NM-PCR (n = 400)Supplementary material 3. Additional file 3: Fig S2: The figure shows two P. falciparum samples misidentified as P. vivax by the miLab™ platform (one at the top and one at the bottom). A Results from the miLab™ device showing infected red blood cells with ring forms and the identification provided by the automated microscope: “P. vivax suspected”. B: P. vivax gametocyte detected by the miLab™ device in the sample analyzed in A. C miLab™ device screen showing infected erythrocytes with ring forms and the “P. vivax suspected” result provided by the miLab™ microscope. D P. vivax gametocyte detected by the miLab™ platform in the sample shown in C
The reference list from the paper itself. Each links out to its DOI / PubMed record.
- 1WHO. Global technical strategy for malaria 2016–2030, 2021 update. 2021. https://www.who.int/publications/i/item/9789240031357. Accessed 11 Oct 2024
- 2WHO. Malaria microscopy quality assurance manual-version 2. 2016. https://www.who.int/publications/i/item/9789241549394. Accessed 25 Oct 2024
- 3Pembele GN, Rojas L, Núñez FÁ. Insuficiencias cognoscitivas para el diagnóstico microscópico de la malaria de técnicos de la red laboratorios de Luanda, Angola. Biomédica. 2015 36(1). http://www.revistabiomedica.org/index.php/biomedica/article/view/2623. Accessed 25 Oct 2024
- 4mi Lab. Noul. 2024. mi Lab Platform. https://noul.com/en/milab/. Accessed 25 Oct 2024.
- 5ECDC. Malaria. Annual Epidemiological Report for 2022. 2024. https://www.ecdc.europa.eu/sites/default/files/documents/MALA_AER_2022_Report%20FINAL.pdf
- 6t-Test, Chi-Square, ANOVA, Regression, Correlation. https://datatab.net/tutorial/spearman-correlation. Accessed 14 Jul 2025.
- 7Malm KL, Nyarko KM, Kenu E, Bart-Plange C, et al. Malaria and respiratory syncytial virus as causes of acute febrile illness in an urban paediatric population in Ghana. 2014. https://zenodo.org/doi/10.5281/zenodo.10878344. Accessed 10 Dec 2024.10.5281/zenodo.10878344 PMC 1110036538764796 · doi ↗ · pubmed ↗