Decoding the first mitogenomes of Polycelis (Platyhelminthes, Tricladida, Planariidae): genomic architecture, evolutionary dynamics, and phylogenomic implication
Ning Li, Yan-Kun Shen, De-Zeng Liu, Zi-Mei Dong, Guang-Wen Chen

TL;DR
This study decodes the mitochondrial genomes of four Polycelis species, revealing their genomic structure and evolutionary relationships within a group of freshwater flatworms.
Contribution
The first comparative analysis of Polycelis mitogenomes, providing new insights into their evolution and phylogeny.
Findings
Four Polycelis mitogenomes each contain 12 protein-coding genes, 22 tRNA genes, 2 rRNA genes, and a non-coding region.
Phylogenomic analysis shows Polycelis forms a monophyletic group within Planariidae with distinct gene rearrangements.
Evolutionary analysis reveals cox1 has low variability while nad6 shows high sequence diversity.
Abstract
The genus Polycelis is characterized by the arrangement of multiple eye spots along the anterior dorsal margin of the head. These freshwater planarians are predominantly distributed in high-altitude ecosystems of temperate and subarctic zones across the Northern Hemisphere. Despite their significance as ecological bioindicators and models for regeneration, Polycelis remains controversial in taxonomy and phylogeny due to a critical lack of molecular data. Mitochondrial genomes (mitogenomes) have emerged as powerful tools for resolving deep phylogenetic relationships and species boundaries in morphologically conserved taxa. In this study, we present the first comparative mitogenomic analyses of four Polycelis species and phylogenetic reconstructions within Tricladida. Through next-generation sequencing, we successfully assembled four complete mitogenomes of Polycelis species. Each…
Genes, proteins, chemicals, diseases, species, mutations and cell lines named across the full text — each resolved to its canonical identifier and authoritative record.
Click any figure to enlarge with its caption.
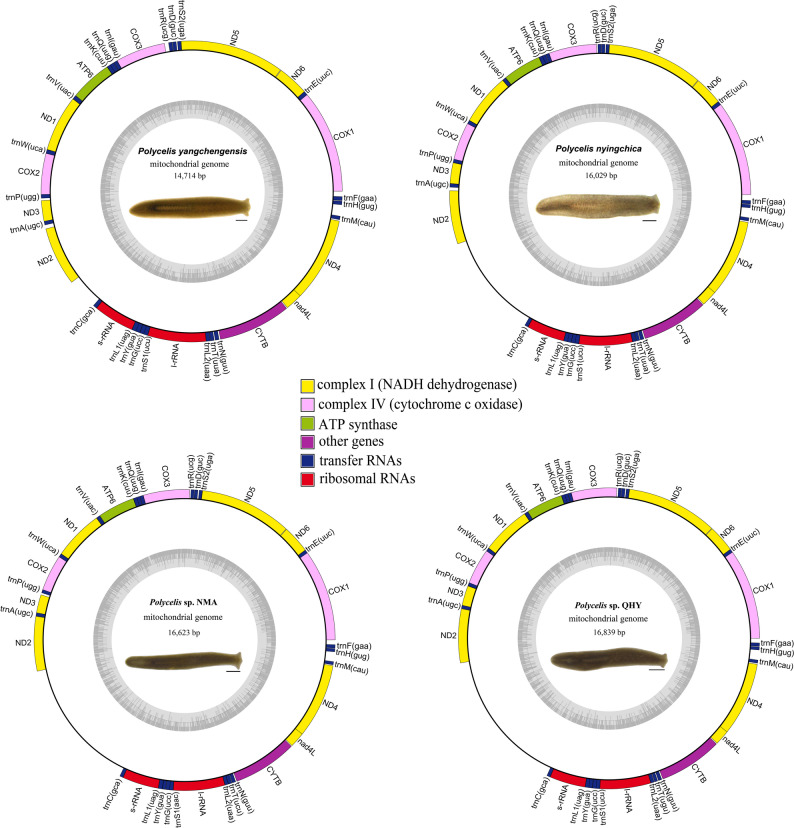 Figure 1
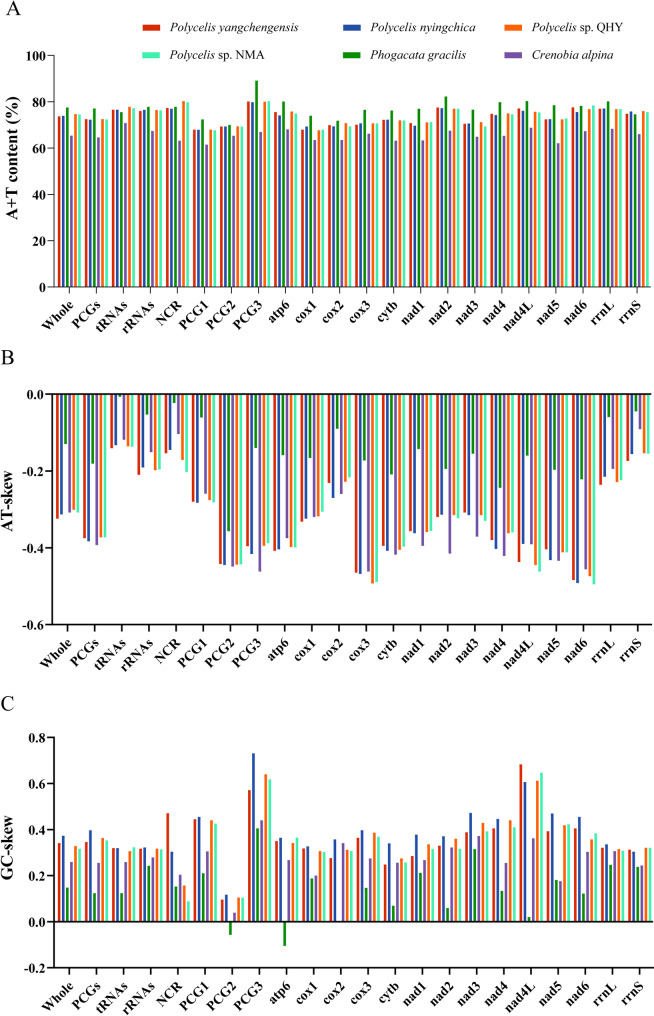 Figure 2
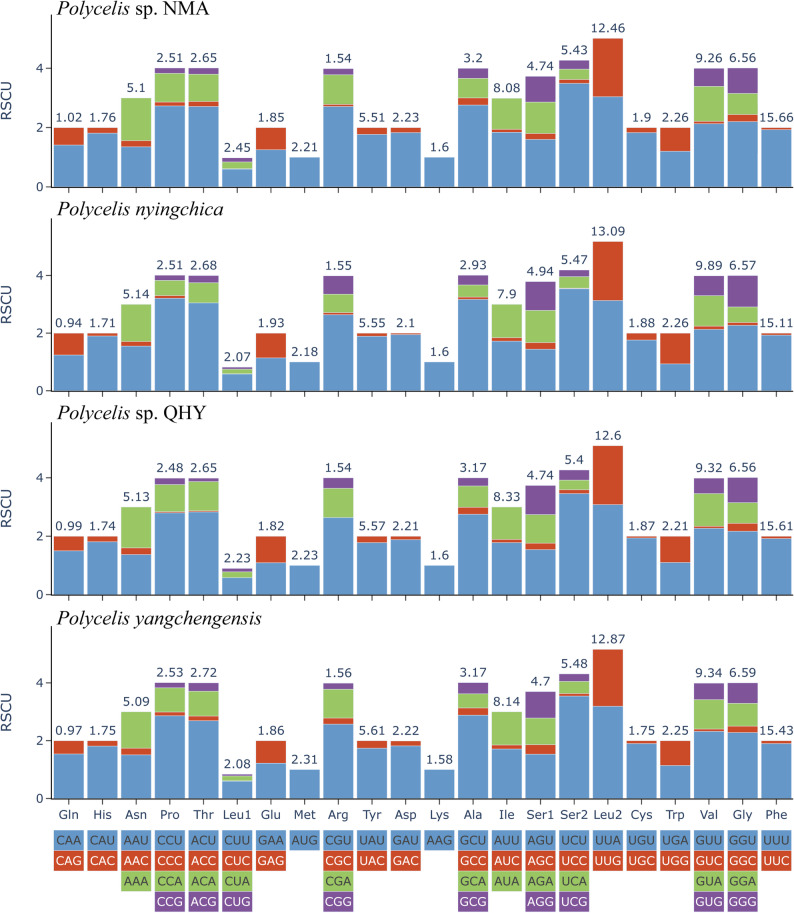 Figure 3
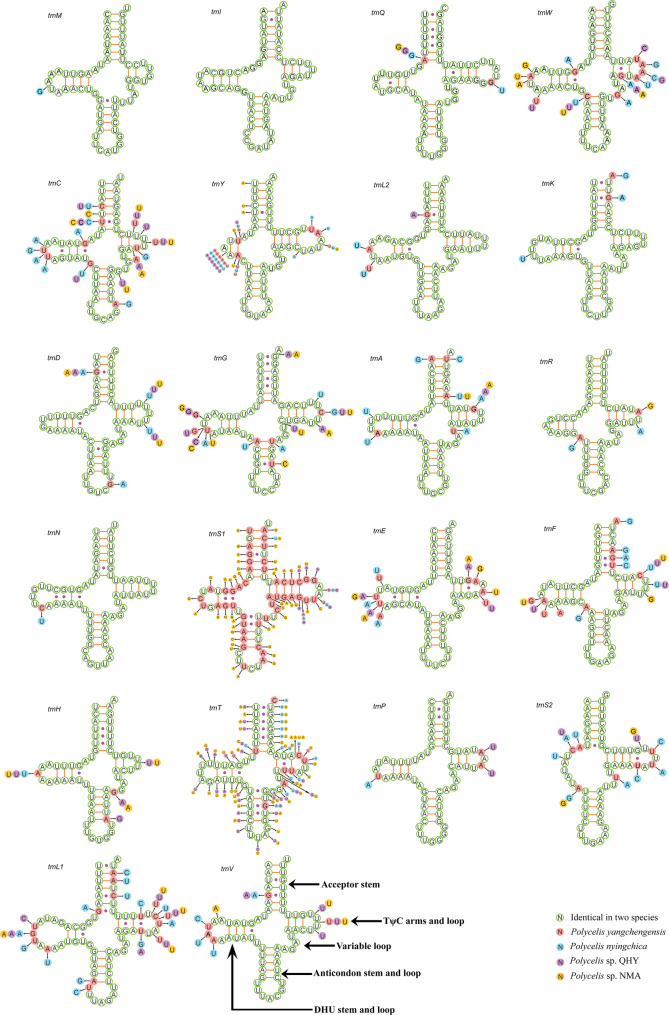 Figure 4
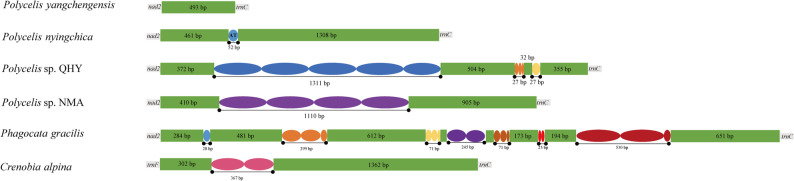 Figure 5
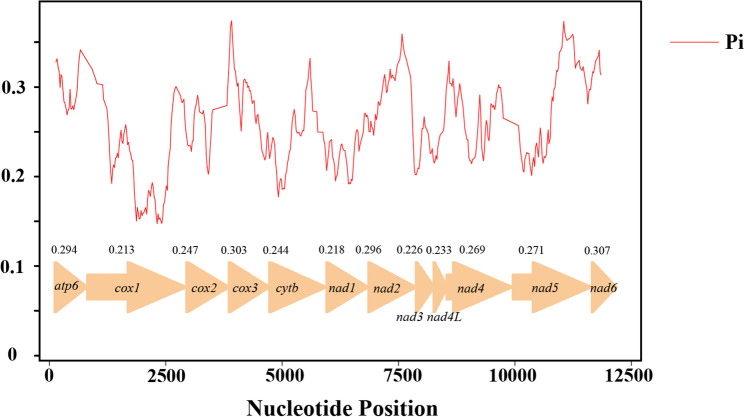 Figure 6
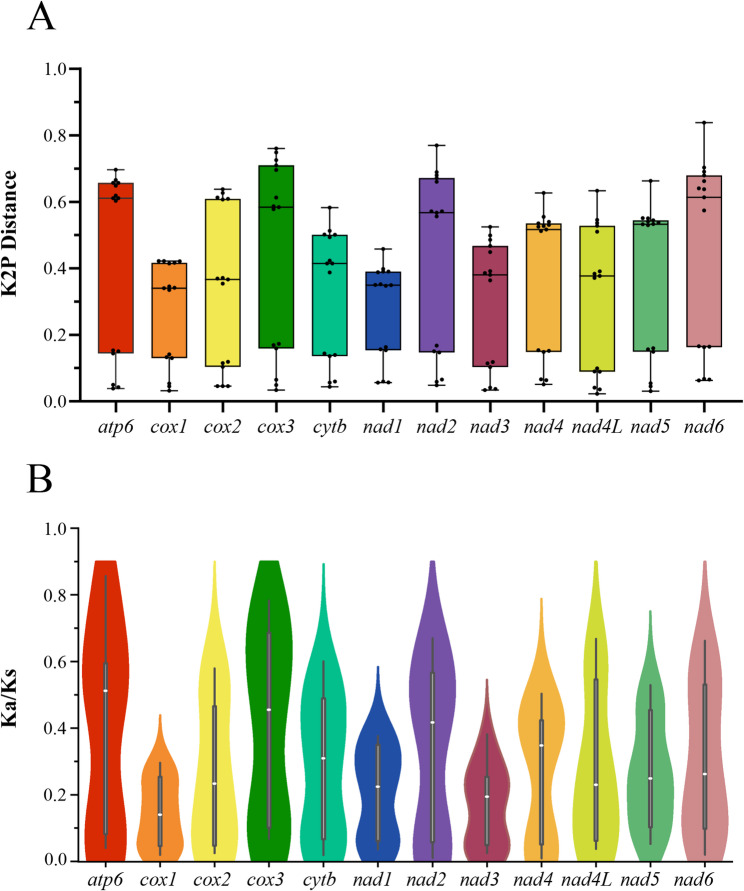 Figure 7
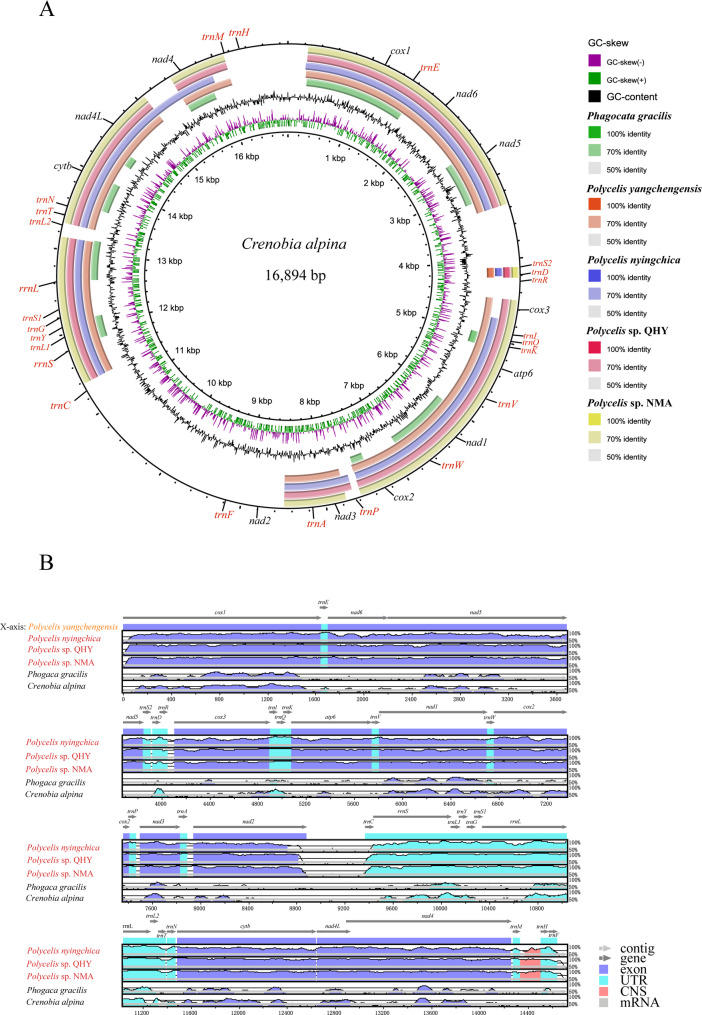 Figure 8
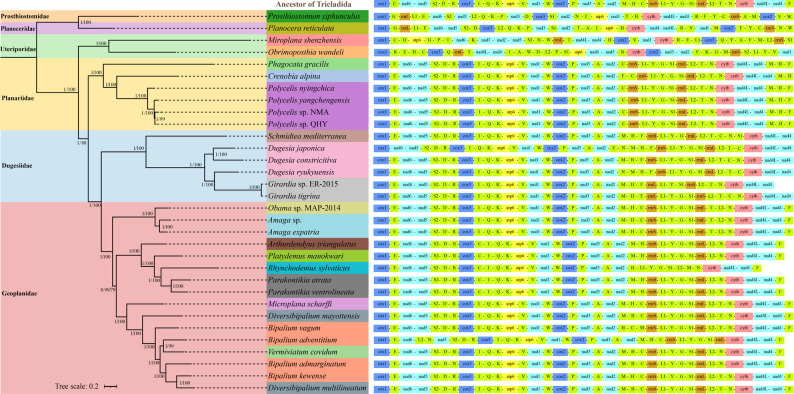 Figure 9
- —National Natural Science Foundation of China
- —https://doi.org/10.13039/501100017699Henan Postdoctoral Science Foundation
- —Henan Youth Talent Support Program
Peer Reviews
No public reviews on file for this paper yet. If you reviewed it on a platform where reviews are public (OpenReview, ICLR, NeurIPS, ICML), you can paste yours below so the community can read it here.
Videos
No videos yet. Explain this paper in a talk, walkthrough, or lecture? Add one.
Taxonomy
TopicsPlanarian Biology and Electrostimulation · Marine Invertebrate Physiology and Ecology · Cephalopods and Marine Biology
Background
The genus Polycelis Ehrenberg, 1831 [1] (Platyhelminthes: Turbellaria: Tricladida: Planariidae) derives its specific epithet from the numerous eyespots arranged in two rows along the anterior margin of the dorsal cephalic region [2]. Morphological synapomorphies of this genus include, rounded or arched anterior cephalic margin; robust and elongated pharynx situated in the anterior portion of the posterior body half; genital pore positioned near the caudal extremity; and extremely reduced indistinct common atrium [3]. These flatworms typically inhabit cold, clean freshwater environments of springs, streams, and river source zones [4] and are the critical member of freshwater planarian. This taxon has emerged as an ideal model organism for toxicological and regenerative biology research due to its remarkable environmental contaminant sensitivity [5] and extraordinary regenerative capacity [6, 7]. However, taxonomic delineation and phylogenetic resolution within this clade remain constrained by methodological limitations and insufficient molecular datasets.
Taxonomy of Polycelis is mainly based on the external features (body colour and size, cephalic morphology, eye number), histological examinations (pharyngeal musculature types, male atrium muscular architecture, absence of adenodactyls, reproductive system characters), and chromosomal karyotypes. However, these approaches exhibit remarkable limitations. External features show the high degree of interspecific similarity and considerable intraspecific variation within Polycelis species. For instance, cephalic morphology may vary from arcuate to triangular configurations, with rounded auricular protrusions extending laterally. Moreover, the number of eyes exhibits significant plasticity, ranging from dozens to approximately two hundred across individuals or populations. The histological features can be unreliable in accurately distinguishing close species, having elevated taxonomic error rates, leading to the proliferation of synonyms [8]. Moreover, the taxonomic validity of several putative species remains uncertain. Additionally, histological analyses present a critical operational limitation: they require the examination of sexually mature specimens to characterize reproductive organ. However, specimens collected in the field usually lack sexually reproductive stages, resulting in the absence of critical reproductive structures essential for species identification, thereby precluding conventional taxonomic analyses based on histological criteria. In contrast, chromosomal karyotyping can be applied to asexual individuals, providing cellular genetic markers through the quantification of chromosome numbers and morphological characters, which offers a validated complementary approach for taxonomy within the genus Polycelis [9, 10]. However, chromosomal polymorphism has been documented in specific Polycelis species, including P. nigra Müller, 1774, P. tenuis Ijima, 1884, and P. felina Dalyell, 1814, which encompass polyploid and aneuploid cytotypes [10–12]. Therefore, the integration of novel datasets is expected to contribute to resolving taxonomic ambiguities within Polycelis.
Molecular taxonomic and phylogenetic research on Polycelis remains significantly limited. Among over 40 species, molecular data have been reported for only five [13–20]. Modern phylogenetic analyses of Polycelis are based primarily on single-gene markers (cox1, 18S rRNA, or 28S rRNA) to reconstruct the evolutionary relationships within Tricladida and to assess its taxonomic position among Platyhelminthes. However, phylogenetic incongruences persist at both familial and generic levels, particularly regarding the disputed placement of Planariidae within the order Tricladida and the unresolved sister-group relationships among Polycelis, Phagocata, and Crenobia within the family [21, 22].
The limited resolution of single-gene markers, as exemplified by 18S rRNA [23] which is the predominant molecular marker used in Polycelis and Planariidae phylogenetics, underscores the need for multi-locus approaches. Consequently, phylogenetic analyses based on mitogenomes provide concatenated datasets of multiple genes and establish a robust framework to resolve intergeneric relationships within Planariidae (Tricladida) with improved topological accuracy.
The mitogenomes of Platyhelminthes are single-stranded circular DNA molecules, typically ranging in size from 14 kb to 21 kb. These mitogenomes generally consist of 12 protein-coding genes (PCGs), 22 transfer RNA genes (tRNAs), two ribosome RNA genes (rRNAs). The mitogenomic analyses can provide critical genome-scale insights into evolutionary features through base composition, gene arrangement, and genetic code deviations [24]. The mitogenomes are characterized by a simple genetic architecture, small size, maternal inheritance, high copy number, low recombination frequencies, and accelerated evolutionary rates [25]. Consequently, mitogenomic data have emerged as a powerful tool for species delimitation, phylogenetic reconstruction, molecular evolutionary studies, population structure analyses, and comparative genomics across diverse animal taxa [26, 27]. However, to date, only two mitogenomes—Crenobia alpina (Dana, 1766) and Phagocata gracilis (Haldeman, 1840)—have been reported within Planariidae, a family comprising 12 genera and approximately 190 species. Notably, the genus Polycelis comprising over 40 recognized species remains entirely unexplored in terms of complete mitogenomes annotation, representing a critical gap in comparative genomics and phylogenetic analysis for this taxonomically diverse group.
In this study, we firstly present the mitogenome sequences for four Polycelis species to address existing issues in the classification and phylogenetic relationships within the genus Polycelis. This study characterized the mitogenome structure, including gene arrangement, genome size, nucleotide composition, codon usage, tRNA secondary structures, gene overlaps, intergenic spacers, and non-coding regions. Comparative analysis by integrating these data with previously two published Planariidae mitogenomes facilitated the identification of effective molecular markers for molecular taxonomy and phylogenetic reconstruction within the genus Polycelis and among Planariidae genera [21, 22]. Additionally, phylogenetic analyses were conducted incorporating four Polycelis species and all 26 publicly available Tricladida mitogenomes (published or accessible via NCBI) to resolve inter-familial and inter-generic evolutionary relationships and clarify the phylogenetic position of Polycelis within the order [22, 28–42].
Methods
Sample collection and DNA extraction
The specimens of four Polycelis species, including two formally published species (Polycelis nyingchica Liu, 1994 and P. yangchengensis Dong, Chen, Zhang & Liu, 2017) and two undescribed species (Polycelis sp. NMA and Polycelis sp. QHY), were collected from freshwater habitats across China between 2021 and 2024. Polycelis sp. NMA was gathered in Nanma’an Village, Hui County, Xinxiang City, Henan Province (35.68°N, 113.61°E) on 5 October 2021. Polycelis sp. QHY was collected from a spring in Qinheyuan National Wetland Park, Qinyuan County, Changzhi City, Shanxi Province (36.79°N, 112.05°E) on 12 July 2022. The specimen of P. nyingchica [43] was obtained from a small stream in Zheba Village, Bayi District, Nyingchi City, Xizang Autonomous Region (29.82°N, 93.77°E) on 24 August 2023. P. yangchengensis [3] was found beneath a small waterfall in Hougou Village, Yangcheng County, Jincheng City, Shanxi Province (35.27°N, 112.15°E) on 5 May 2024. All collected specimens were maintained in a 10 °C incubator. Following sexual maturation, specimens underwent precise dissection of the pharyngeal and posterior genital regions for histological analysis to confirm species identification. Concurrently, anterior body fragments were cultured in the incubator to induce complete regeneration into morphologically intact individuals for subsequent mitochondrial DNA extraction [44]. The Polycelis specimens were submitted to Novogene Co., Ltd. (Beijing, China) for sequencing on the Illumina NovaSeq 6000 platform [45], which generated ≥ 5 GB of raw data.
Morphological comparisons from histological analysis
The flatworms were relaxed by exposure to 1% nitric acid in a petri dish and then fixed in Bouin’s fluid for 24 h. After fixation, the specimens were rinsed in 70% ethanol, dehydrated in a graded ethanol series, cleared with xylene, and embedded in paraffin wax. The embedded blocks were sectioned serially at a thickness of 6 μm using a retracting rotary microtome. The sections were stained with either hematoxylin and eosin or Casson’s Mallory-Heidenhain stain [46]. Photographs were taken with a Leica digital camera attached to a compound microscope. Histological voucher specimens have been deposited at the Zoological Museum of Henan Normal University.
Mitogenome assembly and annotation
The raw data were imported into VMware Workstation Pro v17.0.0 [47], and filtered using fastp [48], including trimming adapter sequences, removing high-N-rate sequences, short-lenth sequences, and low-quality reads, to obtain high-quality clean data. The Seqtk [49] was employed for extracting the mapped reads. The randomly selected mapped reads were used for mitogenome assembly via NOVOPlasty v4.3.3 [50], utilizing the cox1 sequence of Crenobia alpina (Planariidae) as reference. The mitogenomes were annotated using MitoZ v3.6 [51] with genetic code 9 (Echinoderm Mitochondrial). Subsequently, further sequence analysis of the gene was aligned and annotated using Geneious Prime v8.1.3 [52]. The two rRNA genes (rrnS and rrnL) were manually annotated by aligning homologous regions with published mitogenomes of closely related species and with neighbouring genes. Unsuccessfully annotated protein-coding genes (PCGs) by MitoZ were identified through ORF prediction combined with homology database to manually validate the sequence boundaries. The 22 tRNAs and their secondary structures were predicted using the MITOS2 plugin [53] on the Galaxy Europe platform (http://usegalaxy.org) with genetic code 9. The comparative visualization of tRNA structures across four Polycelis species was performed using Adobe Illustrator 2023 [54].
Genetic distance analysis of the cox1 gene
To substantiate species delineation, we performed a genetic distance analysis of the mitochondrial cox1 gene. The dataset integrated cox1 sequences extracted from the four novel mitogenomes with additional cox1 sequences amplified via PCR from 6 to 7 specimens per species to assess interspecific differences and intraspecific variation. The cox1 gene was amplified using the universal primers BarTF (ATAGGTGGKTTTGGTAAT) and COIR (ATTWAYAWCAACACTACGAC) [55, 56] under standard PCR conditions. All sequences were aligned using MAFFT, and pairwise genetic distances were calculated under the Kimura 2-parameter (K2P) model with MEGA v11.0 [57].
Comparative analysis and visualization of mitogenomes
The annotated mitogenomes was visualized as a circular map using OGDraw [58]. The mitogenomes of Phagocata gracilis and Crenobia alpina (Planariidae) were downloaded from NCBI (https://www.ncbi.nlm.nih.gov) for comparative genomic analyses. The relative synonymous codon usage (RSCU), nucleotide composition, and base composition skews (AT-skew = (A − T) / (A + T) and GC-skew = (G − C) / (G + C)) were analyzed using PhyloSuite v1.2.3 [59]. We conducted genomic evolutionary analyses using DnaSP v5.10.01 [60], including quantification of the nucleotide diversity (Pi) across PCGs, sliding window assessments (window size: 200 bp, step size: 20 bp) to detect variation distribution patterns, and evolutionary selection pressure evaluation through the ratio of non-synonymous (Ka) and synonymous substitutions rates (Ks) of PCGs. Genetic distances of the 12 PCGs were calculated using the Kimura 2-parameter (K2P) model in MEGA v11.0 [57]. Data visualization was performed using GraphPad Prism v9.0.0 [61] for A + T content, AT-skew, GC-skew, and genetic distances, while Ka/Ks ratios were plotted in OriginPro 2022 (OriginLab Corporation, Northampton, MA, USA). Tandem repeats of the non-coding region were identified using Tandem Repeats Finder [62], and their secondary structures were predicted by MFold software [63]. Comparative homology analysis of 6 complete mitogenomes was performed using BLAST + v2.16.0 [64], with alignment results visualized via the BLAST Ring Image Generator (BRIG) [65]. Further visualization of the particular sequence identity results was analyzed by the mVISTA Web Server [66].
Gene rearrangement analysis
The ancestral gene order of Tricladida was reconstructed using the MLGO web server [67]. The inferred ancestral gene arrangement was visualized with the gene order of known Tricladida species and analyzed for mitochondrial gene rearrangements. The reference tree used to map gene arrangements was modified based on phylogenetic analyses.
Phylogenetic analyses
Four newly sequenced Polycelis mitogenomes and 26 publicly available mitogenomes from four families within Tricladida (Planariidae, Dugesiidae, Dendrocoelidae, Kenkiidae), retrieved from NCBI were chosen as the ingroup (Table 1), and two Polycladida flatworm species, Prosthiostomum siphunculus and Planocera reticulata were selected as outgroups [68, 69].
Table 1. Details of the species and mitogenomes used in this studyOrderFamilySpeciesSize(bp)Accession no.ResourceTricladidaGeoplanidae Bipalium adventitium 15,494MZ561467[36] Bipalium admarginatum 18,990NC072986[40] Bipalium kewense 15,666NC045216[30] Bipalium vagum 17,149MZ561468[36] Vermiviatum covidum 15,540MZ561472[36] Diversibipalium mayottensis 15,989MZ561470[36] Diversibipalium multilineatum 15,660MZ561469[36] Arthurdendyus triangulatus 20,309NC085462[32] Parakontikia atrata 16,513NC068631[34] Parakontikia ventrolineata 17,210MT081960[29] Amaga expatria 14,962NC057980[38]Amaga sp.14,909PP727122[37]Obama sp. MAP-201414,909KP208777[22] Rhynchodemus sylvaticus 16,891PQ468469[42] Platydemus manokwari 19,959MT081580[31] Microplana scharffi 15,291PP711816[33]Dugesiidae Schmidtea mediterranea 16,562KM115583Unpublished Girardia tigrina 15,938MW972220[28]Girardia sp. ER-201515,951KP090061[21] Dugesia constrictiva 17,634OK078614[44] Dugesia ryukyuensis 17,015AB618488[39] Dugesia japonica 17,799AB618487[39]Planariidae Crenobia alpina 16,894KP208776[22] Phagocata gracilis 18,759KP090060[21] Polycelis yangchengensis 14,714PV946914This study Polycelis nyingchica 16,029PV946912This studyPolycelis sp. QHY16,839PV946913This studyPolycelis sp. NMA16,623PV946911This studyUteriporidae Miroplana shenzhensis 14,344NC062124[35] Obrimoposthia wandeli 15,185NC050050[41]PolycladiaProsthiostomidae Prosthiostomum siphunculus 15,181KT363736[65]Planoceridae Planocera reticulata 15,486LC503531[66]
Thirty-six genes (12 PCGs, 2 rRNAs, and 22 tRNAs) were extracted from the mitogenomes using PhyloSuite (v1.2.3). The extracted 12 PCGs, two rRNAs, and 22 tRNAs were aligned separately using MAFFT [70], employing distinct algorithms based on gene type: the L-INS-i algorithm for PCGs and the E-INS-i algorithm for rRNAs and tRNAs. After alignment, ambiguous sites were removed using Gblocks [71]. The genes used for phylogenetic tree construction were concatenated using the “Concatenate Sequence” module built into PhyloSuite [59], and the output was saved in “Phylip” format for subsequent tree construction.
Phylogenetic trees were reconstructed for Tricladida using Bayesian inference (BI) and maximum likelihood (ML) analyses. Five datasets were generated for phylogenetic analyses: (1) P12R: 12 PCGs excluding third codon position + 2 rRNAs (12,311 bp), (2) P123: 12 PCGs (14,133 bp), (3) P123R: 12 PCGs + 2 rRNAs (17,022 bp), (4) P123RT: 12 PCGs + 2 rRNAs + 22 tRNAs (19,301 bp), (5) P123-AA: amino acid sequences of the 12 PCGs. The best-fit substitution models and partitioning schemes [see Additional file 1] for the five datasets were inferred using PartitionFinder 2 [72]. Bayesian analysis was performed using MrBayes v3.2.6 [73] with running 2 × 10^6^ generations of MCMC and sampling every 1,000 generations. Convergence of independent runs was assessed using a standard deviation of split frequencies < 0.01 in MrBayes v3.2.6 and effective sample size (ESS) values > 200 in Tracer v1.7 [74]. The first 25% of samples were discarded as burn-in, and the remaining samples were used to generate the tree and estimate the posterior probabilities (PP). The best-fit substitution model [see Additional file 2] was selected using ModelFinder [75], which was subsequently implemented in IQ-TREE [76] for Maximum likelihood (ML) tree construction with 5,000 ultrafast bootstrap replicates to assess the reliability of the internal branches [35, 46]. The phylogenetic trees were annotated and visualized using ITOL [77] and FigTree v1.4.4 [78].
Results
Morphological differences for species diagnosis
Our comparative morphological analysis of the reproductive apparatus [see Additional file 3] identified clear and consistent diagnostic characters among the four Polycelis species. P. nyingchica is characterized by an elongated male atrium with the penis papilla positioned distant from the gonopore and the penis bulb occupying only half of the dorso-ventral space. In contrast, the other three species exhibit shorter male atrium with the penis papilla extending to or protruding through the gonopore and substantially larger penis bulbs filling over three-quarters of the dorso-ventral space. A key diagnostic feature of P. yangchengensis is the vague boundary between its penis papilla and penis bulb, combined with the absence of a distinct seminal. In contrast, the other three species are characterized by clearly asymmetrical dorsal and ventral penis papilla lips and well-developed seminal vesicles that occupy one-third or more of the penis bulb space. Furthermore, Polycelis sp. QHY can be readily distinguished by its extremely slender bursal canal. This characteristic serves as a critical diagnostic feature distinguishing it from its closely related congener, Polycelis sp. NMA.
The combination of these stable morphological differences across multiple reproductive structures provides robust morphological evidence for recognizing them as distinct species.
Genetic distance analysis of the cox1 gene
Genetic distance analysis performed on a 786 bp alignment of the mitochondrial cox1 gene revealed significant molecular divergence among the four putative Polycelis species [see Additional file 4]. The intraspecific genetic variation was remarkably low in all four species: P. yangchengensis (0–0.26%), Polycelis sp. NMA (0–0.26%), Polycelis sp. QHY (0–0.38%), and P. nyingchica (0–1.0%). In contrast, interspecific distances revealed substantial differentiation, with values ranging from 3.8% to 14.0%. Notably, the minimum interspecific distance (3.8–4.5%) was observed between Polycelis sp. QHY and Polycelis sp. NMA, while the maximum divergence (13.5–14.0%) occurred between P. nyingchica and Polycelis sp. NMA. The minimum interspecific distance (3.8–4.5%) was substantially greater than the maximum intraspecific distance (1.0%).
The consistent and significant discontinuities in genetic distances, with all interspecific values markedly higher than intraspecific variation, provide robust molecular evidence for recognizing them as distinct species. These molecular data are fully congruent with the morphological evidence, jointly validating the taxonomic hypothesis of four separate species within the Polycelis.
Basic structure and nucleotide composition
The newly sequenced complete mitogenomes of Polycelis are typical circular, single-stranded structures. The mitogenomes of all four species contained 12 protein-coding genes (PCGs), 22 tRNAs, 2 rRNAs, and one non-coding region, with identical gene arrangement patterns (Fig. 1). Mitogenomes vary in lengths from 14,714 bp in P. yangchengensis to 16,839 bp in Polycelis sp. QHY, with P. nyingchica (16,029 bp) and Polycelis sp. NMA (16,623 bp) exhibiting intermediate sizes. These size variations were primarily attributed to differences in the non-coding region lengths.
Fig. 1. Mitochondrial genome arrangements of four Polycelis species. Scale bar: 500 μm
The mitogenomes of Polycelis showed strong AT bias, ranging from 73.7% (P. yangchengensis) to 74.7% (Polycelis sp. QHY), with P. nyingchica and Polycelis sp. NMA showing intermediate values of 73.9% and 74.5%, respectively [see Additional file 5]. The high A + T content in all four species was determined by their PCGs, rRNAs, tRNAs, and non-coding regions. Among these regions, the non-coding regions exhibited the highest A + T content (77.0%–80.3%), specifically 77.0% in P. nyingchica, 77.3% in P. yangchengensis, 79.8% in Polycelis sp. NMA, and 80.3% in Polycelis sp. QHY. Comparative analysis with other Planariidae species, Crenobia alpina consistently displayed lower A + T content than other species, while Phagocata gracilis showed higher A + T content in its PCGs, rRNAs, and entire genome. However, C. alpina and Ph. gracilis exhibited lower tRNA A + T content compared to the four Polycelis species (Fig. 2A). Analysis of the 12 PCGs revealed that nad2 had the highest A + T content, while cox1 showed the lowest across the Polycelis.
Fig. 2. Comparison ofthe A + T contents, nucleotide skewness of six Planariidae species. **A **A + T content; **B **AT-skew; **C **GC-skew. PCG1, the first codon position; PCG2, the second codon position; PCG3, the third codon position; Whole, the complete sequences of whole mitogenome; NCR, Non-coding region
Nucleotide skew analysis revealed consistently negative AT-skew and positive GC-skew values across all four Polycelis mitogenomes (Fig. 2B, C), indicating similar nucleotide bias patterns among these species. Nucleotide skew analysis across the six Planariidae species revealed that Ph. gracilis had the slightly negative AT-skew, while C. alpina showed the pronouncedly negative AT-skew closer to Polycelis species, with lower similarity than that observed among Polycelis congeners (Fig. 2B). Ph. gracilis exhibited significantly lower GC-skew than other Planariidae species. Except for weakly negative values in PCG2 and atp6, and neutral skew in cox2, all other regions showed slightly positive GC-skew. The GC-skew values of C. alpina were exclusively within the range observed in four Polycelis species for its non-coding regions and protein-coding genes cox2, nad2, and cytb, while all other regions exhibited lower GC-skew values than those of the four Polycelis species (Fig. 2C).
Protein-coding genes and condon usage
The PCGs measured 10,827 bp in P. yangchengensis and 10,899 bp in P. nyingchica, while those in Polycelis sp. QHY and Polycelis sp. NMA were 10,938 bp and 10,911 bp, respectively [see Additional file 5].
The newly sequenced Polycelis mitogenomes contained both standard ATN (ATG/ATT) and non-standard (GTG/TTG) initiation codons. These non-standard initiation codons occurred in seven PCGs (cox2, cox3, atp6, nad2, nad3, nad4L, nad6). TTG functioned as the initiation codon for nad6, nad4L, and cox2 in all four Polycelis species, and for cox3 in three species (excluding Polycelis sp. NMA). GTG served as the initiation codon for nad3 in all species except Polycelis sp. QHY, and for nad2 in P. yangchengensis and P. nyingchica. The most prevalent initiation codon was ATG, which occurred in five PCGs across all specimens. The termination codons consisted of complete TAA/TAG and incomplete “T-” or “TA-” [see Additional file 6]. TAA occurred more frequently than TAG, with “T-” typically serving as the termination codon for cox1 and “TA-” for nad3.
The four Polycelis species exhibited similar amino acid composition and relative synonymous codon usage (RSCU) patterns in their mitogenomes (Fig. 3). The total number of codons in PCGs ranged from 3,598 to 3,627 [see Additional file 7]. The three most frequently used codons were UUA (Leu2), AUU (Ile), and UUU (Phe), all consisting exclusively of A/U bases (Fig. 3). A/T nucleotides occurred more frequently than G/C at the third codon position, reflecting the strong A + T bias in the mitochondrial PCGs among Polycelis.
Fig. 3. Relative synonymous codon usage (RSCU) of the mitogenomes of four Polycelis species
Transfer and ribosomal RNA genes
Twenty-two transfer RNA genes (tRNAs) of four sequenced Polycelis mitogenomes dispersed throughout the entire mitogenome (Fig. 1). The tRNA regions were 1,411 bp in both Polycelis sp. QHY and Polycelis sp. NMA, while P. yangchengensis and P. nyingchica showed slightly shorter lengths of 1,409 bp and 1,406 bp, respectively [see Additional file 5]. The 22 tRNAs varied in size from 58 bp (trnR) to 72 bp (trnL1) [see Additional file 6]. Based on the secondary structure, 21 of 22 tRNAs could fold into canonical cloverleaf secondary structures, while trnS2 lacked the DHU arm, forming only a simple loop (Fig. 4). Comparative analysis of tRNAs across the four species revealed higher nucleotide substitution rates in trnC, trnT, trnL1, and trnS1 relative to other tRNAs. The TΨC and DHU arms exhibited greater variability compared to the anticodon loop. Based on predicted secondary structures, six types of mismatched base pairs (A-A, A-C, A-G, G-U, U-C, and U-U) were identified across the four mitogenomes.
Fig. 4. Secondary structure for the tRNAs of four Polycelis species
All four mitogenomes contained only four tRNA genes located between the two rRNA genes (rrnL and rrnS). The rrnL gene was 919–921 bp, while rrnS ranged from 647 to 651 bp across the four mitogenomes. The rrnS gene was located between trnC and trnL1, while rrnL was positioned between trnS1 and trnL2 [see Additional file 6].
Overlapping sequences and intergenic spacers
Gene overlaps were identified at 13 loci across the four mitogenomes. All four species exhibited seven identical gene overlap regions [see Additional file 6]: nad5-trnS2 (2 bp), cox3-trnI (2 bp), trnQ-trnK (11 bp), trnK-atp6 (1 bp), trnW-cox2 (3 bp), cox2-trnP (5 bp), and nad4L-nad4 (32 bp). Intergenic spacers were identified at 12 loci, ranging from 1 to 171 bp in length. The length of intergenic spacers exhibited greater variability compared to overlapping regions.
Non-coding region
In the mitogenomes of four Polycelis flatworms, the non-coding region located between nad2 and trnC exhibited marked length variation. Polycelis sp. QHY possessed the longest region (2,628 bp), while P. yangchengensis displayed the shortest (493 bp). The corresponding lengths in P. nyingchica and Polycelis sp. NMA were 1,821 bp and 2,425 bp [see Additional file 5].
This study identified various tandem repeat elements in the non-coding region of Polycelis mitogenomes. All species except P. yangchengensis exhibited specific tandem repeats. Both Polycelis sp. QHY and Polycelis sp. NMA possessed extended tandem repeats, measuring 1,311 bp and 1,110 bp, respectively. The other tandem repeat units were smaller, ranging from 27 to 32 bp. Variations in repeat unit length and copy number across Polycelis species resulted in different sizes of their non-coding regions. In addition to the four sequenced Polycelis mitogenomes, two additional Planariidae species (Ph. gracilis and C. alpina) were also found to have specific tandem repeats ranging in size from 25 bp to 530 bp (Fig. 5). Potential stem-loop secondary structures were identified in the non-coding regions of all six species [see Additional file 8].
Fig. 5. Organization of the control region in Planariidae mitochondrial genomes. The colored ovals indicate the tandem repeats; the remaining regions are shown with green boxes
Nucleotide diversity and evolutionary rate
For comprehensive analysis, the four sequenced Polycelis mitogenomes were compared with two additional Planariidae species (Ph. gracilis and C. alpina). Sliding window analysis of 12 PCGs across six Planariidae mitogenomes revealed variable nucleotide diversity: nad6 (0.307), cox3 (0.303), nad2 (0.296), and atp6 (0.294) showed higher values, while cox1 (0.213), nad1 (0.218), nad3 (0.226), and nad4L (0.233) exhibited lower diversity (Fig. 6). Nucleotide diversity (Pi) analysis of the four Polycelis species showed slightly different patterns compared to the six Planariidae species analysis, with relatively higher values in nad6 (0.111), nad2 (0.104), nad5 (0.101), and cox3 (0.0978), and lower diversity in nad4L (0.0604), cox2 (0.0742), nad3 (0.0777), and cox1 (0.0821) [see Additional file 9].
Fig. 6sliding window analysis of protein-coding genes of the six Planariidae species. The red curve shows the value of nucleotide diversity (Pi). Pi value of each PCGs was shown above the arrows
Pairwise genetic distance analysis revealed similar inconsistencies between intra-generic and inter-generic comparisons within Planariidae. Among the six species from three genera in Planariidae, nad6 (0.449), cox3 (0.443), nad2 (0.425), and atp6 (0.423) exhibited the highest average genetic distances (Fig. 7A), indicating faster evolutionary rates in these four genes. Conversely, cox1 showed the lowest average K2P distance (0.266), followed by nad1 (0.293), nad3 (0.271), and nad4L (0.310) [see Additional file 10], indicating these genes are relatively conserved. The average interspecific K2P distances among the four Polycelis species revealed higher values for nad6 (0.122), nad2 (0.116), nad5 (0.108), and cox3 (0.107), while nad4L showed the lowest distance (0.0633), followed by cox2 (0.0789), nad3 (0.0864), and cox1 (0.0878) [see Additional file 11].
Fig. 7 **A **Genetic distance of each protein-coding gene among six Planariidae species; **B **Ratio ofnon-synonymous (Ka) to synonymous (Ks) substitution rates of each protein-coding gene among six Planariidae species
The pairwise Ka/Ks analyses showed that the average Ka/Ks ratios (ω) of 12 PCGs are from 0.141 to 0.406 (0 < ω < 1), indicating pervasive purifying selection across these protein-coding genes (Fig. 7B). The genes cox3 (0.406), atp6 (0.400), nad2 (0.329), and nad6 (0.297) exhibited relatively higher Ka/Ks ratios, while cox1 (0.141), nad3 (0.164), nad1 (0.203), and cox2 (0.258) showed lower values [see Additional file 12]. Ka/Ks analysis across Polycelis species revealed that while the highest (nad5: 0.108) and lowest (nad4: 0.0358) ω values differed from those observed in the six Planariidae species comparison [see Additional file 13]. All 12 PCGs of Polycelis consistently exhibited ω values within the range of 0 < ω < 1.
Sequence identity analysis
Multiple sequence alignment of the six Planariidae mitogenomes revealed significant sequence identity within the Polycelis genus. Using C. alpina as the reference genome, BLAST analysis revealed the following the order from innermost to outermost: Ph. gracilis, P. nyingchica, P. yangchengensis, Polycelis sp. QHY, and Polycelis sp. NMA (Fig. 8A). Specifically, relatively high and stable sequence identity was found in the protein-coding regions, with pairwise comparisons among Polycelis species consistently exceeding 75% identity. The mVISTA alignment (Fig. 8B) demonstrated high gene sequence homology among the four Polycelis species, with significantly higher intra-generic than inter-generic sequence identity.
Fig. 8 A BLAST comparison of six Planariidae mitogenomes. The comparison has been made with the Crenobia alpina as the reference species. In the outermost ring, the protein-coding genes are labelled in black, and other genesare labelled in red; **B **Major intragroup sequence identity variation visualized by BLAST alignment. The alignment was done against Polycelis yangchengensis. The names of Polycelis in the same group are in red
Gene rearrangement
We incorporated the four newly sequenced species and 26 publicly available Tricladida sequences from NCBI to compare gene arrangements across 19 genera from 4 families with ancestral Tricladida. Among the 30 analyzed species, we identified 12 distinct gene rearrangement patterns, including translocations, local inversions, and gene deletions (Fig. 9).
Fig. 9. Phylogenetic tree produced by Bayesian inference based on the dataset of P123RT. Numerals at nodes are Bayesian posterior probabilities (PP) and bootstrap support values (BS), respectively
Within the family Uteriporidae, the genera Miroplana and Obrimoposthia exhibited two distinct gene rearrangement patterns, both showing extensive divergence from the ancestral Tricladida arrangement. All PCGs and tRNAs underwent substantial reorganization.
The four Polycelis species exhibited identical gene orders, and the genetic pattern is relatively conservative. Within the family Planariidae, the genera Polycelis and Phagocata share identical gene order, whereas Crenobia exhibits a distinct rearrangement involving translocation of trnF: the original nad2-trnF-trnC cluster is rearranged to trnH-trnF-cox1. Comparative analysis revealed that Polycelis, Crenobia, and Phagocata maintained ancestral Tricladida PCG arrangements, with only rearrangements of tRNA genes present. In Polycelis and Phagocata, trnM-trnH is displaced between nad4 and trnF, whereas in Crenobia, trnF and trnM-trnH exchanged positions.
The Dugesiidae family exhibited five distinct gene rearrangement patterns across Dugesia, Schmidtea, and Girardia genera. The Schmidtea mitogenome exhibited tRNA rearrangements relative to ancestral Tricladida, with trnF shifting from nad4-cox1 to trnH-rrnS, trnS1 relocating from trnG-rrnL to trnN-cytb, and trnC moving from trnH-rrnS to trnT-trnN. Girardia sp. ER-2015 lacked both trnG and trnC genes compared to G. tigrina, while maintaining identical PCG arrangements. Compared to the ancestral Tricladida gene arrangement, trnF relocated from between nad4 and cox1 to between trnH and rrnL, while trnC shifted from between trnH and rrnS to between trnT and trnN. The three Dugesia species exhibited three distinct gene arrangements, primarily differing in trnE and trnN positions, while maintaining identical PCG organization relative to ancestral Tricladida, except for some tRNAs that have changed position.
Within Geoplanidae, ten genera exhibited four distinct gene rearrangement patterns. Microplana, Diversibipalium, and two Bipalium species (B. vagum and B. kewense) maintained the ancestral gene order. The gene order of Obama is consistent with that of Amaga, and they exhibit a transposition of trnT and trnL2 relative to the ancestral arrangement. The genera Arthurdendyus, Platydemus, and Parakontikia shared identical gene arrangements, exhibiting two modifications from the ancestral pattern: loss of trnT and translocation of trnC from between trnH and rrnS to between cox3 and trnI. Vermiviatum and Bipalium admarginatum have the same gene order, exhibiting complete conservation of the ancestral arrangement except for the loss of trnT. Bipalium adventitium differed from both the ancestral Tricladida arrangement and three other Bipalium species by the translocation of trnL2-trnN from between rrnL and cytb to between trnE and nad5, along with the absence of trnT.
Phylogenetic analysis
Three distinct phylogenetic trees were generated using BI and ML analyses of five datasets (P12R, P123, P123R, P123RT, and P123-AA). The tree topologies derived from the four datasets P12R, P123, P123R, and P123RT under both BI and ML methods were highly consistent and showed strong nodal support (Fig. 9). In contrast, the trees inferred from the P123-AA dataset exhibited certain topological discrepancies in the relationships among the four families [see Additional file 14].
The ML and BI phylogenetic analyses based on the four datasets (P12R, P123, P123R, P123RT) consistently support Uteriporidae (Maricola) as the earliest diverging lineage within Tricladida (BS = 88, PP = 1) (Fig. 9). Planariidae diverged next, followed by the sister groups of Dugesiidae and Geoplanidae (BS = 100, PP = 1). The phylogenetic relationships among the four Tricladida families were supported as: (Uteriporidae + (Planariidae + (Dugesiidae + Geoplanidae))). The ML phylogenetic analysis based on P123-AA dataset indicated that Planariidae was the earliest diverging lineage within Tricladida [see Additional file 14 A]. Uteriporidae diverged next, followed by the sister groups of Dugesiidae and Geoplanidae (BS = 100). The phylogenetic relationships among the four families were inferred as: (Planariidae + (Uteriporidae + (Dugesiidae + Geoplanidae))). The BI phylogenetic analysis based on P123-AA dataset suggested a sister relationship between Uteriporidae and Planariidae, as well as between Dugesiidae and Geoplanidae, although both relationships with low support (PP = 0.5) [see Additional file 14B]. The overall phylogenetic relationships among the four families of Tricladida were reconstructed as follows: ((Planariidae + Uteriporidae) + (Dugesiidae + Geoplanidae)).
Phagocata was the basal lineage among the three genera of Planariidae (Fig. 9). The four Polycelis species formed a monophyletic clade sister to Crenobia with strong support (BS = 100, PP = 1). Within Polycelis, P. nyingchica from the Qinghai-Tibet Plateau represents the earliest-diverging basal lineage (BS = 100, PP = 1). The remaining species form a highly supported clade (BS = 100, PP = 1) comprising three endemic the Taihang Mountain taxa, within which Polycelis sp. NMA and Polycelis sp. QHY are sister species.
In Dugesiidae, Schmidtea formed a sister clade to Dugesia + Girardia with (BS = 100, PP = 1). The phylogeny revealed that Girardia tigrina and Girardia sp. ER-2015 were conspecific, forming a sister group to Dugesia ryukyuensis (BS = 100, PP = 1). Dugesia japonica and D. constrictiva were sister groups (BS = 100, PP = 1). This topology confirmed the paraphyletic status of Dugesia relative to Girardia (Fig. 9).
The three phylogenetic trees generated in this study show that Dugesiidae and Geoplanidae form sister groups. The monophyletic clade (Obama + Amaga) formed a sister group to all other Geoplanidae genera (BS = 100, PP = 1) (Fig. 9). For the P123RT dataset, BI and ML analyses support that the clade including Arthurdendyus, Platydemus, Rhynchodemus, and Parakontikia and the clade including Microplana, Diversibipalium, and Bipalium are each recovered as monophyletic, and these two monophyletic clades are sister to each other with moderate support (BS = 79, PP = 0.99). Notably, this topological arrangement demonstrates the paraphyly of Bipalium, as members of Bipalium are not clustered into a single exclusive clade.
Discussion
Features of mitogenome structure
The Polycelis mitogenomes exhibited high conservation in gene content, order, length, and nucleotide composition. Their genomic architecture followed the same organizational pattern observed in other Planariidae species. Nucleotide content and skewness analyses demonstrated strong AT bias, uniformly negative AT-skew and positive GC-skew across all four Polycelis species. This pattern reflects a genomic asymmetry with A + T content significantly exceeding G + C content, more A than T and more C than G, as previously reported in other planarians [21, 79].
Annotation of four sequenced mitogenomes revealed a universal absence of atp8 gene. Annotation challenges for atp8 stemmed from its rapid substitution rate and extreme divergence [80]. Previous studies have frequently reported atp8 gene loss in flatworm populations [22, 68, 81, 82]. However, recent studies have detected potential atp8 signals in flatworms through manual annotation and transcriptomic analyses [83]. Despite replicating the published atp8-detection methods, we discerned no transmembrane domain signals nor any corroborating evidence of atp8 in Polycelis mitogenomes. Notably, the putative atp8 sequences reported previously were all located in non-coding region [84], inconsistent with canonical atp8 genomic positions in most metazoans. Thus, our study could not definitively identify the atp8 gene, a limitation that may be resolved by future advances in sequencing and analytical methodologies.
In all four Polycelis specimens, trnS2 formed a simple loop structure due to the absence of a dihydrouridine (DHU) arm, consistent with observations in other Planariidae species [21, 22], and common in planarian mitogenomes [85]. All four Polycelis mitogenomes contained mismatched base pairs in tRNA stem regions, a widespread phenomenon among planarians [21, 22]. These mismatches may originate from anomalous base pairing [86, 87], undergo RNA-editing correction [88], or potentially enhance tRNA functional efficiency as suggested by recent studies [79, 89].
Two non-canonical initiation codons (GTG and TTG) were identified in all four Polycelis mitogenomes. Additionally, non-canonical codons TAT and TTA have been reported in Platyhelminthes [24]. These four atypical initiation codons were predominantly found in cox1, nad1, nad2, and nad5. The incomplete termination codons “TA-” and “T-” are commonly utilized in cox1, cox3, nad3, and nad5 genes of Polycelis. These truncated codons may affect gene expression levels or potentially be converted to complete TAA stop codons through post-transcriptional polyadenylation during mRNA maturation [90, 91].
Mitogenome sequence characteristics and nucleotide diversity
The Polycelis mitogenomes contained a major non-coding region ranging in size from 1,493 bp to 2,628 bp with relatively high nucleotide substitution rates. This region showed significant length and compositional variation across species, consistent with its characterization as the most variable mitogenomic region [92–94]. Tandem repeats in non-coding region, documented for the first time in Planariidae mitogenomes, are frequently found in planarian and other metazoan mitogenomes [95]. Variation in tandem repeat copy number and length among species and individuals directly contributes to non-coding length polymorphism, resulting in mitogenome size variation. Stem-loop structures were identified in planarian non-coding regions, this feature also reported in other platyhelminths, suggesting potential roles in replication and transcription initiation [96, 97].
Nucleotide diversity analysis facilitates the assessment of genetic differentiation among populations and aids in designing species-specific markers [98, 99], particularly for species identification and phylogenetic studies in Polycelis. The cox1 gene widely adopted as a universal barcode for animal species identification [100], exhibits relatively low variability within the Polycelis genus. But it represents the most evolutionarily conserved and least variable PCGs among the six Planariidae species. If the resolution power of cox1 was proved to be low, genes with sufficient large size, fast evolution, and elevated Ka/Ks ratios should be considered as potential marker candidates [98, 101].
Gene arrangement
Gene rearrangements were frequently observed in Tricladida mitogenomes, primarily involving tRNA positional changes. Gene order analysis revealed identical arrangements between Polycelis and Phagocata, but translocation events in Crenobia, suggesting its independent evolutionary trajectory within Planariidae. Distinct gene orders have proven highly diagnostic for delineating animal taxa across multiple taxonomic levels [102, 103]. The gene rearrangement pattern in Crenobia suggests that the genus should be an independent lineage within Planariidae. This specific feature of Crenobia likely resulted from independent mitogenomic evolutionary events. The gene arrangement in the genera Microplana, Diversibipalium, and two Bipalium species (B. vagum, B. kewense) aligns with the ancestral gene order, suggesting a conservative evolutionary divergence. The three Dugesia species exhibit gene rearrangements compared to the ancestral sequence, with distinct gene orders among species, suggesting relatively independent evolution. However, more representative mitogenomes from diverse populations are needed to validate this hypothesis.
Phylogenetic relationship
The ML and BI phylogenetic analyses based on P123-AA dataset reconstructed the relationship of four families, contradicting previous studies [44, 104]. Our finding that marine planarians form a clade with terrestrial and freshwater planarians. The phylogenetic position of four families within Tricladida in our study aligns with previous findings [44, 104] based on four datasets (P12R, P123, P123R, and P123RT). The results reaffirm freshwater planarians as a paraphyletic group, revealing that the freshwater species of Dugesiidae show closer phylogenetic affinity to terrestrial planarians than to other freshwater planarians.
In this study, we analyzed two published Girardia species, which formed a strongly supported clade (BS = 100, PP = 1) but did not cluster as sister groups with Dugesia. Although previous studies generally support Girardia and Dugesia as sister groups, and a monophyletic Dugesia [24, 105], our findings indicate that Dugesia is paraphyletic [29]. Such divergence arises from differing specimen datasets. Blastn analysis of the cox1 gene from our complete mitogenomes of Girardia tigrina showed highest similarity to Dugesia species in NCBI. Notably, it exhibited approximately 30% genetic distance from published G. tigrina cox1 sequences, far exceeding normal intraspecific variation. We suspect that taxonomic misidentification due to the lack of copulatory apparatus evidence may explain these phylogenetic inconsistencies, underscoring the need for further validation. The mitogenome releases for certain planarian species usually did not specify whether species identification was based on valid reproductive organ evidence or merely on superficial morphological traits and colour patterns [21, 29–34]. It is therefore essential to include morphological evidence when sequencing planarians for complete mitogenomes.
In the family Planariidae, phylogenetic analysis incorporating newly sequenced Polycelis mitogenomes revealed Phagocata as earliest diverging genus, whereas Polycelis and Crenobia formed a sister group. This contrasts with previous 18S rDNA-based phylogenies, which supported Phagocata and Polycelis as sister taxa [15]. These discrepancies indicate persistent limitations in elucidating the phylogenetic relationships within Tricladida, necessitating mitogenome sequencing of additional validated species and further population genetic and phylogenetic analyses [106].
Both mitochondrial phylogenomic analysis and BLAST comparisons revealed that the four Polycelis species formed a strongly supported clade with high sequence identity. The three Polycelis species from the Taihang Mountains exhibit noticeably shorter branches in phylogenetic trees compared to other congeners. Despite their shallow phylogenetic divergence, these species are clearly distinguishable by morphological differences in the reproductive apparatus, corroborated by interspecific genetic distances in the cox1 gene reaching 3.8–6.7%, well within the range expected for distinct species. This pattern likely results from a recent evolutionary event in the Taihang Mountains.
Conclusions
In this study, we sequenced and assembled four Polycelis mitogenomes, representing the first comprehensive comparative analysis of mitogenome for Planariidae. The comparative analysis revealed that Polycelis has strong AT bias that is identical to other Planariidae. There were differences in condon usage preferences among four Polycelis species. The Ka/Ks values of Polycelis were quantitatively lower than those reported for Planariidae, suggesting stronger purifying selection in the genes of the Polycelis. Based on the combined results of sliding window analysis, genetic distance calculation, and Ka/Ks ratio assessment, cox3 and nad6 may serve as potential DNA markers for species delineation in Polycelis and other Planariidae. Comparison of ancestral gene arrangements with those of 30 sequenced Tricladida species revealed 12 different patterns of gene rearrangement. Furthermore, the phylogenetic analysis results provide critical insights into the phylogenetic position of the Polycelis within Tricladida. This study provides a theoretical basis for inferring taxonomic characteristics of Planarian species and informing biodiversity conservation strategies in China.
Supplementary Information
Supplementary Material 1.
Supplementary Material 2.
Supplementary Material 3.
Supplementary Material 4.
Supplementary Material 5.
Supplementary Material 6.
Supplementary Material 7.
Supplementary Material 8.
Supplementary Material 9.
Supplementary Material 10.
Supplementary Material 11.
Supplementary Material 12.
Supplementary Material 13.
Supplementary Material 14.
The reference list from the paper itself. Each links out to its DOI / PubMed record.
- 1Ross E, Blair D, Guerrero-Hernández C, Alvarado AS. Comparative and transcriptome analyses uncover key aspects of coding-and long noncoding RN As in flatworm mitochondrial genomes. G 3. 2016;6(5):1191–200.10.1534/g 3.116.028175 PMC 485607226921295 · doi ↗ · pubmed ↗
- 2Rambaut A. Fig Tree. Tree figure drawing tool. 2018. http://tree.bio.ed.ac.uk/software/figtree/. Accessed 15 May 2025.