Patient-Specific Normalized Glandular Dose Range Estimate For Mammography
Lacey L. Medlock, Bryce Smith, Murtuza S Taqi, Joyoni Dey

TL;DR
This paper introduces a new method to estimate personalized radiation doses in mammography by accounting for glandular tissue distribution, improving accuracy over traditional methods.
Contribution
A patient-specific framework for estimating normalized glandular dose ranges using a single mammogram and glandular fraction map.
Findings
Normalized glandular dose (DgN) can vary by up to a factor of three based on glandular tissue depth distribution.
A Siddon ray-tracing-based back projection algorithm generates volumetric reconstructions preserving projection and glandular fraction data.
Realistic dose bounds can be derived from limited imaging data, enabling personalized dose assessment.
Abstract
Breast cancer is the most common cancer among women in the United States, and early detection is essential for reducing mortality. Screening mammography plays an important role in early detection by enabling identification of malignancies at earlier, more treatable stages. However, currently accepted dose estimation methods rely on simplified assumptions, typically modeling the breast as a homogeneous 50/50 mixture of adipose and fibroglandular tissue. Such assumptions neglect the substantial spatial heterogeneity of glandular tissue within individual breasts, most of which contain well below 50% FG tissue, and may therefore lead to inaccurate estimates of normalized glandular dose (DgN). In this work, we first show via Monte-Carlo Simulations the range of the DgN possible by just placing the fibroglandular tissue in the top, center or bottom for a range of breast models with GF…
Genes, proteins, chemicals, diseases, species, mutations and cell lines named across the full text — each resolved to its canonical identifier and authoritative record.
Click any figure to enlarge with its caption.
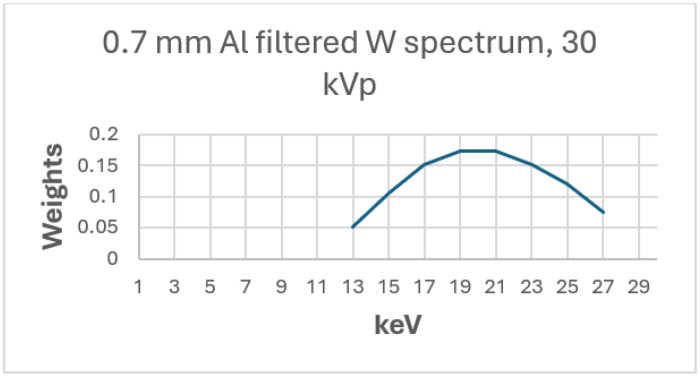 Figure 1
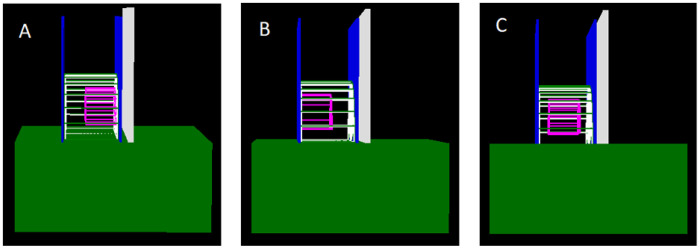 Figure 2
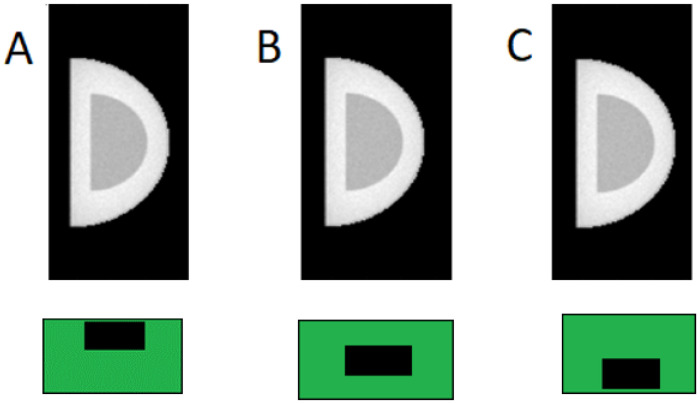 Figure 3
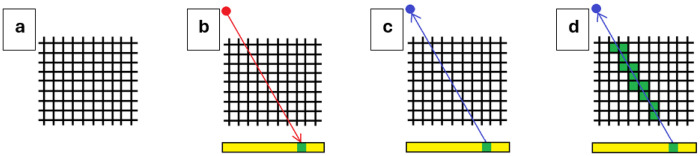 Figure 4
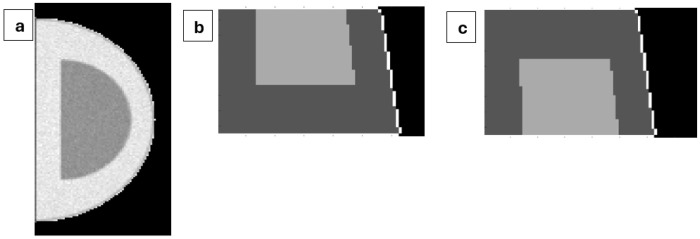 Figure 5
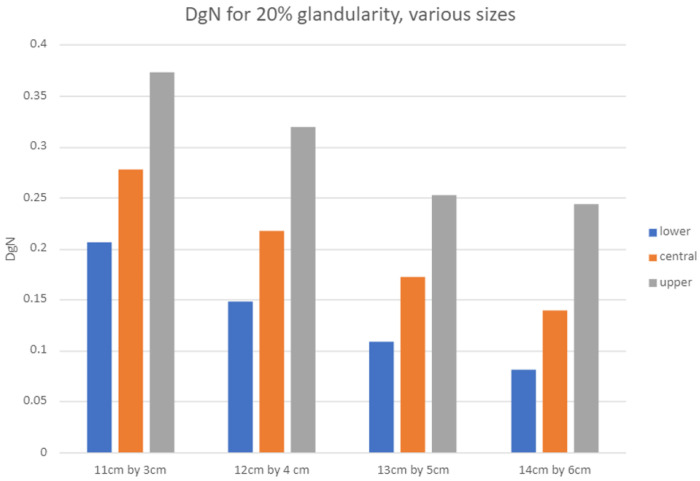 Figure 6
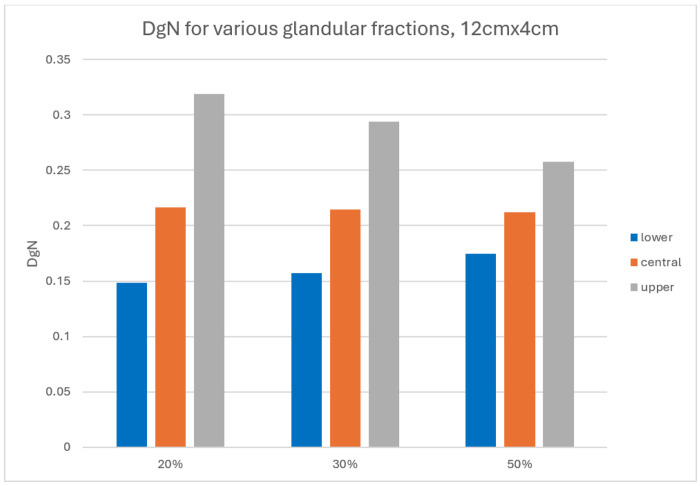 Figure 7
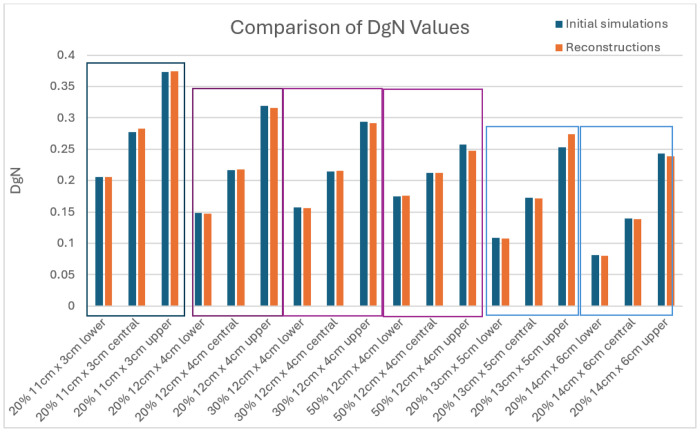 Figure 8
- —NIH NIBIB Trail-blazer Award
Peer Reviews
No public reviews on file for this paper yet. If you reviewed it on a platform where reviews are public (OpenReview, ICLR, NeurIPS, ICML), you can paste yours below so the community can read it here.
Videos
No videos yet. Explain this paper in a talk, walkthrough, or lecture? Add one.
Taxonomy
TopicsDigital Radiography and Breast Imaging · Medical Imaging Techniques and Applications · Radiation Dose and Imaging
INTRODUCTION
Breast cancer is the most frequently diagnosed cancer among women in the United States and the second leading cause of cancer-related mortality in this population [1]. Because prognosis is strongly dependent on stage at diagnosis, early detection is critical. The United States Preventive Services Task Force recommends biennial screening mammography for women at average risk between 50 and 74 years of age [2]. Given that X-ray mammography is the primary imaging modality for breast cancer screening, an average-risk woman may undergo approximately 13 screening mammograms in her lifetime, contributing to more than 39 million mammographic examinations performed annually in the United States [3].
Although mammography delivers a relatively low radiation dose [4], exposure to ionizing radiation carries a small but non-zero risk of radiation-induced cancer [5]. Consequently, accurate estimation of patient dose during screening remains and important component of risk-benefit analysis in breast cancer screening.
Conventional normalized glandular dose (DgN) estimation methods rely on parameterized models that account for anode/filter combinations and assume a homogeneous breast composed of a fixed, typically 50/50 mixture of adipose and fibroglandular tissue [6]. In reality, however, glandular tissue distribution is spatially heterogeneous and varies substantially, both between patients and within individuals. Ignoring this heterogeneity can lead to systemic under- or over-estimation of dose, depending on the true distribution of fibroglandular tissue within the breast [7].
In a prior work we have shown that a pixel-wise “glandular fraction” map maybe be obtained from a single projection, based on three-tissue modeling of breast [8].
Because a single mammographic projection does not uniquely determine the three-dimensional distribution of glandular tissue, exact patient-specific dose cannot be recovered from individual standard screening images. However, we can recover an approximate range for each patient from the projection images as well as the derived glandular fraction image.
The goal of this work, then, is not to estimate a single deterministic DgN value, but rather to determine a physically feasible range of DgN values consistent with a given mammographic projection and its associated glandular fraction map. By identifying the minimum, maximum and most-likely doses under these constraints, we aim to provide clinically meaningful bounds on patient dose that better reflect anatomical uncertainty.
METHODS
The methods are divided into two parts. In the first part the issue of DgN variation due to fibroglandular fraction distribution was investigated via Monte-Carlo simulations of mammographic projections and dose for different sized breasts for 20% glandular fraction, as well as different glandular fractions (20-50%) for a single breast size. For each case the fibroglandular tissue is placed at the top, center and bottom and the normalized DgN is calculated via Monte-Carlo. In the second part it is demonstrated that starting with a singular mammographic projection image and glandular fraction, which may be obtained by our prior method [8], it is possible to estimate a range of maximum, minimum and most likely DgN by back-projection and concentrating the fibroglandular tissue at the top, bottom and center respectively. The two methods are described in the following sub sections.
Monte Carlo Simulation to Estimate Range of Normalized Glandular Dose (DgN)
2.1
Monte Carlo simulations were performed to quantify the range of possible DgN values arising from different depth-wise distributions of fibroglandular tissue within simulated breast objects. Projection images were generated from simulated breast objects in which fibroglandular tissue is concentrated near the top, center, or bottom of the breast.
Dose to the fibroglandular tissue as well as normalized version were calculated.
All simulations were conducted using the TOPAS (Tool for Particle Simulation) framework, a wrapper for the Geant4 Monte Carlo toolkit. The simulation pipeline consisted of spectral generation, system geometry modeling, dose scoring within fibroglandular tissue, and normalization by entrance air kerma, each explained below.
Spectral Generation
To compute DgN for the various cases, a clinically representative X-ray spectrum was generated. Specifically, a 30-kVp tungsten anode spectrum with 0.7-mm aluminum filtration (W/Al) was modeled, corresponding to a common configuration used in screening mammography. The polyenergetic spectrum was discretized into 2 keV bins spanning 13-27keV (Figure 1). Energies outside this range were excluded due to their negligible contribution to dose.
TOPAS geometry and breast models
TOPAS version 3.7 with the Geant4 Option4 physics list, which includes the major photon interaction processes relevant to medical X-ray imaging–photoelectric absorption, Compton scatter, and Rayleigh scatter, was used to model a generic mammography system following established implementations in the literature [11,12]. The simulated mammography system included an X-ray source, lead beam-shaping block, water bath, Lexan compression paddles, anti-scatter grid, and a cesium iodide (CsI) detector (Figure 2).
The simulated breast was modeled as a semi-ellipsoidal volume composed of adipose tissue, fibroglandular tissue, and a 1.45-mm skin layer. Breast diameters ranged from 11.29 to 14.29 cm, with compressed thicknesses from 3.29 to 6.29 cm (Table 1). For all breast diameters, three cases with 20% glandular fraction by volume were modeled. For the 12.29-cm diameter breast, additional simulations were performed for glandular fractions of 30% and 50% by volume. These values were selected to represent the distribution of breast compositions commonly encountered in screening mammography. For each configuration, the fibroglandular tissue was arranged in three depth distributions: concentrated near the top (source side), center, or bottom (detector side) of the breast (Figure 3).
For each 2keV bin, 120 million photons were simulated, providing sufficient signal-to-noise ratio while maintaining feasible computation times. The resultant projections were weighted by the spectrum and added to obtain resultant projections (example shown in Figure 3).
Dose to the fibroglandular tissue was recorded, and entrance air kerma was estimated by tallying photons passing through a 3 cm × 3 cm scoring plane above the upper compression paddle. The DgN is calculated as described below.
DgN calculation
Entrance surface air kerma was calculated for each energy according to the following equation.
where K_E_ is entrance surface air kerma, E is energy in keV, is the mass-energy absorption coefficient for dry air air at energy E, and N is the number of photons that pass through the 3 cm × 3 cm scoring plane. The air kerma for each energy was weighted by the beam weight, as was the dose for each energy. The DgN was then calculated by
where W_E_ is the beam weight for each energy and D_E_ is the dose for each energy. The sums were performed across all energy bins.
Reconstruction of feasible breast volumes
2.2
To estimate the minimum and maximum possible DgN values corresponding to a given mammography projection image, a Siddon ray-tracing algorithm [9,10] was used to back-project a ray from each detector pixel into the breast volume towards the source. Figure 4 provides a simplified, two-dimensional illustration of the reconstruction procedure. In Figure 4a the object is positioned between the X-ray source and the detector, and a projection image is generated (Figure 4b). A single detector pixel in the projection image is selected as the pixel of interest, and the corresponding ray is back-projected from the detector toward the source (Figure 4c).
All voxels intersected by this ray are identified and are subsequently assigned as adipose tissue, fibroglandular tissue, or skin, consistent with the projection as well as the glandular fraction image [8] as explained below.
To isolate the reconstruction code from possible errors in the glandular fraction estimation code [8], a “perfect” glandular fraction map was assumed, specifying the fraction of fibroglandular tissue along each ray. This map provides the total fibroglandular path length that must be satisfied for each ray, but does not specify how that fibroglandular tissue is distributed in depth. Using this information, voxels intersected by each ray were assigned as fibroglandular tissue or adipose tissue in a manner that either minimized or maximized dose, while preserving the projection image and GF map.
For each projection pixel, the ray-tracing algorithm identifies all voxels intersected by the corresponding ray. The total fibroglandular thickness associated with that ray is calculated as the product of the pixel’s GF value and the known compressed breast thickness. Initially, all intersected voxels are assigned as adipose tissue. Voxels are then iteratively assigned as fibroglandular tissue until the cumulative fibroglandular path length along the ray matches the glandular tissue thickness specified by the glandular-fraction map.
Appendix A shows an analytical proof of dose at the glandular tissue being maximized if the tissue is concentrated at the top (entrance) surface of the breast versus distributed along the depth. Minimization when the glandular tissue is at the bottom follows as a corollary.
To generate the maximum dose configuration, fibroglandular tissue is preferentially assigned to voxels closest to the X-ray source along each ray. Beginning at the entrance surface of the breast, voxels traversed by Siddon-ray-tracing are converted from adipose to fibroglandular tissue one at a time until the required glandular path length is achieved. The reconstruction is performed in MATLAB using 1 mm^3^ voxel size. Conversely, to generate the minimum dose configuration, fibroglandular tissue is assigned starting at the deepest voxels along the ray, farthest from the source, and proceeding toward the entrance surface until the same glandular path length constraint is satisfied. In both cases, this procedure assures the reconstructed volume reproduces the original projection image and GF map, while dose distributions are extremized. Similarly for the central configuration, adipose voxels were converted to fibroglandular starting from the central line and proceeding up and down until the glandular path length constraint is satisfied.
Once fibroglandular and adipose assignments are completed for all rays, a skin layer is added to the surface of the reconstructed breast volume. The skin is modeled as a uniform 1.45 mm thick layer across the entire surface. However, due to the 1 mm voxel resolution, the outermost voxel layer is assigned as skin, resulting in an effective skin thickness of 1 mm.
Cross sections of representative reconstructed breast volumes are shown in Figure 5. Figure 5a shows the projection image generated in TOPAS for a 12.29 × 4.29 cm breast with a nominal glandular fraction of 20%. Figures 5b and 5c show cross sections through the reconstructed volumes optimized to maximize and minimize dose, respectively. In both cases, the cross section corresponds to the x = 95 mm plane, which bisects the reconstructed object.
In both reconstructed volumes, the proximal (left) boundary of the reconstructed breast object is parallel to the z-axis, reflecting the chest wall. However, the distal (right) boundary is slanted, which is expected from the divergent ray-tracing geometry used in the back-projection. Since the source is located 35.46 cm above the top surface of the breast at the chest wall, rays connecting detector pixels to the source are angled relative to the z-axis, resulting in a sloped distal surface in the reconstructed cross sections.
RESULTS
Estimation of DgN
3.1
Figure 6 summarizes DgN values for breasts of varying thickness at 20% glandularity. For all fibroglandular distributions, the DgN decreases as the thickness of tissue increases due to increased attenuation and greater average depth of fibroglandular tissue. However, the ratio between maximum and minimum DgN increases with thickness, from approximately 1.8 for a 3.29 cm thick breast to nearly 3.0 for a 6 cm thick breast.
Figure 7 shows DgN values as a function of glandular fraction for a fixed 4.29 cm thick breast. While the DgN remains approximately constant despite increasing glandularity, for the case where the fibroglandular tissue is concentrated at the center of the breast, the range between minimum and maximum DgN narrows. This is expectedly a reduced sensitivity to fibroglandular depth distribution when glandular tissue occupies a larger fraction of total breast volume.
Reconstruction from Projection and GF map
3.2
After reconstructing the breast object using ray tracing to place the fibroglandular tissue in the top (maximize DgN), bottom (minimize DgN) and center (likely DgN), consistent with the glandular fraction map, the objects are simulated in TOPAS to ascertain the values of DgN after reconstruction and to compare with our original values. The TOPAS geometry is maintained the same as Fig. 2, with the breast object inserted as the voxelized reconstructed phantom (composed of thousands of 1 mm^3^ voxels, each assigned as adipose tissue, fibroglandular tissue, skin, or air, as determined by the ray-tracing algorithm).
The original simulated breast object DgN values are compared against reconstructed simulated breast object DgN values. The numerical DgN results are tabulated in Appendix A2 for 4 different sizes. The bolded results (where original and reconstruction are in the same configuration, that is either lower, central or upper) are shown in Fig. 8, for comparison. For all 18 baseline cases, the true DgN from the original breast configuration (centrally located) lay within the reconstructed bounds. The largest deviation between the expected DgN and the reconstructed DgN occurs for the 13 cm × 5 cm case when the fibroglandular tissue is concentrated at the top of the breast near the source; in this instance, the discrepancy is about 8%.
DISCUSSION
This work demonstrates that substantial uncertainty (even as much as three times variation) in normalized glandular dose can arise solely from unknown depth-wise distribution of fibroglandular tissue, even when the breast thickness, glandularity, and projection appearance remain fixed. The observed variation in DgN, particularly for thicker breasts, highlights the limitations of conventional homogeneous-50/50-breast dose models and emphasizes the importance of patient-specific dose characterization.
The proposed reconstruction-based framework was verified to provide accurate DgN values (maximum deviation 8%) and provides a practical method for estimating realistic bounds on DgN from a single mammographic projection image. Rather than attempting to assume a three-dimensional geometry, the method acknowledges inherent uncertainty in mammography and quantifies its dosimetry implications. This range-based approach is particularly relevant for thicker and less glandular breasts, where dose variability is greatest.
A few limitations should be noted. First, idealized glandular fraction maps were used to decouple reconstruction performance from glandular fraction estimation error. In clinical practice, uncertainties in GF estimation will widen dose bounds. Second, voxelization and simplified skin modeling introduce small discrepancies between reconstructed and reference projections. Future work will focus on extending the framework to multi-dimensional acquisitions.
CONCLUSION
We have presented a patient-specific method for estimating feasible ranges of normalized glandular dose in mammography using a single projection image and its associated glandular fraction map. Monte Carlo simulations demonstrate that DgN may have high variation due solely to fibroglandular tissue depth distribution. The proposed reconstruction-based approach provides a practical framework for estimating anatomically-informed bounds on DgN from a single mammographic projection and represents a step toward more personalized and accurate dosimetry in breast cancer screening.
Supplementary Material
This is a list of supplementary files associated with this preprint. Click to download.
The reference list from the paper itself. Each links out to its DOI / PubMed record.
- 1Sun Y. S., Zhao Z., Yang Z. N., Xu F., Lu H. J., Zhu Z. Y., … & Zhu H. P. (2017). Risk factors and preventions of breast cancer. International journal of biological sciences, 13(11), 1387. 10.7150/ijbs.21635.29209143 PMC 5715522 · doi ↗ · pubmed ↗
- 2What Is Breast Cancer Screening? (2022, November 17). Centers for Disease Control and Prevention. https://www.cdc.gov/cancer/breast/basic_info/screening.htm
- 3Center for Devices and Radiological Health. (2023). MQSA National Statistics. U.S. Food And Drug Administration. https://www.fda.gov/radiation-emitting-products/mqsa-insights/mqsa-national-statistics.
- 4Bushberg J. T., & Boone J. M. (2011). The essential physics of medical imaging. Lippincott Williams & Wilkins.
- 5Miglioretti D. L., Lange J., Van Den Broek J. J., Lee C. I., Van Ravesteyn N. T., Ritley D., ... & Hubbard R. A. (2016). Radiation-induced breast cancer incidence and mortality from digital mammography screening: a modeling study. Annals of internal medicine, 164(4), 205–214. 10.7326/M 15-1241.26756460 PMC 4878445 · doi ↗ · pubmed ↗
- 6Suleiman M. E., Brennan P. C., & Mc Entee M. F. (2017). Mean glandular dose in digital mammography: a dose calculation method comparison. Journal of Medical Imaging, 4(1), 013502–013502. 10.1117/1.JMI.4.1.013502.28149921 PMC 5260632 · doi ↗ · pubmed ↗
- 7Santos J. C., Tomal A., de Barros N., & Costa P. R. (2019). Normalized glandular dose (Dg N) coefficients from experimental mammographic x-ray spectra. Physics in Medicine & Biology, 64(10), 105010. 10.1088/1361-6560/ab 171a.30959490 · doi ↗ · pubmed ↗
- 8Smith B.J, Dey J., Medlock L., Solis D., Kirby K., “Maximum-likelihood estimation of glandular fraction for mammography and its effect on microcalcification detection”, Phys Eng Sci Med, May 2025, 10.1007/s 13246-025-01540-2 · doi ↗