Development and Validation of the PASS Score: A Simplified Tool to Diagnose Acquired Aplastic Anemia in Adults
Gabriel Aleixo, HeeJin Cheon, Jiayin Zheng, Stephanie Soewito, Jimmy Lee, Eléonore Kaphan, Neha Kalakuntla, Wei-Ying Jen, Sumasri Kotha, Alex Rupsee, Mia Djulbegovic, Jairo A Matthews, Tapan M. Kadia, Timothy S. Olson, Régis Peffault de Latour, Flore Sicre De Fontbrune, Taha Bat

TL;DR
Researchers developed a new clinical tool called PASS to quickly and accurately diagnose acquired aplastic anemia in adults, reducing the need for genetic testing.
Contribution
The PASS score is a novel, validated clinical tool that distinguishes acquired aplastic anemia from inherited bone marrow failure syndromes using common clinical data.
Findings
The PASS model achieved an AUC of 0.990 in the training cohort and 0.977 in external validation.
A score ≥30 had 100% positive predictive value for diagnosing acquired aplastic anemia.
The tool rapidly diagnosed 80% of AA cases and is available as an open-access web calculator.
Abstract
Acquired aplastic anemia (AA) can present similarly to inherited bone marrow failure syndromes (IBMFS) but treatment differs. AA diagnosis relies on excluding IBMFS; however, genetic testing is not always available, may delay care or be inconclusive. We developed the Predictive Aplastic Score System (PASS), a clinical tool using readily available data to distinguish AA from IBMFS in adults. The training cohort included 212 adults (162 AA, 50 IBMFS). Compared to IBMFS, AA patients were older and more likely to have acute-onset, severe cytopenias. Using logistic regression with LASSO, we selected seven clinical variables for model inclusion: severity, acuity, age, IBMFS red flags, AA-associated conditions, AA-associated somatic changes, and telomere lengths. The model achieved AUC of 0.990 (95% CI: 0.982–0.999), with 100% positive predictive value (PPV) for AA for scores ≥30. 86.8% of…
Genes, proteins, chemicals, diseases, species, mutations and cell lines named across the full text — each resolved to its canonical identifier and authoritative record.
Click any figure to enlarge with its caption.
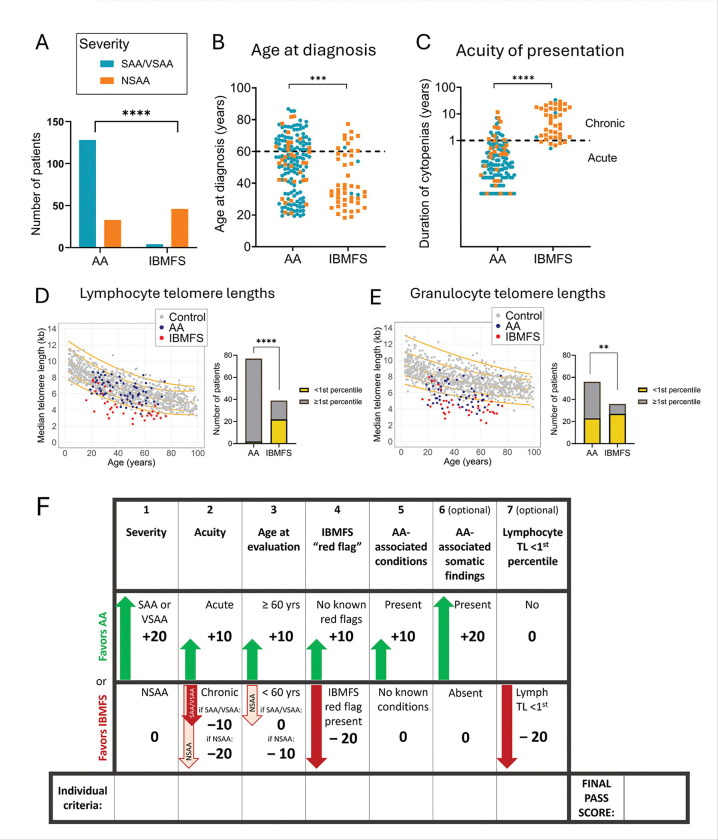 Figure 1
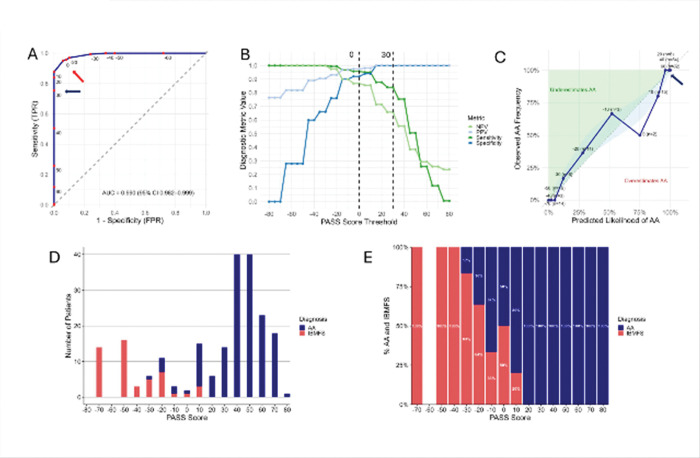 Figure 2
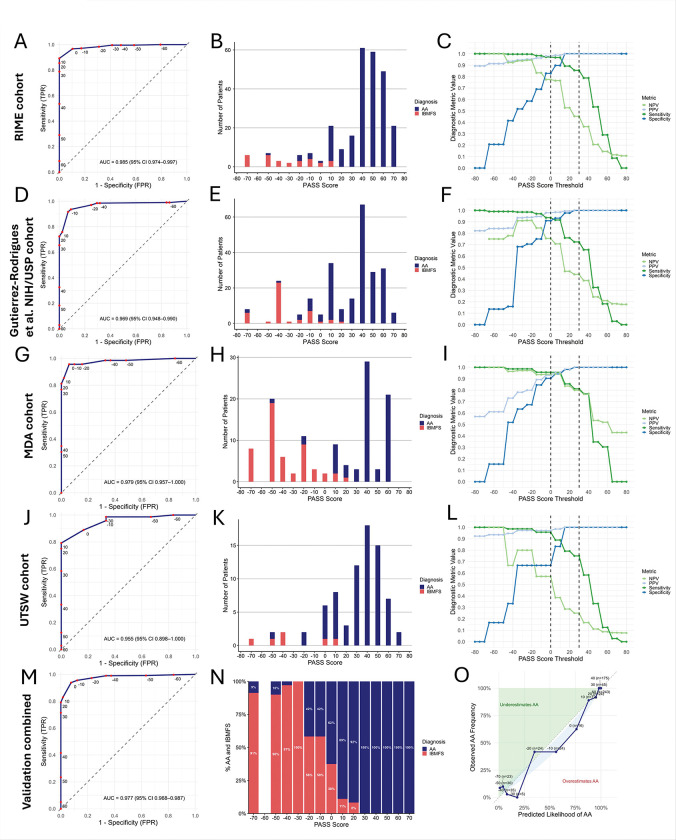 Figure 3
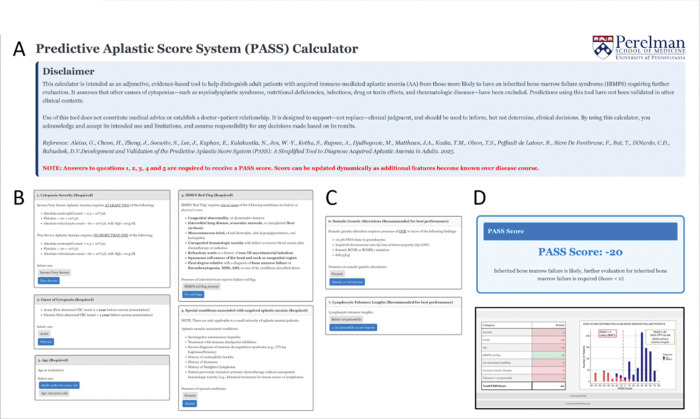 Figure 4
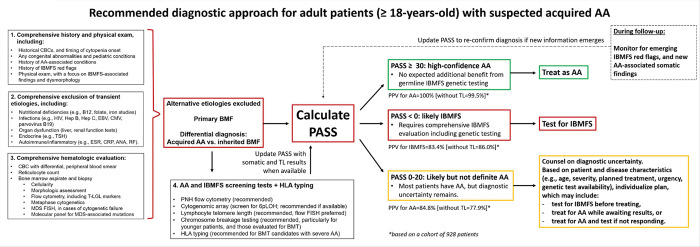 Figure 5
Peer Reviews
No public reviews on file for this paper yet. If you reviewed it on a platform where reviews are public (OpenReview, ICLR, NeurIPS, ICML), you can paste yours below so the community can read it here.
Videos
No videos yet. Explain this paper in a talk, walkthrough, or lecture? Add one.
Taxonomy
TopicsHematopoietic Stem Cell Transplantation · Acute Myeloid Leukemia Research · Erythropoietin and Anemia Treatment
Introduction
Acquired aplastic anemia (AA) is an immune-mediated bone marrow failure (BMF) disorder caused by an autoreactive T-cell attack on hematopoietic stem and progenitor cells^1^. Most AA patients are previously healthy individuals who present with acute and severe pancytopenia, requiring high-intensity supportive care and urgent bone marrow transplantation (BMT) or immunosuppressive therapy (IST) to restore hematopoiesis^1–4^. Because AA is a diagnosis of exclusion without a definitive test, clinicians must rule out mimicking conditions, including inherited bone marrow failure syndromes (IBMFS), to establish the diagnosis^4–7^.
IBMFS are a heterogeneous group of rare genetic diseases that resemble AA but require different treatment. Unlike AA, IBMFS patients do not respond well to standard IST, can have extrahematopoietic manifestations, and can experience severe toxicity with standard BMT conditioning regimens^8, 9^. Due to clinical overlap, limited familiarity, and medicolegal concerns, clinicians increasingly rely on genetic testing “to confirm AA diagnosis” before initiating therapy. However, genetic testing is not always readily available and may be inconclusive^10, 11^. In AA, treatment delays while awaiting testing may worsen cytopenias, increase infection and alloimmunization risk, and reduce IST responsiveness and transplant outcomes^12–17^. Conversely, misdiagnosing IBMFS as AA can lead to inappropriate therapy, increased transplant toxicity, or inadvertent selection of an affected family member as a donor^18–25^.
Previous efforts to improve diagnostic precision using machine learning required manual entry of numerous variables, limiting their clinical utility^10^. Universal genetic testing has been proposed^25^, and recommendations have been incorporated into guidelines from the NCCN^26^, EMBT^27^, and the British Society of Haematology^4^. Yet, while increasingly available, genetic testing may be unnecessary for many patients, may leave lingering uncertainties, and may require specialized facilities and long turnaround times for germline tissue analysis. IBMFS genetic testing remains inaccessible in many non-tertiary care and resource-limited settings, contributing to cost and patient anxiety. Extended workups frequently delay definitive therapy while most adult AA patients have no identifiable IBMFS variants. As gene panels expand, rare variants of uncertain significance increase, requiring careful interpretation and counseling^11^.
We and others showed that paroxysmal nocturnal hemoglobinuria (PNH) clones and acquired 6p loss of heterozygosity (6pLOH) are strong predictors of AA that effectively discriminate AA from IBMFS^28–32^. However, these are present in only 40–50% of AA patients. Additionally, very small PNH clones can occur in healthy individuals^33–35^ and can be difficult to interpret without validated cutoffs^36^. While 6pLOH is highly specific for AA, abnormalities of chromosome arm 6p (including 6pLOH) have been reported in congenital conditions, highlighting the limitations of relying solely on these markers^37^.
Building on our prior work, we developed the Predictive Aplastic Score System (PASS), a simplified scoring system incorporating readily available clinical and molecular features with high predictive value for distinguishing AA from IBMFS in adults. We validated PASS retrospectively using four independent external datasets and here we report its diagnostic performance in a total of 928 BMF patients (747 AA and 181 IBMFS). PASS offers a practical tool for rapid, accurate diagnosis, minimizing treatment delays and identifying patients most likely to benefit from extended IBMFS testing. Ultimately, PASS aims to reduce diagnostic errors and improve outcomes for patients with AA and IBMFS.
Materials/Subjects and Methods
See Supplemental Appendix for detailed description of the methods.
Patients and cohorts
The study was approved by the Institutional Review Boards (IRBs) of the participating institutions. Adults (≥18 years) evaluated for BMF—defined as cytopenias with a hypocellular marrow after exclusion of secondary causes—were eligible. Only patients diagnosed with AA or IBMFS were included.
The training cohort comprised consecutive adult patients evaluated at the University of Pennsylvania (Penn) between 2010 and 2025, identified through IRB-approved retrospective electronic medical record review and the Penn/CHOP BMF Registry. External validation was performed in four independent adult cohorts: the published NIH/University of São Paulo (NIH/USP) cohort, the French national reference center observatory (RIME), and retrospective cohorts from MD Anderson (MDA) and University of Texas Southwestern (UTSW).
Diagnostic group assignment
Diagnostic classification followed standardized criteria across cohorts. IBMFS diagnoses were based on genetic testing and syndrome-specific assessments^38, 39^, following marrow evaluation and systematic exclusion of alternative etiologies^4, 5, 11, 40^. AA was confirmed by either exclusion of IBMFS on genetic testing and/or sustained response to IST per NIH criteria^41^. Patients lacking confirmatory testing or evaluable IST response were classified as presumed AA in accordance with standard clinical practice^4, 5, 11, 40^. All patients in the NIH/USP cohort had complete IBMFS genetic testing and telomere length (TL) measurements, and all AA patients in the RIME cohort had confirmed AA based on IBMFS genetic testing or evidence of IST.
Clinical data collection
Clinical, laboratory, and genetic data in the training cohort were obtained by independent manual chart review by two investigators. Collected variables included demographics, cytopenia severity, somatic and cytogenetic findings, presence and size of PNH clones, IBMFS-associated features (IBMFS “red flags”, Supplemental Table S1), AA-associated clinical conditions^42–48^ (Supplemental Table S2).Cytopenia severity was classified using the modified Camitta criteria^49, 50^.
PASS score development and validation
PASS was developed in the training cohort using logistic regression with variable selection by least absolute shrinkage and selection operator (LASSO)^51^ and 10-fold cross-validation to select the optimal penalization parameter λ that minimized the mean cross-validated binomial deviance (the minimum-deviance criterion). Model coefficients were translated into a simplified integer-based scoring system designed for bedside clinical use. Validation was performed using patient-level data from all cohorts, with missing values scored as absence of abnormal findings.
Statistical analysis
Discrimination was assessed using ROC AUC, and calibration using calibration plots, Brier scores, and the Hosmer–Lemeshow (HL) test. Predictive values were calculated at pre-specified score thresholds. PASS performance was compared with published diagnostic models (the Gutierrez-Rodrigues et al. machine-learning (“NIH-ML”) model^10^ and the Kaphan et al. recursive partitioning (RIME) model^52^, using ROC AUC, Brier scores, and DeLong’s χ^2^ test for pairwise comparisons. Inter-rater reliability was assessed using Fleiss’ kappa. Analyses were performed using Stata v18.0, and Graphad Prism, with two-sided p<0.05 considered significant.
Results
Clinical presentation of AA and IBMFS in adults
The training cohort included 212 patients (median age 51.8 years; range 18.2–86.7). 162 patients (76.4%) had AA, while 50 (23.6%) had IBMFS (Table 1). 51.9% of patients (110 of 212) had no historical normal complete blood count documented prior to presentation. TL testing by flow FISH was available for 116 patients (54.7%), chromosome breakage testing for 90 (42.5%) patients, and genetic testing for IBMFS-associated genes for 65 (30.7%) patients (Supplemental Table S3). 151 AA patients (93.2%) were treated with IST, and 85.7% (120 of 140 evaluable patients) achieved a partial or complete hematologic response at 6 months. Based on our diagnostic adjudication criteria for this study, 80.2% of AA patients (130 of 162) were further classified as having confirmed diagnosis of AA by virtue of hematologic response to IST or negative IBMFS genetic testing, while 32 were categorized as having a presumed diagnosis of AA based on expert evaluation and exclusion of other conditions (Supplemental Table S4).
Of the IBMFS cases, 48 of 50 (96.0%) had a confirmed diagnosis (25 (50.0%) had telomere biology disorders (TBD), 8 (16.0%) had Fanconi anemia (FA), 5 (10.0%) had Diamond-Blackfan anemia (DBA), 3 (6.0%) had GATA2 deficiency, and 7 (14%) had other defined congenital syndromes), while 2 (4.0%) carried a clinical diagnosis of IBMFS without a genetic cause identified (Supplemental Tables S5). Of the IBMFS patients, 39 (78.0%) presented with hematologic manifestations, while 11 (22.0%) were diagnosed during evaluation or treatment of extrahematopoietic features (e.g., pulmonary fibrosis in TBD, failure to recover blood counts after chemotherapy for solid tumor in FA). Three patients with IBMFS initially received IST for treatment of presumed AA without hematologic response before an eventual diagnosis of IBMFS—one based on a newly reported TUBB variant identified on re-analysis of prior whole-exome sequencing^37^, one due to new clinical manifestations of TBD in the absence of an identified germline mutation, and the third was found to have genetically-confirmed GATA2 deficiency after GATA2 deficiency syndrome was described in the literature.
Clinical and laboratory features diverged sharply between AA and IBMFS groups (Tables 1–2, Figure 1). The most striking differences between groups were in the acuity and severity of cytopenias (Figures 1A–C): 118/162 (72.8%) of AA patients had acute-onset (<1 year) severe or very severe AA (SAA/VSAA), compared to only 1/50 (2.0%) IBMFS cases (p<0.001). Conversely, chronic (>1 year) non-severe cytopenias (NSAA) predominated in IBMFS (39/50 [78.0%]) compared to AA (8/162 [4.9%]; p<0.001).
AA patients were older at presentation (median 54.7 years; range 19.3–86.7) compared to IBMFS patients (median 37.4 years; range 18.8–72.4; p=0.001) (Figure 1B). Both groups had patients presenting at age ≥60 years, but presentation in the older age range was more common for AA (AA: 63/162 [38.9%] vs. IBMFS: 11/50 [22.0%]; p=0.031).
Clinical stigmata or family history suggestive of IBMFS were present in 45 of 50 IBMFS patients (90.0%) versus 6 of 162 (3.2%) AA patients (p<0.001, Table 2). A subset of AA patients (10 of 162, 6.2%) had conditions associated with AA (e.g., checkpoint inhibitor use, seronegative hepatitis)^42, 44, 45, 48, 53^; these were absent in IBMFS patients.
Clonal hematopoiesis was identified by clinical testing in 142 patients (67.0% of the cohort). Somatic changes characteristic of AA were present in 52.5% of AA patients (85/162) (Tables 1–2) and included granulocyte PNH clones ≥0.5% in 43.0% (65/151) of evaluable patients, acquired 6pLOH in 13.7% (10/73) of evaluable patients, somatic mutations in BCOR or BCORL1 in 17.1% (18/105), and del(13)(q) as an isolated abnormality in 5.8% (9/154). These AA-associated somatic findings were rare in IBMFS (1 of 50 [2.0%]; p < 0.001).
Among patients with TL measurements, fewer AA patients had lymphocyte TLs <1st percentile for age (2/77 [2.6%]) compared to IBMFS (22/39 [56.4%], p<0.001), of whom 17 had TBD and 5 had other IBMFS (Fig 1D, Table 2). The two AA patients with TLs <1st percentile lacked TBD-associated germline variants or clinical features beyond BMF; one responded to IST, while the other had refractory AA and underwent BMT. Lymphocyte TLs above 10^th^ percentile were found in 71.4% (55/77) of AA vs 17.9% of IBMFS patients (p<0.001); of the 7 IBMFS patients with lymphocyte TLs>10^th^ percentile, 2 had FA, 1—DBA, 1—GATA2 deficiency and 3 had various other IBMFS. Granulocyte TLs were less discriminatory between AA and IBMFS, with 41.1% of evaluable AA patients (23 of 56) having granulocyte TLs <1^st^ percentile compared to 75.0% (27 of 36) for IBMFS (p=0.002) (Fig 1E). Only 32.1% (18 of 56) AA patients had granulocyte TLs over 10^th^ percentile.
Development and performance of the PASS model in the training cohort
We next performed the LASSO logistic regression on the seven candidate variables identified in our univariate analysis (Table 2). LASSO is a logistic regression technique that optimizes variable selection by adding a penalty for inclusion of too many variables that could lead to overfitting. LASSO retained all seven variables with the optimal penalty (λ 0.007). We assigned points (±10 or ±20) based on LASSO coefficient direction, with positive values for factors associated with AA and negative values for those linked to IBMFS (Fig 1F).
To evaluate model performance, we next applied the PASS score to our training cohort of 212 patients (Figure 2A–E, Table 2). The score demonstrated excellent diagnostic discrimination, with an area under the ROC curve AUC of 0.990 (95% confidence interval [CI]: 0.982–0.999) (Figure 2A). Calibration analysis showed strong agreement between predicted and observed probabilities (Figure 2C) and the Brier score showed good calibration and high predictive performance at 0.035.
The positive predictive value (PPV) and specificity for AA increased with higher PASS scores (Figure 2B). In the training cohort, scores ≥30 were associated with a 100% PPV for AA and predicted response to IST, with 88.0% (103 of 117) of evaluable patients responding at 6 months, compared to 65.3% (17 of 26) for scores <30 (p = 0.004). PPV for IBMFS increased with lower scores (Figures 2 B, D-E), with 86.8% of patients (46 of 53) with scores <0 having IBMFS. Among patients with intermediate scores (0 to 20), the majority (82.6%, 19 of 23) had AA; of those treated with IST, 72.2% (13 of 18) responded at 6 months.
Incorporating the most sensitive threshold for PNH clone detection including clones <0.5% and recalculating the score as new laboratory findings (e.g., AA-associated somatic changes) emerged later in the disease course resulted in an AUC 0.992 (95% CI 0.985–0.999), slightly improving sensitivity from 0.840 to 0.877 while retaining 100% PPV for AA for scores ≥ 30 (Supplemental Figure S2). Because this improvement was small, we retained the more conservative PNH clone threshold of ≥0.5% to maximize diagnostic specificity, given prior reports of very small PNH clones in rare IBMFS patients^36^.
PASS Score validation in external BMF cohorts
We next assessed the performance of the PASS score in four independent external validation cohorts of adult BMF patients: (1) 270 patients from the French national reference database (RIME)^52^, (2) 247 patients from a published dataset from the NIH/USP^10^, (3) 121 patients from MDA, and (4) 78 patients from UTSW. The four cohorts had different prevalences of IBMFS patients, reflecting variations in referral practices and patient recruitment: IBMFS comprised 10.7% (29 of 270) in the RIME cohort, 17.8% (44 of 247) in the NIH/USP cohort, 7.7% (6 of 78) in the UTSW cohort, and 42.9% (52 of 121) in the MDA cohort. Similar to the training dataset, the most common IBMFS across all validation cohorts were TBDs, comprising a median of 65.5% (range 50–100%) of IBMFS diagnoses (Supplemental Table S6A-D), reflecting TBDs being the most common IBMFS in adults.
Across these cohorts, clinical presentations of AA and IBMFS were consistent with the training dataset (Supplemental Tables S7-S10). Most IBMFS patients presented with NSAA: 69.0% in RIME, 90.9% in NIH/USP, 83.3% in UTSW, and 94.2% in MDA. The majority of AA patients presented with acute-onset cytopenias—97.9% in RIME, 98.0% in NIH/USP, 88.9% in UTSW, and 91.3% in MDA. Most AA patients had severe or very severe cytopenias (SAA/VSAA), observed in 84.2% in RIME, 69.5% of NIH/USP, 61.1% of UTSW, and 84.1% of MDA patients. In contrast, IBMFS patients were more likely to have lymphocyte TL <1st percentile, and few or no IBMFS patients exhibited AA-associated somatic alterations. IBMFS “red flags” were present in 82.8% in RIME, 52.3% of NIH/USP, 83.3% of UTSW, and 80.8% of MDA patients with IBMFS.
Application of the PASS score to the four datasets demonstrated excellent discriminatory performance (Figure 3 A–L, Table 2), with ROC AUCs of 0.977 (95% CI: 0.968–0.987) in all combined cohorts (Figure 3M), and ROC AUC of 0.985 (95% CI: 0.974–0.997 RIME), ROC AUC of 0.969 (95% CI: 0.948–0.990 NIH/USP), ROC AUC of 0.979 (95% CI: 0.957–1.0 MDA), and 0.955 (95% CI: 0.898–1.0 UTSW) in the cohorts analyzed separately (Figure 3 A, D, G, J). The combined calibration plot showed strong agreement between predicted and observed probabilities (Figure 3O) and Brier scores showed strong predictive performance at 0.044.
Threshold-based analysis revealed that scores ≥30 had a positive predictive value (PPV) of 100% for AA across all validation cohorts (Figure 3 C,F,I,L). In contrast, scores below 0 were predominantly associated with IBMFS patients, yielding a PPV of 81.6% for IBMFs across all datasets. Analyzed separately, PPVs for IBMFS with PASS <0 were 77.4% in RIME, 75.5% in NIH/USP, 94.0% in MDA, and 57.1% in UTSW, delineating a subset of individuals warranting further evaluation for IBMFS. Most, but not all, patients with intermediate scores (0–20) had AA: 85.7% across all cohorts, and individually—84.8% in RIME, 91.5% in NIH/USP, 66.7% in MDA, and 88.2% in UTSW (Figure 3 B, E, H, K, N). These findings may help identify patients who could benefit from IBMFS evaluation or re-evaluation, particularly in patients going to BMT and in cases of IST-refractory disease.
The effect of TL and somatic alteration components on PASS performance
Because TL measurement by flow-FISH and somatic genetic testing results may be delayed or unavailable in some settings, we examined the effect of availability of these score components on PASS performance.
Among 928 patients, 457 (49.2%) had available telomere length (TL) measurements (Supplemental Table S11). In PASS, TL <1st percentile lowers the score, whereas TL ≥1st percentile or unavailable testing has no effect. Comparing within the subset of patients with available telomere length (TL) data, omission of TL shifted scores upward in patients with very short TL, increasing sensitivity for AA at PASS ≥30 but reducing sensitivity for IBMFS at PASS <0 (Supplemental Figure S3). Despite this shift, discrimination remained strong without TL (ROC AUC 0.955) compared with PASS including TL (ROC AUC 0.974), with preserved calibration. PPV for AA at PASS ≥30 remained high without TL (98.8% vs. 100% with TL), while PPV for IBMFS at PASS <0 was modestly increased (88.2% vs 83.8% with TL). In the full 928-patient cohort, PASS omitting TL had ROC AUC 0.9703, with 99.5% PPV for AA at PASS ≥30.
When TL was excluded, three of 181 IBMFS patients (1.7%) (all with TBD) had PASS ≥30 and were classified as AA (MDA074, NIH316, and USP022) (Supplemental Table S12). Detailed review demonstrated that in one patient NIH316, a notation of “abnormal cutaneous findings” was not included as IBMFS red flag due to insufficient descriptive detail in the published NIH/USP dataset. Prospective classification of this feature would have revised the no-TL PASS to the intermediate range (PASS=20). Another patient (USP022) likely had concurrent AA in the setting of a germline TERT variant of uncertain significance. This patient presented with acute-onset NSAA, a 6% PNH clone, absence of IBMFS red flags, TL <1st percentile, and a TERT c.2154C>A (p.Asp718Glu) variant of uncertain significance. The no-TL PASS was 30, whereas incorporation of TL appropriately reclassified the patient into intermediate category (PASS=10), reflecting diagnostic uncertainty.
Somatic testing was available in 90.6% of patients (841/928) (Supplemental Table S13). Inclusion of the somatic component increased sensitivity for AA at PASS ≥30, while discrimination remained excellent whether the somatic component was included or omitted (ROC AUC 0.981 vs. 0.977, respectively)(Supplemental Figure S4). Omission of the somatic component led to modest redistribution of AA patients into lower and intermediate score ranges. PPV for AA at PASS ≥30 remained 100% regardless of somatic inclusion, whereas PPV for IBMFS at PASS <0 was modestly reduced when somatic data were omitted.
A total of 419 patients (45.1% of 928) had evaluable TL and somatic data (Supplemental Table S14). Omission of both components resulted in a greater decline in discrimination than omission of either alone (ROC AUC 0.943 vs. 0.973 when both were included), though calibration remained good. Importantly, PASS retained high PPV for AA at PASS ≥30 (99.1%) even when both components were unavailable (Supplemental Figure S5).
Together, these results demonstrate that TL and somatic components improve PASS precision and help resolve diagnostically ambiguous phenotypes, while PASS maintains robust discriminatory performance and excellent predictive value for AA when these data are unavailable.
Comparison of PASS to prior diagnostic models
We next compared the diagnostic performance of PASS to NIH-ML^10^ and RIME recursive partitioning models^52^ (Table 3). We limited this analysis to patients with available PNH flow cytometry to ensure that patients could be analyzed using the RIME model. The NIH-ML model could be compared only for the NIH/USP cohort using published predictions from the NIH-ML manuscript^10^, because the NIH-ML algorithm is not publicly available.
Comparing the three models in the NIH/USP cohort, both PASS and NIH-ML showed similarly excellent discriminatory performance (PASS 0.970 [95% CI 0.948–0.992], NIH-ML ROC of 0.941 [95% CI 0.889 – 0.992]. However, PASS had stronger PPV for AA: PASS PPV for AA was 100% (147/147) for PASS ≥30, whereas the NIH-HL model failed to issue a prediction for 4 IBMFS patients (9.1% of 44), and misclassified another 4 (9.1%) of IBMFS patients as AA (Supplemental Table S15).
PASS outperformed the RIME model in all except the RIME derivation cohort, where performance was comparable (Table 3). In all five cohorts combined (N = 865), PASS demonstrated ROC 0.980 (95% CI 0.972–0.988), PPV for AA ≥30 = 100% 598/598), and Brier 0.037, compared with ROC AUC 0.865 (0.830 – 0.899), PPV for AA 96.8% (667/689), and Brier 0.075. 22 of 127 (17.3%) of IBMFS patients were misclassified as AA by the RIME model (Supplemental Table S16), compared to 0 for patients with PASS ≥30.
Inter-operator reproducibility and the development of the clinical calculator tool
To assess inter-operator reproducibility, three hematology-oncology clinicians independently applied the PASS to 20 randomly selected patients from the training cohort. Inter-observer agreement, measured using Fleiss’ κ (a statistic accounting for agreement expected by chance), was 0.875, indicating near-perfect agreement and good reproducibility across independent raters. Minor variability was observed in exact point totals, reflecting inherent limitations of retrospective clinical data abstraction; however, agreement on categorical diagnostic classification remained uniformly high, demonstrating the real-world robustness and flexibility of PASS scoring, with consistent assignment to AA, IBMFS, or intermediate categories across raters.
To support clinical implementation, we developed an open-access PASS clinical calculator (Figure 4, available at https://pennmedicine.shinyapps.io/passcalc/). This tool allows users to input clinical variables and returns the calculated score along with its interpretation for three patient subgroups based on score thresholds (≥30, 0–20, and <0). The score can be recalculated as additional variables emerge during the disease course. To assist with interpretation, the tool also displays the corresponding score distributions for AA and IBMFS patients in both the training and validation cohorts.
Discussion
In this study, we employed a structured statistical approach in a training cohort of 212 and a validation cohort of 716 adult BMF patients to develop a clinical score that accurately identifies patients with classical features of AA and those at increased risk of harboring IBMFS. Although genetic testing has become more accessible and is increasingly incorporated into AA diagnostic workflows, evidence supporting the benefits of universal genetic testing in all adult BMF patients is lacking. Our results identify clinical factors that can distinguish AA and IBMFS in adults. We present a systematic framework that can be applied reliably to enable rapid diagnosis of 80% of AA patients with classical AA presentation and identification of individuals most likely to benefit from IBMFS testing. Validated across four independent cohorts, the PASS is a robust model that is accessible, efficient, and high yield, and particularly beneficial in settings without readily available genetic testing. To facilitate clinical implementation, we translated our PASS model into an open-access, web-based calculator.
Various features favoring the diagnosis of AA or IBMFS have been previously described^3–9, 11, 32, 54–57^, but when considered in isolation they have only moderate discriminative value. Our findings confirm that IBMFS can present even in adults ≥60 years old, and that AA can sometimes follow a chronic or indolent course. Among patients with chronic non-severe cytopenias, 17% had AA, rising to 64% in the absence of IBMFS “red flags”. Conversely, IBMFS-associated features lacked sensitivity for IBMFS: 34% of IBMFS patients had normal TL, and 10% had no IBMFS “red flags”. Across cohorts, IBMFS accounted for up to ~20% of adult BMF cases, approximately two-thirds of which were telomere biology disorders (TBDs). These findings underscore the need for a validated diagnostic framework that can be readily applied in routine hematology practice.
PASS outperformed two previously published diagnostic models, the machine-learning (“NIH-ML”) model^10^ and the Kaphan et al. recursive partitioning (RIME) model^52^, in specificity for diagnosing AA (Table 3). A key distinction is that prior models were trained in mixed pediatric and adult cohorts, with IBMFS cases predominantly drawn from pediatric populations, where patients have a different spectrum of IBMFS. Conversely, PASS was developed specifically for adult BMF, a population that often lack overt dysmorphology and may instead present with adult-onset manifestations such as pulmonary fibrosis in TBDs. NIH-ML^10^ model demonstrated strong performance but misclassified or failed to generate predictions for 18.2% of adult IBMFS patients in the NIH/USP cohort. In addition, NIH-ML algorithm is not publicly available and its performance outside of NIH/USP cohort is not known. The model requires entry of >25 variables—including detailed dysmorphology assessments that are difficult to perform reliably outside pediatric subspecialty settings—and relies on TL for performance. The RIME model has a key strength in its simplicity and applicability to the real-world setting, requiring only three clinical variables for scoring. However, performance depends on correct implementation of four recursive decision-tree rules, without a validated bedside tool and showed reduced specificity outside its derivation cohort. When applied to our adult cohorts, it misclassified 17.3% of IBMFS patients as AA, particularly those with acute presentations lacking dysmorphology. PASS advances beyond prior models by combining superior discriminatory performance in adult cohorts with a transparent, bedside-applicable scoring algorithm that does not require TL testing and achieves near-perfect (100%) PPV for AA.
We envision PASS as an adjunct to standard diagnostic evaluation for suspected AA (Figure 5). Following exclusion of secondary causes and marrow assessment, patients can be rapidly stratified into three categories: high-confidence AA (PASS ≥30), likely IBMFS (PASS <0), and an intermediate group (PASS 0–20). Patients with PASS ≥30 can proceed with AA-directed therapy without delay, whereas those with PASS <0 should undergo comprehensive IBMFS evaluation, including genetic testing. Patients with intermediate scores have greater diagnostic uncertainty, and management should be individualized; further IBMFS testing is appropriate—particularly when transplantation is planned—but AA-directed therapy may be initiated in selected cases based on disease severity, treatment urgency, and access to genetic testing, with appropriate patient counseling and reassessment if response is not observed. Thus, PASS is intended to provide a systematic diagnostic framework for evaluation of adult AA patients; it is not intended to supplant clinical decision-making, as we recognize the nuances of clinical practice and the importance of clinical judgment.
This study has limitations. As a retrospective analysis, documentation of subtle IBMFS physical findings or family history may have been incomplete. However, independent manual chart review by two investigators and consistent performance across four external validation cohorts totaling 716 patients support real-world generalizability. The score’s reliance on multiple complementary features confers robustness to missing data, as demonstrated in sensitivity analyses excluding telomere and somatic components. Inter-rater agreement was high despite minor variability in component-level scoring. Our analysis focused on adults with BMF; telomere measurements were done by flow-FISH; future studies are needed to validate PASS with other telomere assays, in pediatric populations, and in prospective and community-based settings.
In conclusion, PASS is a practical and accurate clinical tool for distinguishing AA from IBMFS in adults, validated in 928 adult BMF patients across five independent international cohorts. By integrating routinely available clinical and laboratory data, PASS provides early diagnostic clarity, helps prioritize genetic testing, and offers a systematic framework to guide initial clinical management.
Supplementary Material
Supplementary Files
This is a list of supplementary files associated with this preprint. Click to download.
The reference list from the paper itself. Each links out to its DOI / PubMed record.
- 1Young NS. Aplastic Anemia. N Engl J Med 2018 Oct 25; 379(17): 1643–1656.30354958 10.1056/NEJ Mra 1413485 PMC 6467577 · doi ↗ · pubmed ↗
- 2Bacigalupo A, Passweg J. Diagnosis and Treatment of Acquired Aplastic Anemia. Hematol Oncol Clin N 2009 Apr; 23(2): 159-+.
- 3Babushok DV, De Zern AE, de Castro CM, Rogers ZR, Beenhouwer D, Broder MS, Modified Delphi panel consensus recommendations for management of severe aplastic anemia. Blood Adv 2024 Aug 13; 8(15): 3946–3960.38669341 10.1182/bloodadvances.2023011642 PMC 11331724 · doi ↗ · pubmed ↗
- 4Kulasekararaj A, Cavenagh J, Dokal I, Foukaneli T, Gandhi S, Garg M, Guidelines for the diagnosis and management of adult aplastic anaemia: A British Society for Haematology Guideline. Br J Haematol 2024 Mar; 204(3): 784–804.38247114 10.1111/bjh.19236 · doi ↗ · pubmed ↗
- 5De Zern AE, Churpek JE. Approach to the diagnosis of aplastic anemia. Blood Adv 2021 Jun 22; 5(12): 2660–2671.34156438 10.1182/bloodadvances.2021004345 PMC 8270669 · doi ↗ · pubmed ↗
- 6Keel S, Geddis A. The clinical and laboratory evaluation of patients with suspected hypocellular marrow failure. Hematology Am Soc Hematol Educ Program 2021 Dec 10; 2021(1): 134–142.34889426 10.1182/hematology.2021000244 PMC 8791137 · doi ↗ · pubmed ↗
- 7Narla A. When to worry about inherited bone marrow failure and myeloid malignancy predisposition syndromes in the setting of a hypocellular marrow. Hematology Am Soc Hematol Educ Program 2021 Dec 10; 2021(1): 153–156.34889379 10.1182/hematology.2021000246 PMC 8791095 · doi ↗ · pubmed ↗
- 8Li J, Bledsoe JR. Inherited bone marrow failure syndromes and germline predisposition to myeloid neoplasia: A practical approach for the pathologist. Semin Diagn Pathol 2023 Nov; 40(6): 429–442.37507252 10.1053/j.semdp.2023.06.006 · doi ↗ · pubmed ↗