NR4A1 limits CD8+ T Cell effector responses and protection in tuberculosis
Samreen Fatima, Yao Chen, Lorissa Smulan, Basanthi Satish, Mike Jameson, Sheetal Saini, Calvin Johnson, Alicia Tay, Shihui Foo, Hedayathulla Rahmathulla, Akhila Balachander, Shanshan W. Howland, Hardy Kornfeld, Amit Singhal

TL;DR
NR4A1 limits CD8+ T cell function in tuberculosis, and blocking it improves immune response and reduces infection.
Contribution
NR4A1 is identified as a novel negative regulator of CD8+ T cell immunity in TB, with therapeutic potential via the NR4A1-NKG7 axis.
Findings
Mtb-infected Nr4a1−/− mice showed reduced bacterial burden and enhanced CD8+ T cell effector functions.
NR4A1 binds to the Nkg7 promoter, and Nkg7 knockdown abrogates enhanced cytotoxicity in Nr4a1−/− CD8+ T cells.
Pharmacologic NR4A1 inhibition reduces Mtb burden and restores CD8+ T cell infiltration and Nkg7 expression.
Abstract
During Mycobacterium tuberculosis (Mtb) infection, CD8+ T cells exhibit dysfunction with impaired cytotoxicity and limited localization to granuloma cores. Using knockout mice, adoptive-transfer models and validation in macaque and human datasets, we identified the nuclear receptor NR4A1 as a key restrainer of CD8+ T cell immunity in tuberculosis (TB). Mtb-infected Nr4a1−/− mice displayed reduced bacterial burden, attenuated pathology, higher lung CD8+/CD4+ T cell ratios, and enhanced CD8+ T cell effector functions. Bulk and single-cell RNA sequencing revealed suppression of gene expression program linked with exhaustion, and expansion of Nkg7+ and Granzyme+ cytotoxic CD8+ T cell subsets in Nr4a1−/− mice. Spatial analyses demonstrated increased infiltration of Nkg7+ activated CD8+ T cells in Nr4a1−/− lesions. ChIP-qPCR showed NR4A1 binding to Nkg7 promoter, and Nkg7 knockdown abrogated…
Genes, proteins, chemicals, diseases, species, mutations and cell lines named across the full text — each resolved to its canonical identifier and authoritative record.
Click any figure to enlarge with its caption.
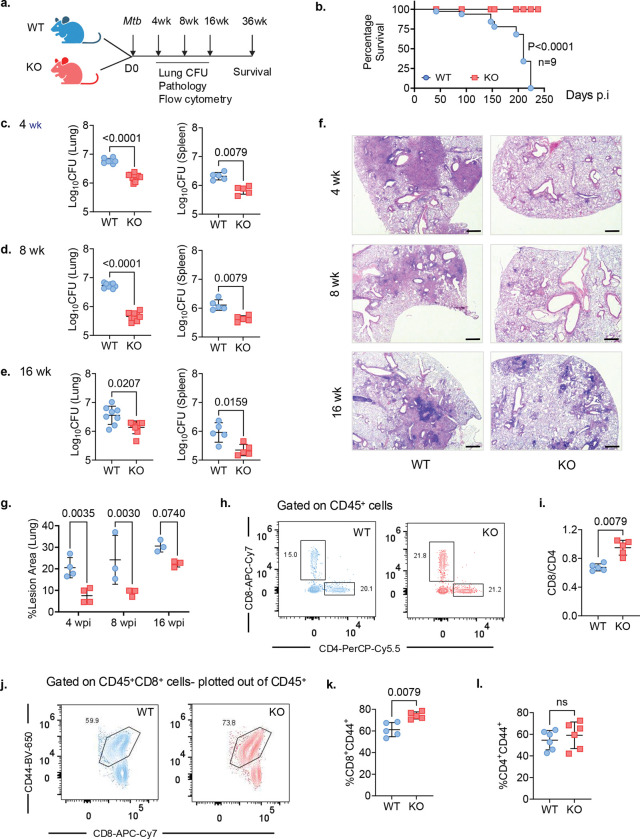 Figure 1
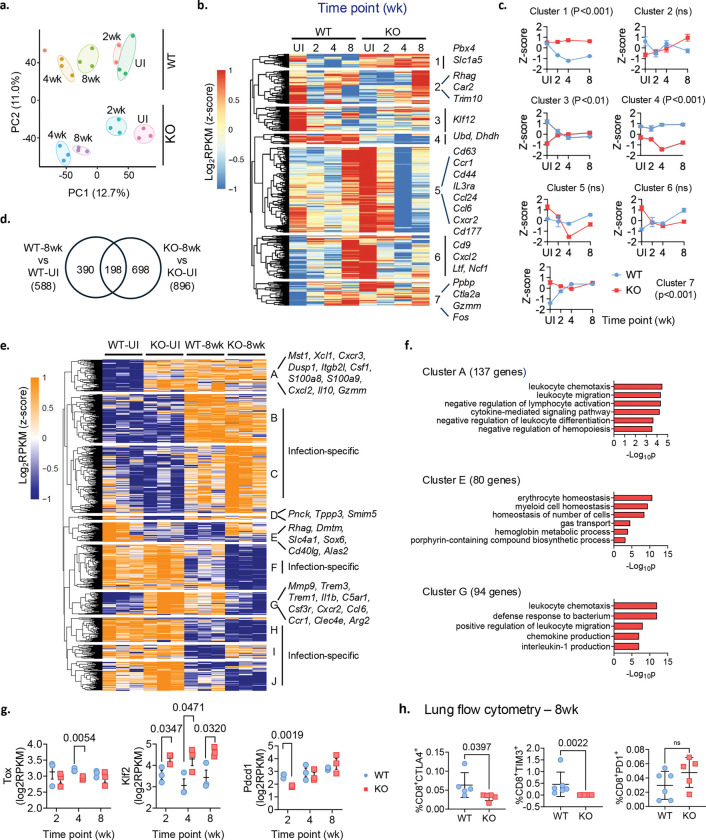 Figure 2
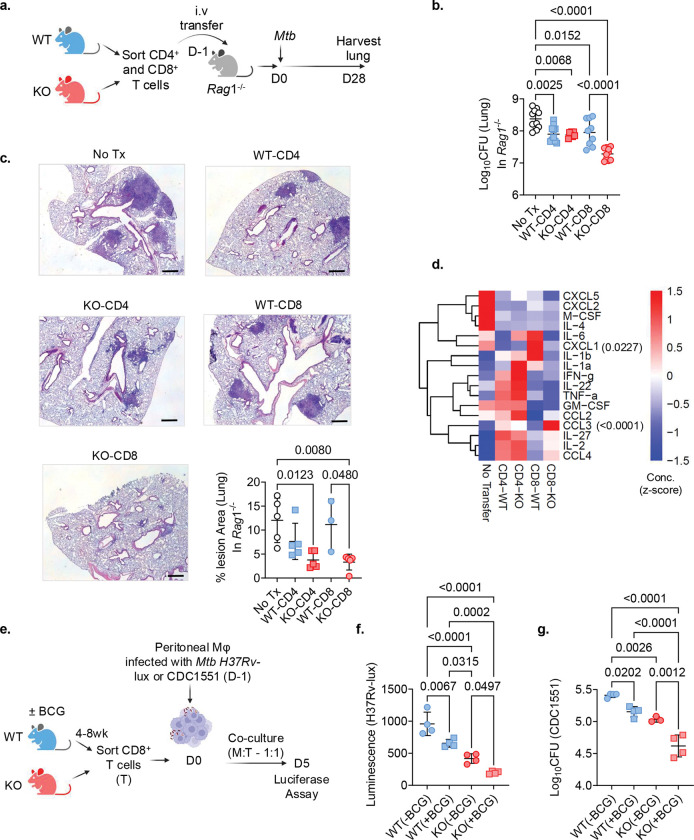 Figure 3
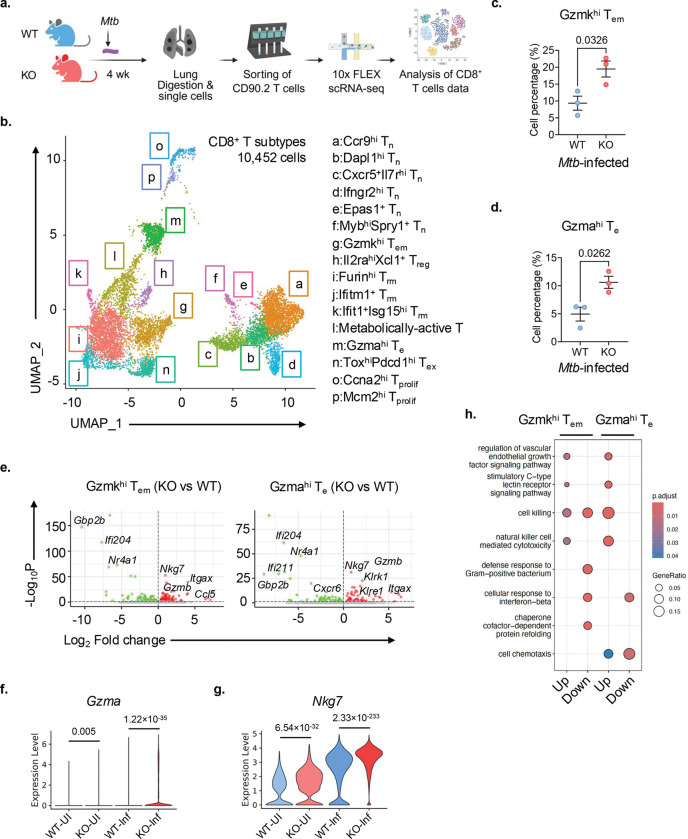 Figure 4
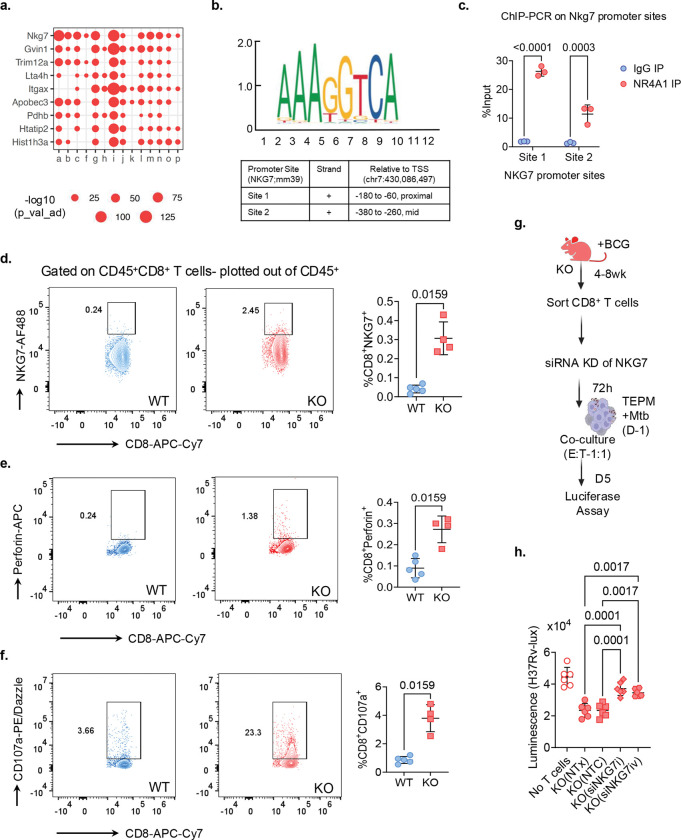 Figure 5
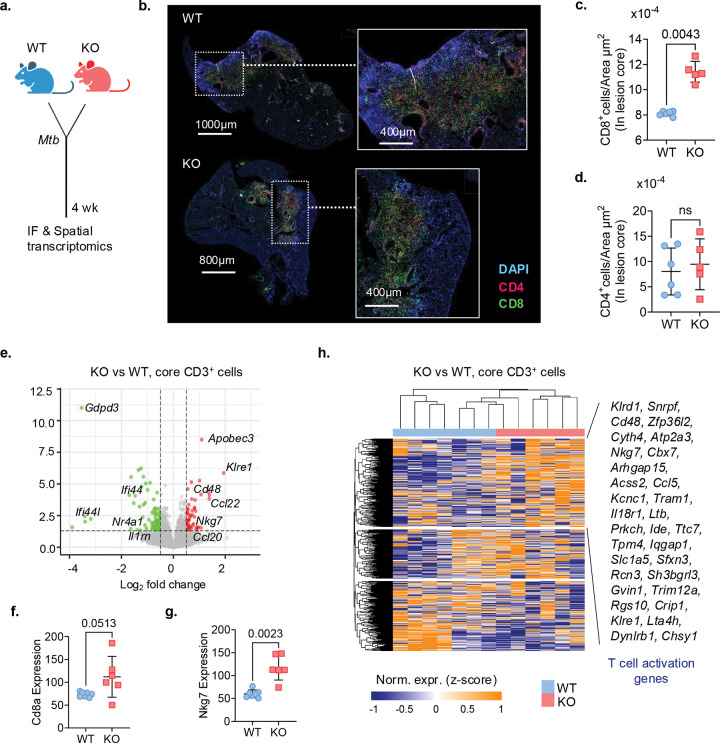 Figure 6
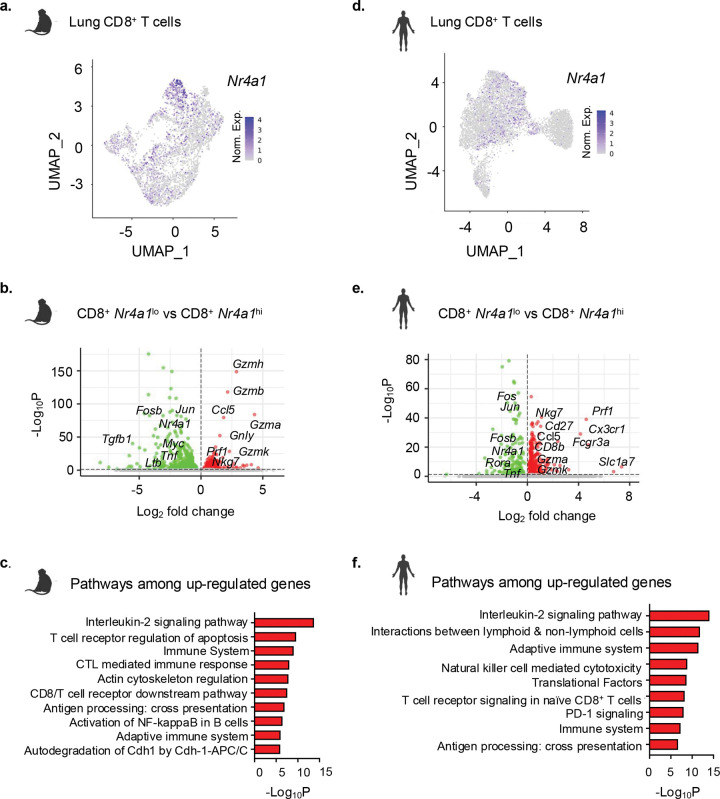 Figure 7
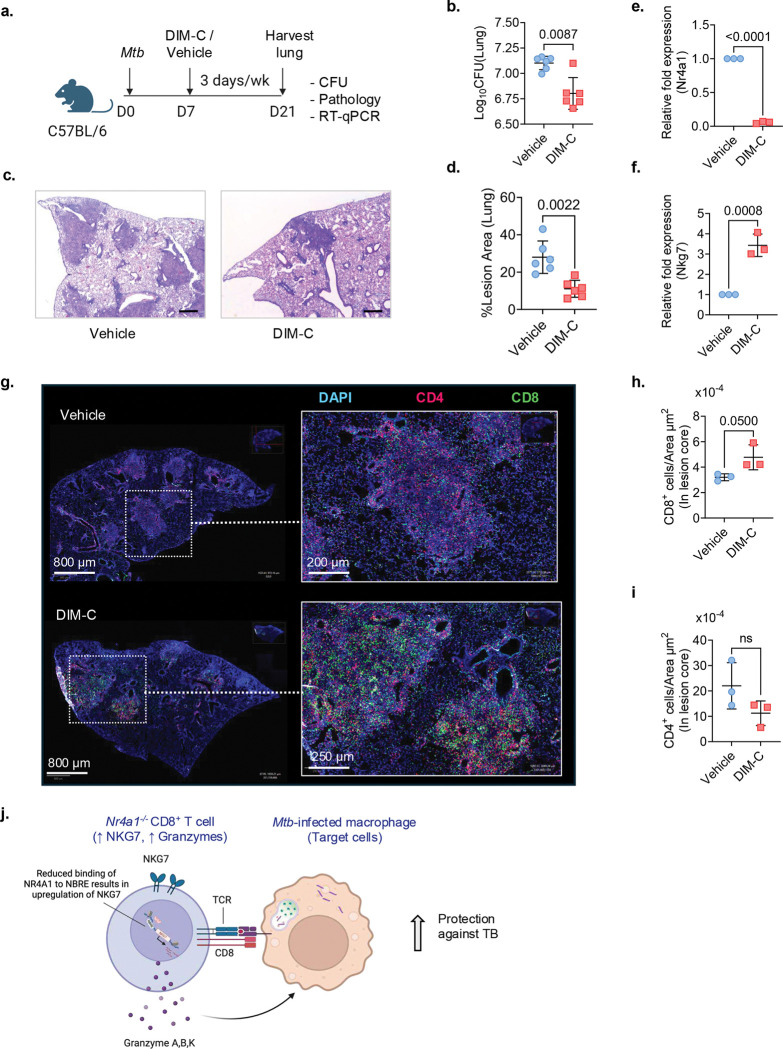 Figure 8
Peer Reviews
No public reviews on file for this paper yet. If you reviewed it on a platform where reviews are public (OpenReview, ICLR, NeurIPS, ICML), you can paste yours below so the community can read it here.
Videos
No videos yet. Explain this paper in a talk, walkthrough, or lecture? Add one.
Taxonomy
TopicsNuclear Receptors and Signaling · Immune Cell Function and Interaction · Signaling Pathways in Disease
Introduction
Tuberculosis (TB), caused by Mycobacterium tuberculosis (Mtb), remains the world’s deadliest infectious disease, with an estimated 10.8 million new cases and 1.25 million deaths in 2023^1^. Despite available antibiotics, TB continues to drive global mortality, particularly among individuals living with HIV and those infected with drug-resistant Mtb strains. Control of Mtb infection depends upon the coordinated expression of adaptive immunity. CD4^+^ T cells play the major role in TB immunity by producing cytokines like IFN-γ and TNF-α that help infected macrophages and restrict bacterial growth^2^. While CD8^+^ T cells can contribute to control of TB through cytotoxic and cytokine functions, their relative importance in vivo remains debated^3, 4, 5^. Importantly, CD8^+^ T cells are spatially excluded from granuloma cores- primary sites of active bacterial replication,^7, 8^ limiting their access to infected macrophages^9^. During chronic Mtb infection they also exhibit poor cytotoxic differentiation and show signs of functional exhaustion^10, 11^.
The orphan nuclear receptor NR4A1 (also known as Nur77) is an immediate-early gene known to regulate gene expression important for T cell exhaustion, activation and tolerance^12^. In chronic infections and cancer, NR4A1 is strongly induced in antigen-stimulated T cells, where it acts as a transcriptional repressor of key effector programs. It competes with AP-1 at regulatory DNA sites, dampening expression of cytotoxic mediators like IFN-γ and granzymes while favoring the maintenance of progenitor-exhausted subsets^13^. Beyond exhaustion, NR4A1 also contributes to peripheral tolerance and anergy by regulating Egr2, Ctla4, and Pdcd1, acting as a key transcriptional switch that limits T cell–mediated inflammation^14, 15, 16^. Given the persistent antigen stimulation and functional exhaustion characteristic of TB, we hypothesized that NR4A1 acts as a molecular brake on CD8^+^ T cell-mediated protective immunity.
In this study, we investigated the regulatory role of NR4A1 in Mtb infection and disease progression using murine models, with validation in macaque and human datasets. Genetic deletion and pharmacological inhibition of NR4A1 significantly improved resistance to TB, primarily through heightened cytotoxic potential and reduced exhaustion of CD8^+^ T cells. We showed that NR4A1 binds to the Nkg7 promoter, repressing transcription. NR4A1 deficiency derepresses NKG7 expression and facilitates infiltration of CD8^+^ T cells into TB lesions. These findings establish NR4A1 as a transcriptional checkpoint and a critical negative regulator of CD8^+^ T cell-mediated protective immunity, highlighting its potential as a target for host-directed therapy.
Results
Nr4a1 deletion enhances resistance to Mtb in mice
Wild type (WT) and Nr4a1^−/−^ (KO) mice were infected with a low aerosol dose of Mtb Erdman (Fig. 1a). In *Mtb-*infected WT mice, Nr4a1 mRNA levels in the lung increased by 2-fold at 8-weeks (wk) post-infection (Extended Data Fig. 1a). Remarkably, Nr4a1^−/−^ mice demonstrated a significant survival advantage compared to WT (Fig. 1b). Compared to WT mice, Nr4a1^−/−^ mice consistently exhibited significantly lower Mtb colony-forming units (CFU) in lung and spleen at 4, 8, and 16 wk (Fig. 1c–e). Analysis of H&E-stained lung tissue sections revealed striking differences between the genotypes. While WT mice developed large, well-structured lung lesions, lung sections from Nr4a1^−/−^ mice showed smaller, more diffuse infiltrates (Fig. 1f). Quantitative morphometry confirmed significantly reduced immune pathology in Nr4a1^−/−^ lungs at all time points (Fig. 1g). These data indicated that NR4A1 limits host control of Mtb, while its absence facilitates a more effective host response.
Since NR4A1 is highly expressed in activated T cells and regulates T cell exhaustion and activation thresholds^16, 17, 18, 19, 20^, we evaluated the T cell compartment in infected lungs (Extended Data Fig.1b). Flow-cytometric analysis at 8 wk revealed a significantly increased ratio of CD8^+^ to CD4^+^ T cells in Nr4a1^−/−^ lungs compared to WT (Fig. 1h,i). Lung CD8^+^ T cells in Nr4a1^−/−^ mice also showed a higher frequency of CD44^+^ activated cells (Fig. 1j,k). No change in the activation status of the CD4^+^ T cells was observed (Fig. 1l). These results suggested that NR4A1 affects CD8^+^ T cell activation and expansion during Mtb infection. Noteworthy, the composition of lung myeloid cells among Mtb-infected WT and Nr4a1^−/−^ mice were similar, except for a modest reduction in neutrophil percentage in Nr4a1^−/−^ lungs (Extended Data Fig. 1c-g). Collectively, these findings demonstrated that genetic deletion of NR4A1 enhances immune control of Mtb infection, identifying NR4A1 as a negative regulator of protective immunity in TB.
Distinct gene expression signatures among Nr4a1−/− CD8+ T cells
NR4A1 can both activate and repress gene expression^13, 18, 21, 22^. To characterize how NR4A1 shapes T cell transcriptional programs during Mtb infection, we performed a time-course bulk RNA-seq of magnetically sorted splenic CD8^+^ T cells from Mtb-infected and uninfected (UI) WT and Nr4a1^−/−^ mice. Principal Component analysis (PCA) revealed distinct transcriptional profiles by infection status and genotype (Fig. 2a). Time course analysis identified 463 differentially expressed genes (DEGs), forming seven clusters with distinct temporal patterns (Fig. 2b,c, Supplementary Table 1). Clusters 5 and 6 were enriched in UI Nr4a1^−/−^ CD8^+^ T cells compared to UI WT CD8^+^ T cells (KO-UI vs WT-UI, Fig. 2b). Cluster 5 genes encoded proteins related to leukocyte migration (Ccr1, Cxcr2, Trem1, Fcer1g, Ccl6, Ccl24) and cytokine-mediated signaling (Il36g, Il1b, Il1rn, Cd44, Tnfsf18); cluster 6 genes encoded antibacterial defense (Ltf, Ncf1, S100a8, Fosl2) and leukocyte migration proteins (Cd9, Cxcl2, Anxa1). Most of these support CD8^+^ T cell activation, differentiation, and cytotoxicity. The temporal trajectories of clusters 1, 3, 4 and 7 were significantly different among WT and Nr4a1^−/−^ CD8^+^ T cells over infection (2 – 8 wk; Fig. 2c). Cluster 1 genes were consistently upregulated in Nr4a1^−/−^ CD8^+^ T cells and included Pbx4 and Slc1a5, which correlates with the CD8^+^ T cell infiltration^23, 24^. Cluster 4 genes were downregulated and included Ubd and Dhdh, reported to impair T cell proliferation and function^25, 26^.
To compare genotypes at specific time points, we analyzed DEGs relative to uninfected controls. At 4 wk, WT CD8^+^ T cells exhibited 782 DEGs (WT-4wk vs WT-UI), whereas Nr4a1^−/−^ CD8^+^ T cells showed 1330 DEGs (KO-4wk vs KO-UI, Extended Data Fig. 2a), with 337 shared. Heatmap visualization identified ten clusters (cluster i-x, Supplementary Table 2), four of which (clusters ii, vi, viii and ix) were infection-specific (Extended Data Fig. 2b). Only clusters i and v showed enrichment of gene ontology (GO) (Extended Data Fig. 2c). Cluster i genes (n = 147) were elevated in Nr4a1^−/−^-UI compared to WT-UI, and encoded for T-helper 1 cytokine production (Rora, Tbx21, Xcl1, Klrc1, Il18rap) and cytokines/chemokines pathways (Ccl5, Ccl4, Xcr1, Cxcr3). The cluster i genes were also upregulated in both infected WT and Nr4a1^−/−^ CD8^+^ T cells (i.e KO-4wk and WT-4wk, Extended Data Fig. 2b). In contrast, cluster v genes (n = 229) showed upregulation only in Nr4a1^−/−^ UI (KO-UI) group, and encoded proteins for leukocyte migration (Anxa1, Cd177, Gdf15, Ccl6, Cxcr1, Cxcl13) and adhesion (Sirpb1a, Sirpb1b, Lilrb4a, Lilrb4b, Ptafr) (Extended Data Fig. 2c).
At 8 wk after infection, the DEG patterns were similar (Fig. 2d–f and Supplementary Table 2). Greater number of DEGs were identified in Nr4a1^−/−^ -CD8^+^ T cells (896 vs 588; Fig. 2d). Unsupervised clustering identified ten gene clusters (cluster A to J, Supplementary Table 2); six of which (cluster B, C, F, H, I, J) were infection-specific (Fig. 2e). Clusters A, E and G showed enrichment of GO biological processes (Fig. 2f). Cluster A genes (higher expression in Nr4a1^−/−^ UI) encoded proteins for leukocyte chemotaxis and migration (Fig. 2e,f). However, Cluster E and G genes (differentially expressed in Nr4a1^−/−^-CD8^+^ T cells vs WT), encoded proteins for leukocyte homeostasis, differentiation, chemotaxis and activation (Cd40lg, Alas2, Ccl6, Ccr1, Arg2, and Sox6)^27, 28, 29, 30^.
Given that NR4A1 regulates transcription factors such as Klf2, Irf4, and Tox to limit T cell activation and promote exhaustion ^13, 17, 18, 31, 32^, we examined these genes. Nr4a1^−/−^ CD8^+^ T cells displayed reduced Tox and increased Klf2 (Fig. 2g) accompanied by decreased Pdcd1 (Fig. 2g). Consistently, we found lower percentages of CTLA4^+^ and TIM3^+^ exhausted CD8^+^ T cells in Mtb-infected Nr4a1^−/−^ lungs at 8wk (Fig. 2h). Together, these analyses show that NR4A1 deficiency promotes an activated and less exhausted CD8^+^ T cells during Mtb infection.
NR4A1 deficiency augments CD8+ T cell driven protection in TB
Based on the gene expression data, we questioned whether Nr4a1^−/−^ CD8^+^ T cells confer superior protection against Mtb infection in vivo. To test this, splenic CD8^+^ T cells from WT and Nr4a1^−/−^ mice were adoptively transferred into Rag1^−/−^ mice that were infected one day later with Mtb Erdman (Fig. 3a). Comparison was made with transferred WT and Nr4a1^−/−^ CD4^+^ T cells (Fig. 3a). Transferred CD4^+^ T cells from either genotype affected bacterial load to a similar extent (Fig. 3b). In contrast, Rag1^−/−^ recipients of Nr4a1^−/−^ CD8^+^ T cells exhibited significantly lower pulmonary bacterial burden compared to those receiving WT CD8^+^ T cells, with a reduction of CFU comparable to transferred CD4^+^ T cells (Fig. 3b,c). Histological analysis revealed that Rag1^−/−^ mice receiving Nr4a1^−/−^ CD8^+^ T cells had smaller and less consolidated lesions compared to mice receiving either WT CD8^+^ T cells or no-transfer controls (Fig. 3c, compilation graph). Rag1^−/−^ mice receiving Nr4a1^−/−^ CD4^+^ T cells also had smaller lesions similar to WT CD4^+^ T cells (Fig. 3c). Cytokine analysis of lung homogenates revealed a significantly different inflammatory profile in Rag1^−/−^ mice that received Nr4a1^−/−^ CD8^+^ T cells compared with those receiving WT CD8^+^ T cells (CD8-KO vs CD8-WT, Fig. 3d). Importantly, Rag1^−/−^ mice receiving Nr4a1^−/−^ CD8^+^ T cells demonstrated increased CCL3 (Fig 3d), which regulate CD8^+^ T cell migration and effector functions^33, 34^.
CD8^+^ T cells are primarily known for their antigen-specific cytotoxicity, but they can also exhibit an antigen-nonspecific antimicrobial activity^35^. We evaluated this by testing the anti-Mtb activity of Nr4a1^−/−^ CD8^+^ T cells in vitro. Mtb (H37Rv-lux or CDC1551) infected thioglycolate-elicited peritoneal macrophages (TEPMs) were co-cultured with CD8^+^ T cells from either BCG-vaccinated or unvaccinated WT and Nr4a1^−/−^ mice (Fig. 3e). CD8^+^ T cells from both unvaccinated and BCG-vaccinated Nr4a1^−/−^ mice showed significantly greater suppression of Mtb replication compared to their WT counterparts (Fig. 3f,g). Notably, CD8^+^ T cells from BCG-vaccinated Nr4a1^−/−^ mice showed better protection compared with unvaccinated Nr4a1^−/−^ mice. These results demonstrated that NR4A1-deficient CD8^+^ T cells restrict Mtb in both antigen-specific and antigen-nonspecific manners, indicating a CD8^+^ T cell–intrinsic role for NR4A1 in limiting bacterial control.
scRNA-seq reveals reprogramming of Nr4a1−/− lung CD8+ T cells towards enhanced effector and cytotoxic states
To understand how NR4A1 influences CD8^+^ T cell responses in the lung during Mtb infection, we performed single-cell RNA sequencing (scRNA-seq) on lung T cells from WT and Nr4a1^−/−^ mice at 4 wk (Fig. 4a). CD8^+^ T cells from the lung of uninfected mice served as controls. Based on the expression of 30 genes and unsupervised clustering, Uniform Manifold Approximation and Projection (UMAP) analysis of 10,452 lung CD8^+^ T cells identified 16 CD8^+^ T cell clusters/subsets, including naïve, effector (Teff), effector memory (Tem), memory (Tm), tissue-resident memory (Trm), exhausted (Tex), and proliferating cells (Tprolif) (Fig. 4b and Extended Data Fig. 3a). Compared to Mtb-infected WT mice, Mtb-infected Nr4a1^−/−^ mice exhibited increased frequency of cytotoxic effector subsets, particularly Gzmk^hi^ Tem (cluster g) and Gzma^hi^ Teff (cluster m) populations (Fig. 4c,d). In contrast, CD8^+^ T cell subsets Il2ra^hi^Xcl1^+^ Treg, Furin^hi^ Trm, and Ifitm1^+^ Trm were decreased in Mtb-infected Nr4a1^−/−^ mice (Extended Data Fig. 3b). DEG analysis revealed strong upregulation of cytotoxicity-associated genes such as Gzma, Gzmb, Nkg7, Klrk1, and Ccl5 in Gzmk^hi^ Tem and Gzma^hi^ Teff subsets of Nr4a1^−/−^ CD8^+^ T cells (Fig. 4e, Supplementary Table 3). We noted that Gzma and Nkg7 were upregulated in total Nr4a1^−/−^ CD8^+^ T cells both uninfected and Mtb-infected conditions relative to WT counterpart (pseudobulk gene expression, Fig. 4f,g). GO analysis revealed significant enrichment of multiple immune effector-related biological processes in Gzmk^hi^ Tem and Gzma^hi^ Teff Nr4a1^−/−^ CD8^+^ T cells (Fig. 4h). The top enriched pathways among upregulated DEGs were cell killing and natural killer (NK) cell-mediated cytotoxicity, whereas among downregulated DEGs was cellular response to interferon-beta. Notably, suppression of type 1 IFN signaling has been associated with TB protection^36^. Chemotaxis-related pathways were also enriched, suggesting that NR4A1-deficient CD8^+^ T cells possess altered migratory capacity, consistent with the bulk RNA-seq analysis (Fig. 2). Collectively, scRNA-seq indicated that NR4A1-deficient CD8^+^ T cells express an altered transcriptional program characterized by enhanced (i) effector function, (ii) innate-like activation, and (iii) potential for improved trafficking.
NR4A1 negatively regulates NKG7 expression and limits CD8+ T cell–mediated cytotoxicity during Mtb infection
To identify the mechanisms underlying the enhanced cytolytic activity of Nr4a1^−/−^ CD8^+^ T cells, we examined the common DEGs across all 16 CD8^+^ T cell clusters in the scRNA-seq dataset (Fig. 4b). This identified Nkg7 and Gvin1 as the top two upregulated genes shared by 12 of the 16 CD8^+^ T cell clusters (Fig. 5a). The longitudinal bulk RNA-seq analysis from Mtb-infected mice (Fig. 2) also confirmed elevated Nkg7 mRNA expression in splenic Nr4a1^−/−^ compared to WT CD8^+^ T cells (Extended Data Fig. 4a). This suggested that Nkg7 expression might be regulated by NR4A1. NR4A1 regulates target gene expression by binding to NGFI-B-response elements within promoter regions^37^. Analysis of the Nkg7 promoter using the JASPAR database predicted two NR4A1-binding motifs (AAAGGTCA) (Fig. 5b). ChIP-qPCR analysis on splenic CD8^+^ T cells from WT mice confirmed NR4A1 binding at both predicted sites (Fig. 5c). Nkg7 encodes a granule associated effector protein essential for T cell cytotoxicity that plays a crucial role in the formation, trafficking and release of lytic granules^38, 39^. Having established that NR4A1 binds and represses Nkg7 transcription, we therefore examined whether this regulation influences the NKG7 expression in Nr4a1^−/−^ CD8^+^ T cells. Interestingly, flow-cytometric analysis demonstrated higher percentage of CD8^+^NKG7^+^, CD8^+^Perforin^+^ and CD8^+^CD107a^+^ T cells in the lungs of Nr4a1^−/−^ mice compared to WT mice (Fig. 5d–f), supporting an enrichment of the cytolytic program among CD8^+^ T cells in the absence of NR4A1.
Next, we tested the functional relevance of increased NKG7 in Nr4a1^−/−^ CD8^+^ T cells using siRNA knockdown in an in vitro Mtb co-culture system. CD8^+^ T cells isolated from BCG-vaccinated Nr4a1^−/−^ mice were transfected with Nkg7-specific siRNAs (siNKG7i and siNKG7iv), a non-targeting control (NTC) siRNA, or mock-transfected, and subsequently co-cultured with H37Rv-lux-infected TEPMs for five days (Fig. 5g and Extended Data Fig. 4b). Knockdown of Nkg7 abolished the ability of Nr4a1^−/−^ CD8^+^ T cells to suppress Mtb growth (Fig. 5h), indicating that NKG7 is a critical effector of bacterial control by Nr4a1^−/−^ CD8^+^ T cells. Together, these findings defined an NR4A1–NKG7 axis governing CD8^+^ T cell cytotoxicity and anti-Mtb defense.
Nr4a1−/− mice show increased infiltration of the CD8+ T cells into TB lesions
We next investigated the effect of NR4A1 ablation on CD8^+^ T cell localization in lung TB lesions. Immunofluorescence (IF) microscopy and the GeoMx Digital Spatial Profiler (DSP) whole transcriptome atlas (WTA) assay^40^ were used to map the spatial localization of T cells in lung sections from WT and Nr4a1^−/−^ mice at 4 wk (Fig. 6a). IF staining for CD8^+^ and CD4^+^ T cells revealed distinct spatial distribution patterns of T cell subsets within TB lesions (Fig. 6b). In WT mice, CD8^+^ cells were largely restricted to the lesion periphery, while in Nr4a1^−/−^ mice, CD8^+^ cells were more prominently localized within the lesion core (Fig. 6b). In contrast, CD4^+^ T cell localization was unchanged between the two genotypes. Quantitative analysis of IF images confirmed a significantly higher density of CD8^+^ T cells within the lesion core of Nr4a1^−/−^ mice compared to WT controls (Fig. 6c). In contrast, the number of CD4^+^ cells in the same region were comparable between the two groups (Fig. 6d). These observations, together with our flow cytometry data (Fig. 1h,i), suggested that NR4A1 shapes lesion architecture by limiting CD8^+^ T cell infiltration into the lesion core.
To uncover the underlying transcriptional programs associated with the intralesional CD8^+^ T cell shift, we performed spatial transcriptomic profiling on CD3^+^ T cells in the core and periphery of lung lesions from Mtb-infected WT and Nr4a1^−/−^ mice (Extended Data Fig. 5a,b). We confirmed the presence of acid-fast bacilli (AFB) bacilli in the core of lung lesions on an adjacent serial section (Extended Data Fig. 5c). The AFB region and CD3^+^ staining guided the region of interest (ROI) selection from the lesion core and periphery (Extended Data Fig. 5a-c). DEG analysis among CD3^+^ T cells from core ROIs revealed upregulation of effector and cytotoxicity-related genes (Ccl20, Ccl5, Cd48, Klre1, and Klrd1) in Nr4a1^−/−^ ROIs compared to WT ROIs (Fig. 6e, Supplementary Table 4). Core CD3^+^ T cells from Nr4a1^−/−^ mice also exhibited higher expression of Cd8a and Nkg7 (Fig. 6f,g), consistent with enhanced CD8^+^ T cell abundance and their cytotoxic activation in Nr4a1^−/−^ mice (Fig. 1, 4, 5). In contrast, Cd4 expression levels in core CD3^+^ T cells remained unaltered (Extended Data Fig. 4d). Unsupervised hierarchical clustering of core CD3^+^ T cell–associated ROIs using pseudobulk CD8^+^ T cell DEGs from scRNA-seq data clearly separated WT from Nr4a1^−/−^ mice, (Fig. 6h and Extended Data Fig. 5e). This clustering further demonstrated high expression of genes related to T cell activation, such as Cd48, Ccl5, Klrd1, in Nr4a1^−/−^ mice. Peripheral CD3^+^ T cell ROIs profiled by GeoMx DSP also showed elevated expression of Cd8a, Cd4 and Nkg7 in Nr4a1^−/−^ mice relative to WT counterparts, but they could not clearly segregate WT from Nr4a1^−/−^ mice (Extended Data Fig. 5f,g). Collectively, these findings revealed that NR4A1 acts as a transcriptional brake on both the spatial infiltration and cytotoxic programming of CD8^+^ T cells within pulmonary TB lesions.
Lung NR4A1lo CD8+ T cells from human and macaque display activated and cytotoxic gene signatures in TB
To establish that NR4A1 expression indeed stratifies functional states of CD8^+^ T cells in TB, we reanalyzed published scRNA-seq datasets from the lungs of Mtb-infected cynomolgus macaques (macaques) and active TB patients^41, 42^. CD8^+^ T cells from TB granulomas of infected macaques were categorized into four subsets, T_EMRA_, Tc17, Effector (T_Eff_) and Gzmk^i^ (Extended Data Fig. 6a); with Tc17 cells showing the highest expression of Nr4a1 mRNA (Fig. 7a and Extended Data Fig. 6b). Comparing gene expression of macaque Nr4a1^lo^ and Nr4a1^hi^ CD8^+^ T cells revealed upregulation of cytotoxic and activation-associated genes, including Nkg7, Gzmb, Gzmh, Gzma, Gnly, Ccl5, Prf1, in the Nr4a1^lo^ subset (Fig. 7b, Supplementary Table 5). GO analysis of genes upregulated in Nr4a1^lo^ cells showed an enrichment for interleukin-2 signaling, T cell receptor signaling, CTL-mediated killing, and antigen processing/cross-presentation biological processes (Fig. 7c). A similar gene expression pattern reflecting an activated and cytotoxic phenotype of lung Nr4a1^lo^ CD8^+^ T cells was observed in humans with active TB (Fig. 7d,e, Extended Data Fig. 6c,d). Consistent with the macaque data, human lung Nr4a1^lo^ CD8^+^ T cells displayed increased expression of effector and cytotoxic genes such as Nkg7, Gzmb, Gzmk, Prf1, Ccl5, which was highlighted in GO enrichment analysis (Fig. 7e,f, Supplementary Table 5). These cross-species analyses validated the relevance of mouse data and supported the hypothesis that NR4A1 is transcriptional checkpoint whose expression inversely correlates with cytotoxic effector programming.
NR4A1 inhibition improves TB control in mice
We next asked whether pharmacological inhibition of NR4A1 in WT mice could recapitulate the TB protective phenotype observed in Nr4a1^−/−^ mice (Fig. 1). To test this, Mtb-infected C57BL/6 mice were treated with the NR4A1 antagonist DIM-C-pPhCO_2_Me (DIM-C; 40 mg/kg/day)^43, 44^ starting on day 7 after infection (Fig. 8a). At the experimental endpoint (day 21), DIM-C–treated mice exhibited significantly lower pulmonary bacterial loads compared to vehicle-treated controls (Fig. 8b). Moreover, H&E staining revealed that DIM-C treatment remodeled lung pathology, yielding smaller and more diffuse lesions, in contrast to the large, well-demarcated lesions in the vehicle-treated mice (Fig. 8c). Quantitative analysis confirmed a significant reduction in lesion area in DIM-C–treated mice (Fig. 8d). DIM-C treatment significantly reduced Nr4a1 transcript levels while concomitantly upregulating Nkg7 expression in the lung tissue (Fig. 8e,f). Importantly, IF analysis demonstrated that DIM-C treatment increased the infiltration of CD8^+^ T cells into the core of lung lesions (Fig. 8g,h), mirroring the spatial redistribution of Nr4a1^−/−^ CD8^+^ T cells (Fig. 6b,c). In contrast, CD4^+^ T cell distribution was comparable between groups (Fig. 8g,i). Taken together, our findings demonstrate that inhibition of NR4A1 drives the redistribution of activated CD8^+^ T cells with enhanced cytotoxic potential in the lung during TB (Fig. 8j).
Discussion
CD8^+^ T cells contribute to the control of Mtb infection in mice, macaques and humans ^45, 46, 47, 48^, however the relative importance and molecular mechanisms of CD8^+^ T cell-driven protective immunity in TB remain incompletely defined. We identified NR4A1 as a key transcriptional checkpoint, that restrains protective CD8^+^ T cell immunity in TB. Genetic ablation or pharmacological inhibition of NR4A1 altered CD8^+^ T cell states, promoting the expansion of activation and effector mechanisms while suppressing the exhaustion programs (Fig. 2 and 4). Together, these changes lead to enhanced Mtb control in vivo (Fig. 1 and 8). In line with the gene expression data, NR4A1-deficient mice showed increased frequency of lung Perforin^+^ and CD107a^+^ cytolytic CD8^+^ T cells along with decreased CTLA4^+^ and TIM3^+^ dysfunctional CD8^+^ T cells. Blocking TIM3 on T cells has been shown to enhance T cell function and decrease Mtb load in mice^10^. Notably, our data are consistent with the chronic infection models with lymphocytic choriomeningitis virus and Listeria monocytogenes, where pathogen-specific CD8^+^ T cells deficient in NR4A1 similarly displayed enhanced functionality, including increased cytokine production and cytolytic activity^18, 49^.
Importantly, our IF data in Nr4a1^−/−^ and DIM-C-treated WT mice demonstrated spatial inclusion of NR4A1-deficient CD8^+^ T cells in TB lesions (Fig. 6b–d and 8g–i). This may have greater significance in clinical settings since one of the factors limiting CD8^+^ T cell efficacy in TB is spatial segregation away from Mtb-infected macrophages^7, 8^. Cytolytic CD8^+^ T cells must contact target cells to eliminate Mtb^50^. The protective efficacy of NR4A1 inhibition aligned with the spatial transcriptomic results, which revealed enrichment of pathways related to cytotoxicity, natural killer cell-mediated killing, and interferon signaling specifically in the lung lesion T cell-rich regions (Fig. 6e–h). Collectively our findings demonstrate that ablation or inhibition of NR4A1 unleashes enhanced intralesional effector localization, accompanied by a spatially reinforced cytotoxic gene signature that drives more potent local immune control of Mtb.
Central to the NR4A1-mediated immunoregulatory circuit is NKG7, a granule-associated effector molecule transcriptionally repressed by NR4A1 via binding to the NR4A1-binding motifs (AAAGGTCA) in its promoter. We found NKG7 to be upregulated on CD8^+^ T cells when NR4A1 was inhibited in vivo and this effector molecule was responsible for the enhanced cytolytic activity of NR4A1-deficient CD8^+^ T cells against Mtb in vitro. In a tumor setting, NR4A1 binds directly to its motifs within promoter and enhancer regions of target genes, including Ifng, Prf1, and Gzmb, to repress their expression and promote tolerant/exhausted T cells^17, 18^. This repression is further enforced through interference with AP-1 activity, recruitment of chromatin modifiers, and establishment of a closed epigenetic landscape, as shown in genome-wide studies of exhausted CD8^+^ T cells in tumors and chronic infections^18^.
While our study provides compelling evidence that NR4A1 constrains protective CD8^+^ T cell responses during Mtb infection, the work has limitations. Although we focused on CD8^+^ T cells as the primary effector population affected by NR4A1 inhibition, NR4A1 is expressed in other cell types, including macrophages, CD4^+^ T cells and epithelial cells. We did not find evidence for enhanced activity of Nr4a1^−/−^ CD4^+^ T cells in the adoptive transfer or in vitro cytotoxicity assays, but we cannot exclude the possibility that non–T cell-intrinsic effects contribute to the observed phenotypes in global knockout or inhibitor-treated mice. Moreover, Nr4a1 ^−/−^ mice exhibit spontaneous autoimmune features^31^ and NR4A1 shapes T cell development ^51^, these could act as confounding factors in our experiments. Future studies using multi-lineage conditional models or an inducible CD8^+^ T cell-specific Nr4a1-KO models will be critical to disentangle cell-type–specific roles.
In conclusion, our data in mouse models, accompanied by cross-species analyses, emphasize that reduced NR4A1 expression defines a transcriptionally reprogrammed CD8^+^ T cell state characterized by enhanced activation, cytolytic potential, and improved spatial access to Mtb-infected regions of the lung. These findings position NR4A1 as a tunable checkpoint for CD8^+^ T cell immunity in TB and provide a rationale for developing novel host-directed therapies for TB.
Methods
Study design
The objective of this study was to define the role of NR4A1 in host immunity to TB. We used Nr4a1^−/−^ mice infected with a low-dose aerosol infection of Mtb Erdman to assess the contribution of this transcription factor to disease progression. Adoptive transfer experiments were performed to determine the relative contribution of CD4^+^ versus CD8^+^ T cells from WT and Nr4a1^−/−^ mice. To investigate the mechanisms underlying the Nr4a1^−/−^ dependent phenotype, we performed bulk RNA-seq, single cell RNA-seq, spatial transcriptomics, and other assays described below. All experiments were repeated at least twice independently, with the number of biological replicates mentioned in the figure legends. Sample sizes were based on previous experiments. Where applicable, outliers were excluded using GraphPad Prism.
Mice
C57BL/6, Nr4a1^−/−^ (KO), B6129PF2/J (WT), and Rag1^−/−^ mice were purchased from The Jackson Laboratory. All mice were maintained at UMass Chan Medical School under pathogen-free conditions. The health of the mice was monitored weekly by measuring body weight. Mice of both sexes between 6 and 10 weeks of age were used in accordance with a protocol approved by the Umass Chan Institutional Animal Care and Use Committee (IACUC). Mtb-infected mice were housed in biosafety level 3 (BSL3) facilities at the University of Massachusetts Chan Medical School.
Aerosol infection in mice and bacterial quantification
Mice were infected via aerosol with Mtb Erdman using a Glas-Col Inhalation Exposure System (Terre Haute, IN), set to deliver 50–100 colony forming units (CFU) to the lungs, as confirmed by plating lung homogenates 24 hours after infection. At designated time points, mice were euthanized, and lungs and spleens were collected. Serial dilutions of tissue homogenates were plated on Middlebrook 7H11 agar plates for CFU enumeration.
In vitro infections
For in vitro infections, we used two Mtb strains: H37Rv expressing a luciferase reporter (H37Rv-lux) and the clinical isolate CDC1551. Bacteria were cultured in Middlebrook 7H9 medium (Difco) to mid-logarithmic phase (OD_600_ = 0.6–0.8). Thioglycollate-elicited peritoneal macrophages (TEPMs) were infected at a multiplicity of infection (MOI) of 1 for 3 hours, followed by three washes with fresh medium to remove extracellular bacteria. Infected macrophages were then incubated overnight at 37°C in a 5% CO_2_ atmosphere. The following day (Day 1), purified CD8^+^ T cells were added to the cultures at an effector-to-target (E:T) ratio of 1:1. Bacterial burden was assessed by luminescence measurements (H37Rv-lux) and by plating on 7H11 plates (CDC1551) on Day 5 (post T cell addition).
Generation of single-cell suspensions from the lung tissues
Lungs were isolated from mice and incubated in collagenase/DNAse for 30 min at 37 °C. Tissues were mechanically dissociated using a GentleMACS^™^ tissue dissociator (Miltenyi Biotec). The dissociated lung was passed through a 70-μm cell strainer to obtain a single-cell suspension, followed by red blood cells lysis and subsequent filtration through a 40-μm strainer to remove debris and aggregates.
Lymphocyte isolation and adoptive transfer
Single-cell suspensions of homogenized spleens were prepared from naive mice. CD4^+^ and CD8^+^ T cells were purified by positive magnetic sorting using CD4 (L3T4) and CD8a (Ly-2) MicroBeads (Miltenyi Biotec), following the manufacturer’s protocol. The purified populations were stained and assessed for purity, which consistently ranged from 90% to 95%. For adoptive transfer experiments, 1 × 10^6^ purified CD4^+^ or CD8^+^ T cells were intravenously injected into Rag1^−/−^ mice. Recipients were infected by aerosol with Mtb Erdman the following day.
BCG vaccination
For vaccinations, BCG (SSI strain) was prepared at a concentration of 10^6^ CFU/mL in 0.04% Tween-80/PBS. Mice were administered with a single 100 μL subcutaneous injection. Sham-vaccinated controls received an equal volume of saline.
Treatment with DIM-C-pPhCO2Me (DIM-C)
C57BL/6 mice were treated with the bis-indole-derived NR4A1 antagonist DIM-C-pPhCO2Me (Sigma) at a dose of 40mg/kg/day, administered every other day (3 times per week) for 21 days. Control mice were treated with vehicle-corn oil (Sigma).
Flow cytometry
Lung single-cell suspensions were stained using standardized multicolor flow cytometry protocols. Cell viability was assessed using AmCyan-conjugated Live/Dead fixable dye (Invitrogen, L34966; 1:1000). Surface markers were stained in FACS buffer with antibodies against CD45 (Pacific Blue or APC-Cy7, clone 30-F11, BioLegend), CD3 (FITC, clone 145–2C11, BioLegend and BV785, clone 17A2, Biolegend), CD4 (PerCP-Cy5.5, clone GK1.5, BioLegend), CD8α (APC-Cy7, clone 53–6.7, BioLegend), CD44 (BV650, clone IM7, BioLegend), CD62L (PE-CF594, clone MEL-14, BD Pharmingen), NK1.1 (APC or Biotin, clone PK136, BioLegend), CD69 (BV605, clone H1.2F3, BioLegend),. Additional myeloid and tissue-resident markers included Ly6G (PE-CF594, clone 1A8), Ly6C (PE-Cy7, clone HK1.4), CD11b (BV605, clone M1/70), CD11c (PE, clone N418), CD43 (BUV737, clone S7), MHC II (BV650, clone M5/114.15.2), CD64 (BV421, clone X54–5/7.1), CD24 (PerCP-Cy5.5, clone M1/69), CD103 (APC, clone 2E7), CD90.2 (Biotin, clone 53–1.2), CD45R/B220 (Biotin, clone RA3–6B2), and MERTK (BV711, BioLegend). Immune checkpoint markers included PD-1 (BV421, clone RMP1–30, BD Biosciences), TIM-3 (BV711, clone B8.2C12, BioLegend), and CTLA-4 (PE/Fire 640, clone UC10–4B9, BioLegend). Streptavidin-BUV395 (BD Biosciences) was used for biotinylated secondary staining where appropriate. For intracellular cytokine and cytotoxic protein staining, cells were stimulated ex vivo using peptide pools or anti-CD3/CD28 in the presence of brefeldin A (BD Biosciences, 555028) and PE-Dazzle594–conjugated CD107a (BioLegend; clone 1D4B, 5 μg/mL). Following stimulation, cells were fixed and permeabilized using the BD Cytofix/Cytoperm kit and stained with antibodies against Granzyme A (PE, clone 3G8.5, BioLegend), Granzyme B (PerCP, Clone QA18A28, BioLegend), Perforin (APC, clone S16009A, BioLegend) and NKG7 (Cell signaling Technology, Clone E6S2A), all used at 1:50 dilutions. Data were acquired on a Cytek Aurora spectral cytometer and analyzed using FlowJo v10 (BD Biosciences).
Histological analysis
For histology, lungs were inflated with 10% neutral-buffered formalin after perfusing with 1X Phosphate buffered saline. The multilobed right lung was immersion fixed in 10% buffered formalin for ≥24 hours. Lung tissue was processed, embedded in paraffin, sliced into 5 μm sections, and stained with hematoxylin and eosin (H&E) at the Morphology Core Facility, UMass Chan Medical School. The total lesion area and total lung area were quantified using ImageJ/Fiji and data were plotted using GraphPad Prism.
Immunofluorescence staining, Imaging and analysis
Formalin fixed paraffin-embedded (FFPE) lung sections were used for IF staining. Slides were deparaffinized, rehydrated, and subjected to antigen retrieval, followed by overnight incubation with fluorophore conjugated primary antibodies at 4°C. The primary antibodies used were anti-CD4 (Abcam EPR19514) and anti-CD8 (Abcam EPR21769). Images were acquired using a TissueFAXS iQ tissue cytometer equipped with a Hamamatsu ORCA Fusion BT camera, and quantification was performed in QuPath software^52^. For each mouse, immunofluorescence imaging was performed across all lobes of the multilobed right lung. All lesion-containing regions within these lobes were identified and imaged, resulting in variable numbers of regions per mouse due to higher lesion burden in WT and fewer lesions in Nr4a1^−/−^ mice. Lesions were manually annotated in QuPath, and CD4^+^/CD8^+^ T cells were classified based on clear full-rim membrane fluorescence. Lesion cores were manually annotated based on the central macrophage-dense or necrotic region of the lesion, clearly distinct from the peripheral lymphocyte enriched rim. For each mouse, total positive cell counts were summed across all lesion regions and normalized to the total annotated lesion area.
Quantitative real-time PCR (qPCR)
Total RNA was extracted from cells using the TRIzol reagent (Thermo Fisher Scientific) following the manufacturer’s instructions. RNA quality and concentration were assessed using a NanoDrop 2000 spectrophotometer (Thermo Fisher Scientific). Complementary DNA (cDNA) was synthesized from 1 μg total RNA using the High-Capacity cDNA Reverse Transcription kit (Applied Biosystems). Quantitative PCR (qPCR) was performed using AzuraQuant Green Fast qPCR Mix (Azura Genomics) on a CFX Opus 96 Real-Time PCR System (BioRad). Relative mRNA expression was calculated using the 2^−ΔΔCt^ method, with β-actin used as the endogenous control. Primer sequences for all target genes are provided in Supplementary Table 6. All reactions were performed in technical triplicates, and data represent at least three independent biological replicates.
Luminex Bioplex assay
Multiplex cytokine/chemokine analysis was performed using the Bio-Plex Pro Assay platform (Bio-Rad, USA), following the manufacturer’s instructions. Briefly, filtered lung tissue homogenates were collected and stored at −80°C until analysis. Samples were thawed on ice and diluted before incubation with magnetic beads coated with target-specific capture antibodies from ProcartaPlexTM Mouse Cytokine & Chemokine Convenience Panel 1A, 36plex (ThermoFisher; Cat no. EPXR360–26092-901). Fluorescence intensity was measured using a Bio-Plex 200 System (Bio-Rad), and data were analyzed using Bio-Plex Manager software. All samples were run in triplicates and results were expressed as pg/mL.
Flex scRNA-seq library preparation and sequencing
CD90.2 T cells from Mtb-infected and uninfected WT and Nr4a1^−/−^ mice were sorted and fixed using the Chromium Next-GEM Single-Cell Fixed RNA Sample Preparation Kit (10x Genomics). Four fixed samples were multiplexed in a single reaction by hybridizing four distinct barcoded mouse transcriptome probe sets from the Chromium Fixed RNA Kit (10x Genomics). For each pool of four samples, 20,000 cells were targeted for capture on the Chromium iX instrument, followed by library generation following the manufacturer’s protocol for 10x Genomics Flex Gene Expression. The resulting libraries were sequenced on an Illumina NovaSeq X Plus system, targeting 25,000 read pairs per cell.
scRNA-seq data analysis
Raw Flex scRNA-seq reads in FASTQ format were aligned to the mouse reference genome (mm10) using Cell Ranger multi (v7.1.0). The resulting demultiplexed outputs from eight libraries were then imported into Seurat (v4.4.0) in R (v4.4.2) for downstream analysis. Quality control (QC) was conducted on each library to filter out low-quality cells based on the following criteria: (1) cells with fewer than 300 or greater than 97th percentile of detected genes (nFeature_RNA), (2) cells with fewer than 500 or greater than the 97th percentile of total RNA molecules (nCount_RNA),and (3) cells with over 5% of reads mapped to mitochondrial genes. After normalization, DoubletFinder (v2.0.3) was used to identify and exclude doublets from each library. The eight Seurat objects were then integrated into a single dataset. Dimensionality reduction was performed using PCA followed by UMAP, and unsupervised clustering was conducted using a graph-based algorithm with a resolution of 1.2. To achieve finer resolution of CD8^+^ T cells, clusters expressing Cd3d and Cd8 genes were isolated and re-clustered at the same resolution. T cells expressing Cd4 and Trdc genes were removed prior to downstream analysis. The remaining CD8^+^ T cell subtypes were annotated based on their gene expression profiles, including (1) naïve T cells (T_n_) expressing Ccr7 and Sell, (2) effector memory T cells (T_em_) expressing high levels of Gzmk, (3) regulatory T cells (T_reg_) highly expressing Il2ra, (4) tissue-resident memory T cells (T_rm_) expressing Itgae and Cdh1, (5) metabolically-active T cells highly expressing mitochondrial genes such as mt-Co2 and mt-Atp6, (6) effector T cells (T_e_) highly expressing Gzma, (7) exhausted T cells (T_ex_) highly expressing Tox and Pdcd1, and (8) proliferating T cells (T_prolif_) expressing Mki67. Notably, S100a4 was highly expressed across all non-naïve T cell subsets.
Differential expression analysis between Nr4a1^−/−^-Inf (KO-Inf) and WT-Inf cells was performed for each CD8^+^ T cell subtype using the FindMarkers function from Seurat v5. The parameters were set to logfc.threshold=0 and min.pct=0 to include all genes in the analysis. Genes with an adjusted P value <0.05 were considered DEGs. For pseudobulk DEG analysis, all CD8+ T cell subtypes were aggregated to form a combined population prior to comparison. Pathway enrichment analysis of DEGs was performed using the clusterProfiler R package (v4.14.6). All genes (n = 34,089) present in the integrated Seurat object were used as the background gene set. Gene symbols were first converted to ENTREZ IDs using bitr function from clusterProfiler and org.Mm.eg.db annotation package (v3.20.0) for the mouse genome. GO over-representation analysis was carried out using compareCluster function, with the following parameters: fun=‘enrichGO’, ont=‘BP’, pvalueCutoff=0.05, and qvalueCutoff=0.10. Redundant GO terms were manually removed, and the final enrichment results were visualized using the dotplot function from clusterProfiler.
Spatial transcriptomics using GeoMx Digital Spatial Profiler
Serial sections (5 μm) from FFPE blocks were taken from selected samples, to prepare slides for RNA hybridization and profiling. Slides were baked at 60 °C for 30 minutes prior to deparaffinization, then subjected to antigen retrieval (EDTA-based pH 9, 15 minutes, >99°C). Enzymatic exposure of RNA targets (1μg/mL Proteinase K, 15 minutes, 37°C) was performed, then slides were post-fixed with 10% Neutral Buffered Formalin and washed. Slides were then hybridized overnight with GeoMx Mouse Whole Transcriptome Atlas (Nanostring) at 37 °C in a humidified chamber. After stringent washing (4X SSC + 100% Formamide, 1:1), slides were blocked with Buffer W (GeoMx RNA Slide Prep Kit) for 30 min at room temperature, then stained with the following in Buffer W for 1 hour at room temperature: SYTO13 (1:10000, Invitrogen), CD3-A647 (1:100, Biorad), CD45-A594 (1:20, Cell Signaling), CD11b-A532 (1:40, Novus). Slides were washed twice with 2X SSC before loading onto the GeoMx DSP instrument for scanning, ROI selection and segmentation. Each ROI was segmented into compartments for collection in a sequential manner; Lymphocytes (CD3^+^), Myeloid (CD11b^+^), Immune (CD45^+^) and Stroma (-residual tissue). Each segment was then eluted and placed in a well in a 96-well collection plate. Eluted probes were amplified using GeoMx Seq Code Pack (Nanostring) and pooled according to the manufacturer’s protocol. The pooled libraries were sequenced on an Illumina HiSeq X lane with 5% PhiX spike-in, targeting 100 reads per square micron of total segment area.
Spatial transcriptomics data analysis
Sequencing data were processed in the NanoString (now Bruker) GeoMx NGS Pipeline to generate DCC files, which were analyzed with R packages GeomxTools (v3.10.0) and NanoStringNCTools (v1.14.0). Areas of illumination (AOIs) were included if they met quality-control criteria: >1,000 raw reads, >80% trimmed reads, >80% stitched reads, >75% aligned reads, sequencing saturation >50%, segment area >1,000, >20 estimated nuclei, >1 negative control counts, and <9,000 counts in the NTC well; one AOI was excluded for low read count. Probe-level QC was performed using setBioProbeQCFlags function with default parameters (minProbeRatio=0.1, percetFailGrubbs=20, removeLocalOutliers=True), and the gene-level count matrix were derived by computing the geometric mean of read counts mapped to multiple probes targeting the same gene. Genes were retained if detected above the limit of quantification (LOQ) in >5% of AOIs, and data were normalized using Q3 normalization based on the top 25% most highly expressed targets. Differential expression analysis between Nr4a1^−/−^ and WT groups in core CD3^+^ cells was performed using mixedModelDE function by specifying section ID (i.e mouse ID) as a random effect; genes with log2FC>0.5 and nominal P<0.05 were considered significant.
Bulk RNA-seq library preparation and sequencing
Total RNA was extracted from mouse spleen CD8^+^ T cells lysed in TRIzol (Thermo Fisher), using acid guanidinium thiocyanate-phenol-chloroform extraction followed by a Qiagen RNeasy Micro clean-up procedure. RNA was analyzed on Agilent Bioanalyser for quality assessment. cDNA libraries were prepared using 2 ng of total RNA using the Smart-seq2 protocol ^53^ with the following modifications: 1. Addition of 20 μM TSO; 2. Use of 200 pg cDNA with 1/5 reaction of Illumina Nextera XT kit. The length distribution of the cDNA libraries was monitored using a DNA High Sensitivity Reagent Kit on the Perkin Elmer Labchip. All samples were subjected to 2×151 sequencing on an Illumina NovaSeq 6000 system targeting 15 million read pairs per sample. GO over-representation analysis was carried out using compareCluster function as described in scRNA-seq data analysis section above.
Bulk RNA-seq data analysis
Raw sequencing reads in FASTQ format were aligned to the mouse reference genome GRCm39 using the STAR aligner (v2.7.10b). Gene-level counts were obtained with the featureCounts function from the Rsubread package (v2.8.2) in R. These counts were then transformed into log_2_ RPKM values using the edgeR package (v4.4.2). PCA analysis was then performed on log_2_ RPKM values using FactoMineR package (version 2.11). Differential gene expression analysis was performed using the DESeq2 package (v1.46.0), with p-values from the Wald test adjusted for multiple comparisons via the Benjamini-Hochberg procedure. Genes were considered significantly differentially expressed if they had a false discovery rate (FDR) below 0.05 and a log_2_ fold change greater than 1.5 or less than −1.5. Time-course DEGs between Nr4a1^−/−^ and WT mice were identified at 2, 4, and 8 weeks using uninfected mice as baseline, with the main terms being genotype and time and interaction term being genotype:time.
Analysis of publicly available macaque and human datasets
Single-cell transcriptomics data of Mtb-infected macaques ^41^ was obtained from Broad Single-Cell Portal (accession code: SCP2689). Raw gene expression data stored in an AnnData object was extracted using scanpy package (v1.11.1) in Python (v3.10.12) and loaded into R using open_matrix_anndata_hdf5 function from the BPCells package (v0.3.0). A Seurat object was created from this raw expression data, incorporating associated metadata and UMAP coordinates. CD8^+^ T cells from the naïve cohort, including Tc17, T_Eff_, GZMK^hi^ T_EM/PEX_, and T_EMRA_ subsets as described by Bromley et al, were isolated, and dimensional reduction was performed on this subset. These cells were classified into CD8^+^NR4A1^lo^ (T_Eff_, GZMK^hi^ T_EM/PEX_, T_EMRA_) and CD8^+^NR4A1^hi^ (Tc17) populations based on relative NR4A1 expression levels.
Human lung single-cell transcriptomics data from active TB patients ^42^ was obtained from the GEO database (accession code: GSE192483). The filtered_feature_bc_matrix.h5 files for samples SP019H, SP019L, SP020L, SP021H, SP021L, SP023H, SP023L, SP024H, SP024L, SP025H, and SP025L were processed using the Seurat v5 package in R. QC, filtering, and doublet removal were performed as described in the “Flex scRNA-seq data analysis” section above. Data integration was conducted using the IntegrateLayers function in Seurat v5. After dimensional reduction, clustering was carried out at a resolution of 1.0, followed by sub-clustering of CD8^+^CD3^+^ cells at a resolution of 0.8. One sub-cluster (cluster 3), identified as TRDV1^+^ and likely representing contaminating γδ T cells, was removed. The remaining eight clusters were grouped into CD8^+^NR4A1^lo^ (clusters 0, 2, 4, 6) and CD8^+^NR4A1^hi^ (clusters 1, 5, 7, 8) populations based on NR4A1 expression. Only FDG^hi^ samples were included in the downstream differential expression analysis.
For both datasets, DEG analysis between CD8^+^NR4A1^lo^ and CD8^+^NR4A1^hi^ populations was performed using FindMarkers function from Seurat v5. Genes with adjusted P<0.05 were considered significant. Pathway enrichment analysis was carried out using Enrichr with the BioPlanet_2019 library.
siRNA knockdown of Nkg7 in mouse CD8+ T cells
CD8^+^ T cells were purified using magnetic sorting by positive selection with CD8a^+^ (Ly-2) MicroBeads (Miltenyi Biotec), following the manufacturer’s protocol. For siRNA transfection, cells were seeded at 1 × 10^6^ cells per well in a 96 well plate. Accell mouse Nkg7 siRNA set (Horizon Discovery/Dharmacon; A-063689–15-0010) consisting of four individual Accell siRNAs targeting Nkg7 was used for gene knockdown. A non-targeting Accell siRNA control pool (D-001910–10-05) was used as control. Briefly, siRNA was reconstituted in nuclease-free water to a 100 μM stock concentration and diluted in Accell Delivery Media to a final concentration of 1 μM. The culture medium was replaced with siRNA-containing Accell Delivery Media, and cells were incubated at 37°C with 5% CO_2_ for 24–72 hours to allow siRNA uptake and gene silencing; as per the manufacturer’s protocol. Gene knockdown efficiency was assessed by quantitative PCR (qPCR) for mRNA expression.
Chromatin Immunoprecipitation (ChIP)–qPCR
Splenic CD8^+^ T cells from C57BL/6 mice were isolated by magnetic sorting (Miltenyi Biotec). For each ChIP reaction, 1.5 × 10^7^ CD8^+^ T cells were used. Cells were stimulated with phorbol 12-myristate 13-acetate (PMA, 20 ng/ml) and ionomycin (1 μg/ml) for 6 h at 37 °C prior to chromatin preparation. ChIP assays were performed using the ChIP-IT PBMC Kit (Active Motif, 53042) following the manufacturer’s instructions. Chromatin was immunoprecipitated using anti-NR4A1 (NGFI-Bα/Nur77) antibody (5 μg per reaction, Novus Biologicals, # NB100–56745) or normal IgG control. The recovered DNA was analyzed by quantitative PCR using Nkg7 promoter specific primers and AzuraQuant^™^ GreenFast qPCR Mix (AZ-2105) on a CFX Opus 96 Real Time PCR System (Biorad). Raw Ct values from ChIP and input DNA were used to calculate enrichment relative to input (% input) using the formula: % Input = 100 × ^2[Ct(Input) − Ct(ChIP)]^. For comparison across samples, enrichment was normalized to IgG controls and data are presented as percent input.
Data visualization and Statistical analysis
All dot plots and bar graphs were generated using GraphPad Prism (v9.5.1), with statistical analyses detailed in the respective figure legends. UMAPs, feature plots, violin plots, and gene expression bubble plots for single-cell and spatial transcriptomics data were produced using the Seurat package in R. The stacked violin plot was generated with the scCustomize package (v3.0.1). Volcano plots were created using the EnhancedVolcano package (v1.24.0), and heatmaps were generated using the pheatmap package (v1.0.12). Schematic diagrams illustrating the experimental workflows were created using BioRender (https://www.biorender.com).
Supplementary Material
Supplementary Files
This is a list of supplementary files associated with this preprint. Click to download.
• NR4APaperextended gures19thNov.pdf
Supplementary Table 1 DEGs identified from the time-course RNA-seq analysis of splenic CD8^+^ T cells from WT and Nr4a1−/− mice.
Supplementary Table 2 DEGs in splenic CD8^+^ T cells from WT and Nr4a1−/− mice at 4 and 8 wk after Mtb infection (Fig. 2d). Includes cluster assignments for 4 wk DEGs (clusters i–x; Extended Data Fig. 2b) and 8 wk DEGs (clusters A–J; Fig. 2e).
Supplementary Table 3 DEGs from scRNA-seq analysis of lung CD8^+^ T cell subsets from WT and Nr4a1−/− mice at 4 wk. Includes gene lists for Gzmk^+^ effector-memory (cluster g) and Gzma^+^ effector (cluster m) populations (Fig. 4e).
Supplementary Table 4 DEGs from GeoMx DSP whole-transcriptome analysis of CD3^+^ T cell ROIs in lung lesions at 4 wk.
Supplementary Table 5 DEGs stratified by NR4A1 expression state (NR4A1^lo^ versus NR4A1^hi^) in CD8^+^ T cells from macaques and human TB datasets
Supplementary Table 6 Sequences of primers
The reference list from the paper itself. Each links out to its DOI / PubMed record.
- 1Global Tuberculosis Report 2024. Geneva: World Health Organization; 2024.
- 2Sakai S., Mayer-Barber K.D. & Barber D.L. Defining features of protective CD 4 T cell responses to Mycobacterium tuberculosis. Curr Opin Immunol 29, 137–142 (2014).25000593 10.1016/j.coi.2014.06.003PMC 4122329 · doi ↗ · pubmed ↗
- 3Larsen S.E., Williams B.D., Rais M., Coler R.N. & Baldwin S.L. It Takes a Village: The Multifaceted Immune Response to Mycobacterium tuberculosis Infection and Vaccine-Induced Immunity. Front Immunol 13, 840225 (2022).35359957 10.3389/fimmu.2022.840225 PMC 8960931 · doi ↗ · pubmed ↗
- 4Lazarevic V. & Flynn J. CD 8+ T cells in tuberculosis. Am J Respir Crit Care Med 166, 1116–1121 (2002).12379557 10.1164/rccm.2204027 · doi ↗ · pubmed ↗
- 5Lin P.L. & Flynn J.L. CD 8 T cells and Mycobacterium tuberculosis infection. Seminars in immunopathology 37, 239–249 (2015).25917388 10.1007/s 00281-015-0490-8PMC 4439333 · doi ↗ · pubmed ↗
- 6Mott D. High Bacillary Burden and the ESX-1 Type VII Secretion System Promote MHC Class I Presentation by Mycobacterium tuberculosis-Infected Macrophages to CD 8 T Cells. Journal of immunology (Baltimore, Md. : 1950) 210, 1531–1542 (2023).37000471 10.4049/jimmunol.2300001 PMC 10159937 · doi ↗ · pubmed ↗
- 7Ashenafi S. & Brighenti S. Reinventing the human tuberculosis (TB) granuloma: Learning from the cancer field. Front Immunol 13, 1059725 (2022).36591229 10.3389/fimmu.2022.1059725 PMC 9797505 · doi ↗ · pubmed ↗
- 8Mc Caffrey E.F. The immunoregulatory landscape of human tuberculosis granulomas. Nat Immunol 23, 318–329 (2022).35058616 10.1038/s 41590-021-01121-x PMC 8810384 · doi ↗ · pubmed ↗