Identification of susceptibility loci using a novel murine model for triple-negative breast cancer
Minjeong Kim, Logan G McGrath, Zeid T Mustafa, Samson Eugin Simon, Naveed Pervaiz, Emily W Grey, Sydney C Joseph, Emily Korba, Sandesh J Marathe, Margaret S Bohm, Arvind V Ramesh, Sidharth S Mahajan, Casey J Bohl, Pjotr Prins, Robert W Read, Jeremiah R Holt, D Neil Hayes, Lu Lu

TL;DR
A new mouse model for triple-negative breast cancer reveals genetic loci and genes linked to tumor traits and poor patient survival.
Contribution
A novel murine model with genetic diversity identifies conserved TNBC modifiers and potential therapeutic targets.
Findings
Loci on chromosomes 16 and 10 are associated with tumor multiplicity and latency in TNBC.
Genes GNS, RASSF3, and TBC1D30 are linked to poor survival in breast cancer patients.
The BXD-BC model enables identification of heritable tumor traits and genetic modifiers.
Abstract
Triple-negative breast cancer (TNBC) is the deadliest subtype of breast cancer (BC) with few targeted therapies. To identify novel genetic modifiers of TNBC, we created a murine model incorporating high levels of genetic and phenotypic diversity. C3(1)-T-antigen (“C3Tag”) mice, which develop spontaneous basal-like TNBC tumors, were systematically crossed with a large set of sequenced BXD recombinant inbred strains to produce isogenic hybrids segregating for C3Tag. The severity of TNBC traits including tumor latency, multiplicity, and survival was highly variable and heritable. We mapped modifiers of TNBC and identified loci on chromosomes 16 and 10 associated with tumor multiplicity and latency, respectively. Candidate genes were prioritized including a lysosomal enzyme involved in cell proliferation, Gns; tumor suppressor Rassf3; and Rab-modifying Tbc1d30. In tumors from BC patients,…
Genes, proteins, chemicals, diseases, species, mutations and cell lines named across the full text — each resolved to its canonical identifier and authoritative record.
Click any figure to enlarge with its caption.
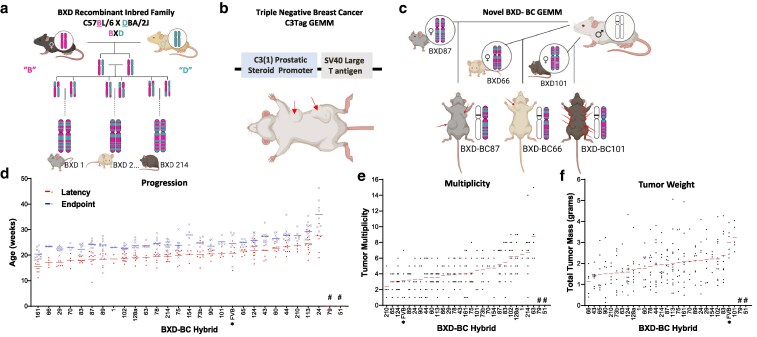 Fig. 1
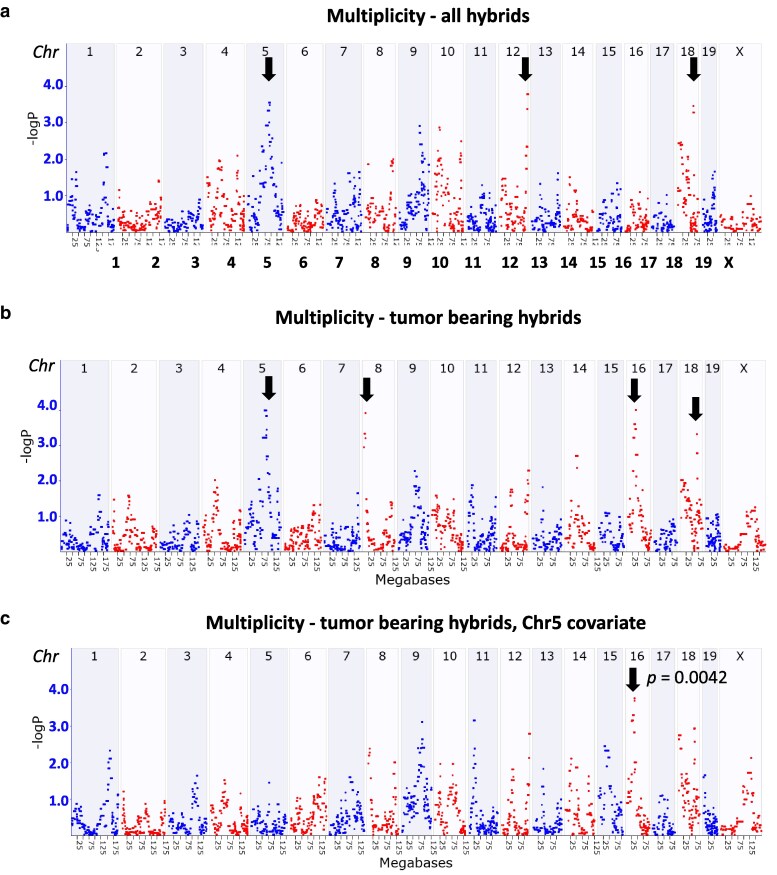 Fig. 2
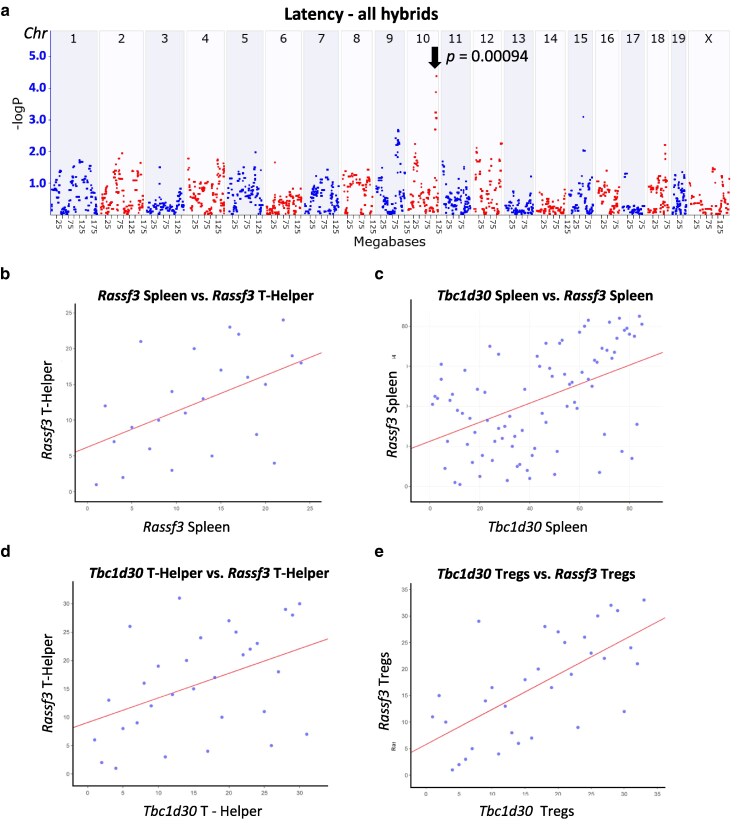 Fig. 3
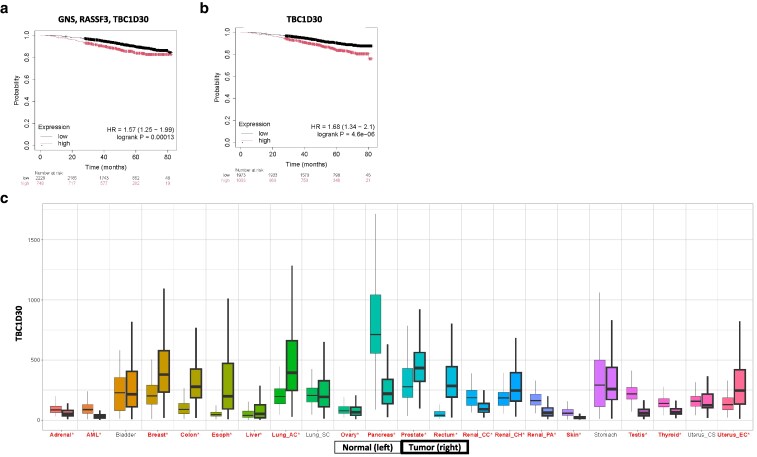 Fig. 4
| Phenotype (trait) |
|
|
|---|---|---|
| Age at endpoint | 0.633 | 2.94 × 10⁻²⁸ |
| Tumor latency | 0.524 | 9.63 × 10⁻¹⁹ |
| Multiplicity | 0.357 | 1.54 × 10⁻⁸ |
| Survival (time from latency to endpoint) | 0.194 | 0.022 |
| Endpoint 1 tumor >2 cm | 0.152 | 0.172 |
| Endpoint 3 tumors >1 cm | 0.152 | 0.174 |
| Total tumor weight | 0.145 | 0.228 |
| T1 tumor location | 0.138 | 0.359 |
| T1 tumor weight | 0.100 | 0.755 |
| T1 volume | 0.077 | 0.940 |
| Total tumor volume | 0.074 | 0.955 |
| Cis-eQTL genes in Chr 16 −logP Peak position | Tumor multiplicity_strains with only tumor (GeneNetword ID: BXD_21528) | ||||||||
|---|---|---|---|---|---|---|---|---|---|
| Chr | Gene | Tissue | Probe ID | −logP | Peak Position |
|
| Rho | Rho |
| 16 |
| T-helper cells | 1417600_at | 13.78 | Chr 16: 32.540701 | 0.48 | 0.409 | 0.60 | 0.285 |
| 16 |
| T-regulatory cells | 1417600_at | 18.52 | Chr 16: 32.540701 | 0.52 | 0.373 | 0.60 | 0.285 |
| 16 |
| T-helper cells | 1439825_at | 5.42 | Chr 16: 34.308361 | 0.64 | 0.241 | 0.90 | 0.037 |
| 16 |
| T-regulatory cells | 1439825_at | 12.19 | Chr 16: 34.308361 | 0.71 | 0.183 | 0.90 | 0.037 |
| 16 |
| Spleen | 10439092 | 12.48 | Chr 16: 36.361531 | 0.52 | 0.024 | 0.54 | 0.017 |
| 16 |
| T-helper cells | 1441069_at | 7.26 | Chr 16: 36.946692 | −0.87 | 0.053 | −0.87 | 0.037 |
|
| Tumor latency_strains including without tumor (GeneNetword ID: BXD_24402) | ||||||||
|---|---|---|---|---|---|---|---|---|---|
| Chr | Gene | Tissue | Probe ID | −logP | Peak Position |
|
| Rho | Rho |
| 10 |
| T-helper cells | 1433488_x_at | 4.97 | Chr 10: 120.212361 | −0.588 | 0.220 | −1.000 | 1.50 × 10−40 |
| 10 |
| Spleen | 10372844 | 7.18 | Chr 10: 120.634059 | 0.559 | 0.016 | 0.278 | 0.264 |
| 10 |
| Spleen | 10372831 | 9.19 | Chr 10: 120.634059 | 0.474 | 0.047 | 0.359 | 0.143 |
| 10 |
| T-regulatory cells | 1439151_at | 4.07 | Chr 10: 120.783223 | 0.729 | 0.100 | 0.829 | 0.042 |
| 10 |
| T-regulatory cells | 1430607_at | 8.65 | Chr 10: 121.266431 | 0.665 | 0.150 | 0.886 | 0.019 |
| 10 |
| T-regulatory cells | 1448547_at | 6.52 | Chr 10: 121.411254 | 0.782 | 0.066 | 0.551 | 0.257 |
| QTL | Mouse proximal gene | Mouse distal gene | Mouse proximal gene location | Mouse distal gene location | Approx. mouse region length | Human proximal gene location | Human distal gene location | Approx. human region length |
|---|---|---|---|---|---|---|---|---|
| Chr 10 |
|
| Chr 10: 117.4 | Chr 10: 121.4 | 4.05 | Chr 12: 69.3 | Chr 12: 64.6 | — |
| Chr 16 |
|
| Chr 16: 33.7 | Chr 16: 36.9 | 3.20 | Chr 3: 125.1 | Chr 3: 121.7 | — |
| Index | Gene symbol | Variant type | Variant ID | Gene variant location (Chr: Mb) | Library | PheWAS |
|
|---|---|---|---|---|---|---|---|
| 1 | CPSF6 | Intron variant (A > G) | rs554429384 | 12: 69573035 |
| Ovarian cancer | 2.80 × 10⁻⁵ |
| 2 | CPM | Intron variant (C > T) | rs9943849 | 12:67657023 |
| Malignant neoplasm of the renal pelvis | 3.50 × 10⁻² |
| Intron variant (C > T) | rs9943849 | 12 67657023 | Benign neoplasm of the brain and other parts of the nervous system | 4.17 × 10⁻² | |||
| Intron variant (G > A) | rs7304105 | 12:69181478 |
| Breast cancer | 4.20 × 10⁻¹⁰ | ||
| 3′ UTR (A > G) | rs557499913 | 12:68841838 |
| Benign neoplasm of the uterus | 7.90 × 10⁻⁹ | ||
| 3′ UTR (A > G) | rs557499913 | 12:68841838 | Uterine leiomyoma | 3.40 × 10⁻⁹ | |||
| 4 | MDM2 | Intron variant (G > A) | rs7304105 | 12:69181478 |
| Breast cancer | 4.20 × 10⁻¹⁰ |
| 5 | SLC35E3 | Intron variant (G > A) | rs7304105 | 12:69181478 |
| Breast cancer | 4.20 × 10⁻¹⁰ |
| 6 | NUP107 | Intron variant (G > A) | rs7304105 | 12:69181478 |
| Breast cancer | 4.20 × 10⁻¹⁰ |
| Missense (G > A) | rs139991199 | 12:69083373 |
| Age at cancer diagnosis | 9.48 × 10⁻⁶ | ||
| Intron variant (C > T) | rs551692899 | 12:68646350 |
| Benign neoplasm of the uterus and uterine leiomyoma | 3.40 × 10⁻⁹ | ||
| 3′ UTR (A > G) | rs557499913 | 12:68841838 | Uterine leiomyoma | 3.40 × 10⁻⁹ | |||
| 3′ UTR (A > G) | rs557499913 | 12:68841838 | Benign neoplasm of the uterus | 7.90 × 10⁻⁹ | |||
| Intron variant (A > G) | rs183391298 | 12:68683185 | Benign neoplasm of the colon | 2.20 × 10⁻⁷ | |||
| 7 | RAP1B | Regulatory region variant (C > G) | rs190966000 | 12:68565994 |
| Benign neoplasm of the colon | 1.50 × 10⁻⁸ |
| Intron variant (C > T) | rs551692899 | 12:68646350 | Benign neoplasm of the uterus | 1.60 × 10⁻⁷ | |||
| Intron variant (A > G) | rs2546509 | 12:69083237 |
| Breast cancer | 5.20 × 10⁻⁹ | ||
| 8 | GRIP1 | Intron variant (CTGTG > C) | rs916631817 | 12:66563178 |
| Benign neoplasm of the uterus | 3.40 × 10⁻⁷ |
| 9 | IL22 | Splice donor (A > G) | rs867810424 | 12:68647041 |
| Breast fibroadenoma | 3.06 × 10⁻⁶ |
| 10 | IRAK3 | Missense (A > G) | rs139342884 | 12:66610970 |
| Congenital malformations of the breast | 5.49 × 10⁻⁴ |
| Intergenic variant (T > C) | rs147746198 | 12:66097705 |
| Hyperplasia of the prostate | 9.10 × 10⁻⁷ | ||
| Intergenic variant (C > A) | rs75184621 | 12:66179444 | Hyperplasia of the prostate | 9.10 × 10⁻⁷ | |||
| 11 | TMBIM4 | Missense (G >A) | rs200879651 | 12:66563658 |
| Congenital malformations of the breast | 5.18 × 10⁻¹³ |
| Intron variant (A > C) | rs117368235 | 12:66543913 | Congenital malformations of the breast | 1.15 × 10⁻⁵ | |||
| Intergenic variant (T > C) | rs147746198 | 12:66097705 |
| Hyperplasia of the prostate | 9.10 × 10⁻⁷ | ||
| Intron variant (C > A) | rs34750837 | 12:66161838 | Hyperplasia of the prostate | 9.10 × 10⁻⁷ | |||
| 12 | LLPH | Intergenic variant (T > C) | rs147746198 | 12:66097705 |
| Hyperplasia of the prostate | 9.10 × 10⁻⁷ |
| Intron variant (C > A) | rs34750837 | 12:66161838 | Hyperplasia of the prostate | 9.10 × 10⁻⁷ | |||
| 13 | HMGA2 | Intergenic variant (T > C) | rs12424086 | 12:64650776 |
| Cancer of other female genital organs | 4.60 × 10⁻³ |
| Intergenic variant (T > C) | rs12424086 | 12:64650776 | Ovarian cancer | 9.35 × 10⁻³ | |||
| 3′ UTR (C > A/C > G/C > T) | rs8756 | 12:64646019 | Uterine cancer | 9.64 × 10⁻³ | |||
| Intron variant (C > A/C > T) | rs7979673 | 12:64513524 | Uterine cancer | 1.13 × 10⁻² | |||
| Intergenic variant (T > C) | rs12424086 | 12:64650776 | Hepatic cancer, primary | 2.24 × 10⁻² | |||
| Intergenic variant (T > C) | rs12424086 | 12:64650776 | Pancreatic cancer | 2.29 × 10⁻² | |||
| 3′ UTR (C > A/C > G/C > T) | rs8756 | 12 64646019 | Benign neoplasm of other parts of the digestive system | 6.67 × 10⁻³ | |||
| 3′ UTR (C > A/C > G/C > T) | rs8756 | 12:64646019 | Benign neoplasm of other endocrine glands | 2.33 × 10⁻² | |||
| 3′ UTR (C > A/C > G/C > T) | rs8756 | 12:64646019 | Skin neoplasm of uncertain behavior | 3.99 × 10⁻² | |||
| 14 | MSRB3 | Intron variant (T > A/T > C/T > G) | rs10506525 | 12:64069645 |
| Pancreatic cancer | 3.33 × 10⁻² |
| Intron variant (T > A/T > C/T > G) | rs10506525 | 12:64069646 | Benign neoplasm of respiratory and intrathoracic organs | 4.25 × 10⁻² | |||
| Intron variant (C > G) | rs117523829 | 12:65707367 | Congenital malformations of the breast | 4.11 × 10⁻⁷ | |||
| 15 | TBC1D30 | Intron variant (A > G) | rs939876 | 12 63538385 |
| Mouth cancer | 1.47 × 10⁻² |
| Intron variant (A > G) | rs939876 | 12 63538385 | Neoplasm of uncertain behavior | 6.08 × 10⁻³ | |||
| Intron variant (A > G) | rs939876 | 12 63538385 | Hx of malignant neoplasm of the oral cavity and pharynx | 2.43 × 10⁻² | |||
| Intron variant (A > G) | rs939876 | 12 63538385 | Malignant neoplasm of the brain and nervous system | 3.27 × 10⁻² | |||
| Intron variant (A > G) | rs11175566 | 12:65214248 |
| Congenital malformations of the breast | 7.76 × 10⁻⁶ | ||
| 3′ UTR (C > G) | rs117754169 | 12:65272906 | Tongue cancer | 4.02 × 10⁻⁵ | |||
| Intron variant (C > T) | rs7313651 | 12:64618224 |
| Prostate cancer | 1.80 × 10⁻¹⁷ | ||
| Intron variant (A > G) | rs1147107 | 12:64632562 | Prostate cancer | 1.80 × 10⁻¹⁷ | |||
| 5′ UTR (A > G) | rs1245183 | 12:65059192 | Prostate cancer | 1.80 × 10⁻¹⁷ | |||
| 16 | GNS | Intron variant (T > C) | rs7968403 | 12:65012824 |
| Prostate cancer | 1.20 × 10⁻¹⁹ |
| Intron variant (A > G) | rs1147107 | 12:65026342 | Prostate cancer | 1.20 × 10⁻¹⁹ | |||
| Intron variant (T > G) | rs1244869 | 12:6507533 | Prostate cancer | 1.20 × 10⁻¹⁹ | |||
| Intron variant (T > C) | rs7968403 | 12:65012824 | Breast and prostate cancer | 4.30 × 10⁻⁶ | |||
| Intron variant (A > G) | rs1147107 | 12:65026342 | Breast and prostate cancer | 4.30 × 10⁻⁶ | |||
| Intron variant (T > G) | rs1244869 | 12:6507533 | Breast and prostate cancer | 4.30 × 10⁻⁶ | |||
| 5′ UTR (A > G) | rs1245183 | 12:65059192 |
| Prostate cancer | 1.80 × 10⁻¹⁷ | ||
| 17 | RASSF3 | Intron variant (A > G) | rs1245183 | 12:65059192 |
| Prostate cancer | 1.80 × 10⁻¹⁷ |
| Intron variant (T > C) | rs7968403 | 12:65012824 | Prostate cancer | 1.20 × 10⁻¹⁹ | |||
| Intron variant (T > C) | rs7968403 | 12:65012824 | Breast and prostate cancer | 4.30 × 10⁻⁶ | |||
| Intron variant (T > C) | rs7968403 | 12:65012824 | Esophageal cancer | 3.30 × 10⁻³ | |||
| Intron variant (A > G) | rs1147107 | 12:65026342 |
| Breast and prostate cancer | 4.30 × 10⁻⁶ | ||
| Intron variant (T > G) | rs1244869 | 12:6507533 | Breast and prostate cancer | 4.30 × 10⁻⁶ | |||
| Intron variant (C > T) | rs7313651 | 12:64618224 | Breast cancer | 5.10 × 10⁻² | |||
| Intron variant (C > T) | rs7313651 | 12:64618224 | Breast cancer (female) | 6.00 × 10⁻² | |||
| Intron variant (C > T) | rs7313651 | 12:64618224 | Prostate cancer | 3.90 × 10⁻³ | |||
| Intron variant (A > G) | rs1147107 | 12:64632562 | Prostate cancer | 7.90 × 10⁻³ | |||
| Intron variant (A > G) | rs1147107 | 12:64632562 | Cancer of intrathoracic organs | 1.90 × 10⁻² | |||
| Intron variant (A > G) | rs1147107 | 12:64632562 | Pancreatic cancer | 2.90 × 10⁻² | |||
| Intron variant (A > G) | rs1147107 | 12:64632562 | Breast cancer (female) | 8.40 × 10⁻² | |||
| Intron variant (A > G) | rs1147107 | 12:64632562 | Breast cancer | 9.00 × 10⁻² | |||
| Intron variant (G > T) | rs2682728 | 12:64682718 | Malignant neoplasm of the uterus | 1.30 × 10⁻² | |||
| Intron variant (G > T) | rs2682728 | 12:64682718 | Cancer of intrathoracic organs | 2.40 × 10⁻² | |||
| Intron variant (T > G) | rs1244869 | 12:64681552 | Pancreatic cancer | 1.80 × 10⁻² | |||
| 18 | HEG1 | Intron variant (C > A/C > G) | rs190282002 | 3:124771081 |
| Pharyngeal and laryngeal cancer | 1.70 × 10⁻⁵ |
| 19 | MUC13 | Intron variant (C > A/C > G) | rs190282002 | 3:124771081 |
| Pharyngeal and laryngeal cancer | 1.70 × 10⁻⁵ |
| 20 | ITGB5 | Missense (C > T) | rs61736434) | 3:124515354 |
| Congenital malformations of the breast | 2.33 × 10⁻¹⁰ |
| Intron variant (A > G) | rs760416624 | 3:124714206 |
| Benign neoplasm of the colon | 6.70 × 10⁻⁷ | ||
| 21 | UMPS | Intron variant (A > G) | rs760416624 | 3:124714206 |
| Benign neoplasm of the colon | 6.70 × 10⁻⁷ |
| 22 | KALRN | Intron variant (C > T) | rs762914024 | 3:124457563 |
| Benign neoplasm of the colon | 6.70 × 10⁻⁷ |
| 23 | MYLK | Intron variant (A > C) | rs76810901 | 3:123380319 |
| Breast cancer | 3.53 × 10⁻⁵ |
| Intron variant (C > A) | rs9851418 | 3:123435754 | Benign breast lump | 2.47 × 10⁻⁵ | |||
| Intron variant (C > T) | rs116256520 | 3:123356070 | Cervical intraepithelial neoplasia/precancerous cells of the cervix | 2.60 × 10⁻⁵ | |||
| 24 | PDIA5 | Missense (A > G) | rs368837820 | 3:122880168 |
| Benign neuroma | 1.77 × 10⁻⁹ |
| Missense (G > A) | rs202014966 | 3:122942523 | Congenital malformations of the breast | 3.80 × 10⁻¹⁰ | |||
| 25 | PARP15 | Missense (A > G) | rs753177428 | 3:122635033 |
| Malignant neoplasm, other | 3.10 × 10⁻⁶ |
| 26 | DTX3L | Missense (A > G) | rs753177428 | 3:122635033 |
| Malignant neoplasm, other | 3.10 × 10⁻⁶ |
| 27 | PARP9 | Missense (A > G) | rs753177428 | 3:122635033 |
| Malignant neoplasm, other | 3.10 × 10⁻⁶ |
| 28 | KPNA1 | 3′ UTR (C > T) | rs189676830 | 3:122424634 |
| Bladder cancer | 7.50 × 10⁻⁸ |
| Intron variant (C > T) | rs572858475 | 3:122389010 | Bladder cancer | 7.50 × 10⁻⁸ | |||
| 3′ UTR (C > T) | rs189676830 | 3:122424634 | Malignant neoplasm of the bladder | 4.40 × 10⁻⁷ | |||
| Intron variant (C > T) | rs572858475 | 3:122389010 | Malignant neoplasm of the bladder | 4.40 × 10⁻⁷ | |||
| 29 | WDR5B | 3′ UTR (C > T) | rs189676830 | 3:122424634 |
| Bladder cancer | 7.50 × 10⁻⁸ |
| Intron variant (C > T) | rs572858475 | 3:122389010 | Bladder cancer | 7.50 × 10⁻⁸ | |||
| 3′ UTR (C > T) | rs189676830 | 3:122424634 | Malignant neoplasm of the bladder | 4.40 × 10⁻⁷ | |||
| Intron variant (C > T) | rs572858475 | 3:122389010 | Malignant neoplasm of the bladder | 4.40 × 10⁻⁷ | |||
| 30 | FAM162A | 3′ UTR (C > T) | rs189676830 | 3:122424634 |
| Bladder cancer | 7.50 × 10⁻⁸ |
| Intron variant (C > T) | rs572858475 | 3:122389010 | Bladder cancer | 7.50 × 10⁻⁸ | |||
| 3′ UTR (C > T) | rs189676830 | 3:122424634 | Malignant neoplasm of the bladder | 4.40 × 10⁻⁷ | |||
| Intron variant (C > T) | rs572858475 | 3:122389010 | Malignant neoplasm of the bladder | 4.40 × 10⁻⁷ | |||
| 31 | CCDC58 | 3′ UTR (C > T) | rs189676830 | 3:122424634 |
| Bladder cancer | 7.50 × 10⁻⁸ |
| Intron variant (C > T) | rs572858475 | 3:122389010 | Bladder cancer | 7.50 × 10⁻⁸ | |||
| 3′ UTR (C > T) | rs189676830 | 3:122424634 | Malignant neoplasm of the bladder | 4.40 × 10⁻⁷ | |||
| Intron variant (C > T) | rs572858475 | 3:122389010 | Malignant neoplasm of the bladder | 4.40 × 10⁻⁷ | |||
| 32 | CSTA | 3′ UTR (C > T) | rs189676830 | 3:122424634 |
| Bladder cancer | 7.50 × 10⁻⁸ |
| Intron variant (C > T) | rs572858475 | 3:122389010 | Bladder cancer | 7.50 × 10⁻⁸ | |||
| 3′ UTR (C > T) | rs189676830 | 3:122424634 | Malignant neoplasm of the bladder | 4.40 × 10⁻⁷ | |||
| Intron variant (C > T) | rs572858475 | 3:122389010 | Malignant neoplasm of the bladder | 4.40 × 10⁻⁷ | |||
| 33 | CASR | Missense (G > A/G > T) | rs1801725 | 3:123486447 |
| Colon cancer | 1.98 × 10⁻² |
| Missense (G > A/G > T) | rs1801725 | 3:123486447 | Kidney cancer and urinary organs | 2.16 × 10⁻² | |||
| Missense (G > A/G > T) | rs1801725 | 3:123486447 | Bladder cancer and neoplasms | 2.51 × 10⁻² | |||
| Missense (G > A/G > T) | rs1801725 | 3:123486447 | Cancer of other male genital organs | 2.82 × 10⁻² | |||
| Missense (G > A/G > T) | rs1801725 | 3:123486447 | Bladder cancer and neoplasms | 2.51 × 10⁻² | |||
| Missense (G > A/G > T) | rs1801725 | 3:123486447 | Malignant neoplasm of the kidney and other urinary organs | 3.88 × 10⁻² | |||
| Downstream Gene variant (G > T) | rs879868803 | 3:122291773 |
| Bladder cancer | 9.70 × 10⁻⁸ | ||
| Intron variant (C > T) | rs572858475 | 3:122389010 | Malignant neoplasm of the bladder | 5.40 × 10⁻⁷ | |||
| 34 | CD86 | Intron variant (G > A) | rs9282641 | 3:123279458 |
| Uterine cancer | 4.72 × 10⁻² |
| Intron variant (G > A) | rs9282641 | 3:123279458 | Malignant neoplasm of the renal pelvis | 7.15 × 10⁻³ | |||
| Intron variant (G > A) | rs9282641 | 3:123279458 | Benign neoplasm of the thyroid glands | 7.84 × 10⁻³ | |||
| Intron variant (G > A) | rs9282641 | 3:123279458 | Malignant neoplasm of the brain and nervous system | 4.89 × 10⁻² | |||
| Intergenic variant (C > T) | rs1225678357 | 3:121969387 |
| inflammatory diseases in the breast | 9.20 × 10⁻⁷ | ||
| 35 | SLC15A2 | 3′ UTR (A > C/A > G) | rs4285028 | 3:123143354 |
| Neoplasm of unspecified nature of the digestive system | 2.31 × 10⁻² |
| 3′ UTR (A > C/A > G) | rs4285028 | 3:123143354 | Other benign neoplasms of connective and other soft tissue | 4.12 × 10⁻² | |||
| 3′ UTR (A > C/A > G) | rs4285028 | 3:123143354 | Hepatic cancer, primary | 3.32 × 10⁻² | |||
| 3′ UTR (A > C/A > G) | rs4285028 | 3:123143354 | Other congenital anomalies of the skin | 1.36 × 10⁻² | |||
| 3′ UTR (A > C/A > G) | rs4285028 | 3:123143354 | Congenital anomalies of the urinary system | 2.89 × 10⁻² | |||
| 3′ UTR (A > C/A > G) | rs4285028 | 3:123143354 | Genitourinary congenital anomalies | 3.23 × 10⁻² | |||
| 3′ UTR (A > C/A > G) | rs4285028 | 3:123143354 | Myeloid leukemia | 4.19 × 10− × 10− | |||
| Intron variant (C > G) | rs551291937 | 3:121860679 |
| Non-Hodgkins lymphoma | 1.70 × 10⁻⁷ | ||
| Intron variant (C > G) | rs551291937 | 3:121860679 | Cancer of other lymphoid, histiocytic tissue | 2.80 × 10⁻⁷ | |||
| Splice Donor (T > C) | rs142221393 | 3:121641710 |
| Appendix cancer | 3.19 × 10⁻⁹ | ||
| Intergenic variant (C > T) | rs1225678357 | 3:121969387 |
| Inflammatory diseases in the breast | 9.20 × 10⁻⁷ | ||
| 36 | EAF2 | Intron variant (C > G) | rs551291937 | 3:121860679 |
| Non-Hodgkins lymphoma | 1.70 × 10⁻⁷ |
| Intron variant (C > G) | rs551291937 | 3:121860679 | Cancer of other lymphoid, histiocytic tissue | 2.80 × 10⁻⁷ | |||
| Intergenic variant (C > T) | rs1225678357 | 3:121969387 | Inflammatory diseases in the breast | 9.20 × 10⁻⁷ | |||
| 37 | IQCB1 | Intron variant (C > G) | rs551291937 | 3:121860679 |
| Non-Hodgkins lymphoma | 1.70 × 10⁻⁷ |
| Intron variant (C > G) | rs551291937 | 3:121860679 | Cancer of other lymphoid, histiocytic tissue | 2.80 × 10⁻⁷ | |||
| Intergenic variant (C > T) | rs1225678357 | 3:121969387 | Inflammatory diseases in the breast | 9.20 × 10⁻⁷ |
- —National Cancer Institute10.13039/100000054
- —UTHSC Center for Cancer Research
- —National Institute of Health10.13039/100000002
- —American Association for Cancer Research10.13039/100000043
- —Triple Negative Breast Cancer Foundation Research
- —UTHSC College of Graduate Health Sciences Alma and Hal Reagan
- —UTHSC College of Graduate Health Science Summer Research Scholarship
Peer Reviews
No public reviews on file for this paper yet. If you reviewed it on a platform where reviews are public (OpenReview, ICLR, NeurIPS, ICML), you can paste yours below so the community can read it here.
Videos
No videos yet. Explain this paper in a talk, walkthrough, or lecture? Add one.
Taxonomy
TopicsCancer-related Molecular Pathways · Immunotherapy and Immune Responses · Ubiquitin and proteasome pathways
Introduction
Breast cancer (BC) is a significant global health concern, encompassing a heterogeneous group of malignancies that vary in their molecular characteristics, clinical behavior, and treatment responses. BC is the second most common cause of death in women worldwide (Sung et al. 2021). While deleterious germline mutations in genes including MDM2, NUP107, HER2, BRCA1, and BRCA2 are commonly used in genetic diagnostic tests, known mutations only account for ∼10% of BC cases, emphasizing the complexity and limitations of diagnosis and risk prediction (Cancer Genome Atlas Network 2012; Coignard et al. 2021; Hopper et al. 2024; Li et al. 2024). Triple-negative BC (TNBC) represents around 15% to 20% of all BCs and is associated with aggressive clinical outcomes, such as early recurrence and unique metastatic patterns. TNBC risk factors include obesity, alcohol exposure, and underlying genetics (e.g. BRCA1/2 genes) (da Costa Nunes et al. 2024; Head et al. 2024; Li et al. 2024). There are not yet effective individualized approaches to TNBC prevention or therapeutics. Due to these limitations, patients with TNBC experience elevated recurrence and metastasis and poorer overall survival (OS) relative to patients with other BC subtypes (Kohler et al. 2015; Zagami and Carey 2022; Capuozzo et al. 2024). This challenge can be met by increasing the translatability and power of preclinical models to both define germline modifiers of TNBC and ultimately test the efficacy of interventions.
To identify genetic modifiers of TNBC phenotypes that could improve future risk assessment or advance therapeutics for BC patients, we developed a preclinical model with highly variable and heritable variation in TNBC by crossing 2 well-established murine models—the C3(1)-T-antigen (“C3Tag”) mouse—with the largest fully sequenced family of mice, the BXD (Sasani et al. 2022). The C3Tag strain is a model that resembles the human basal-like TNBC subtype. C3Tag mice recapitulate the common loss-of-function mutations in the tumor suppressor genes retinoblastoma (RB1) and tumor protein 53 (TP53) to induce spontaneous BC tumors (Maroulakou et al. 1994; Herschkowitz et al. 2007, 2008; Cozzo et al. 2016; Usary et al. 2016). We and others have reported that the C3Tag is a highly penetrant model: hemizygotes progressively develop intraepithelial neoplasia after ∼8 weeks, ductal hyperplasia similar to ductal carcinoma in situ (DCIS) by ∼3 months of age, and finally adenocarcinoma by 5 to 6 months of age in 100% of the females (Herschkowitz et al. 2007; Sundaram et al. 2013; Sundaram, Freemerman, et al. 2014; Sundaram, Le, et al. 2014; Cozzo et al. 2016; Qin et al. 2016). To create a novel preclinical BC model, C3Tag mice were intercrossed into the BXD family. The BXD family is the oldest set of recombinant inbred strains of mice (∼120 fully inbred sub-strains) generated starting in the 1970s by crossing C57BL/6J (“B”) and DBA/2J (“D”) strains—ie “BXD” (Williams et al. 2001; Peirce et al. 2004; Ashbrook et al. 2021). In our work, we take advantage of the dominance of the C3Tag variants and crossed male carriers to 28 BXD strains.
Female BXD-BC F1 progeny developed tumors across all mammary glands with high penetrance and variance across F1 hybrids. We evaluated tumor latency, multiplicity, and survival. To identify genetic drivers of these traits in mice, we mapped multiple quantitative trait loci (QTLs) and identified high-priority protein-coding candidates. We exploited publicly available expression-QTL (eQTL) data sets for the BXD family to link phenotypes with genes of interest.
To translate these mouse findings into the human context, we next performed comparative analysis using human phenome-wide association studies (PheWAS) of homologous chromosomal regions. This approach enabled us to prioritize strong candidates, particularly RASSF3, a tumor suppressor that has multiple intron variants linked to BC and that also modulated the expression of 2 other candidate genes—TBC1D30 and GNS. Finally, in BC patients, OS was improved with greater tumor RASSF3, TBC1D30, and GNS combined expression. In sum, using cutting-edge systems genetics in the BXD-BC model, we identified conserved genetic modifiers of BC phenotypic variation that will be examined as potential molecular targets for novel therapeutic approaches or utilized as biomarkers of risk or response to therapy.
Materials and methods
Reagents
All reagents were obtained from Sigma-Aldrich (St. Louis, Missouri, United States) unless otherwise noted.
Animals
Studies were performed in accordance with the guidelines of the Institutional Animal Care and Use Committee (IACUC) at the University of Tennessee Health Science Center (UTHSC, Animal Welfare Assurance Number A3325-01) and following the National Institutes of Health Guide for the Care and Use of Laboratory Animals. All animals were housed in a temperature-controlled facility with a 12 h light/dark cycle and ad libitum access to food and water. Mice were housed at UTHSC in the same animal facility to minimize external impacts. BXD nulliparous females were supplied from the mouse colony of the Center for Integrative and Translational Genomics (CITG). The BXD recombinant inbred family has been studied for decades with each strain inbred for up to 100 generations to become isogenic, reviewed in detail by Ashbrook et al. (2021) The BXD family has been used to identify genes in longevity, vision, development, and behavior (Geisert and Williams 2020; Roy et al. 2021; Morel et al. 2024; Rajan et al. 2025), with this manuscript the first to examine a genetically driven spontaneous tumor intercross. To allow for unbiased genetic variance of breast cancer onset and progression, strains were randomly selected for inclusion in the study generation of F1 hybrids. C3Tag males were obtained from The Jackson Laboratory (FVB-Tg(C3-1-TAg) cJeg/JegJ; RRID: IMSR_JAX:013591). The transgene is maintained on an isogenic FVB/NJ background. The FVB-Tg(C3-1-TAg) founder “c” available from The Jackson Laboratory has 6 copies of the T-antigen transgene, which is an oncogene. Mice were bred as transgenic males and wild-type FVB/NJ females purchased from JAX Labs. All mice were maintained on Teklad diet chow (Envigo 7912). Breeders were not included in the study beyond 12 months of age. Sample size power calculations were carried out using the publicly available BXD power application (Sasani et al. 2022), based on qtlDesign (Sen et al. 2007). C3Tag-BXD F1 hybrids were termed “BXD-BC” followed by the BXD strain ID number. A total of 28 BXD strains were used in this study. The creation of the BXD-BC model is represented in Figs. 1a to c. Figures were created in Biorender under the licenses available https://BioRender.com/m7×5b1w and https://BioRender.com/7qkmpt5.
Novel BXD-BC hybrids were generated by crossing C3Tag mice to various hybrids from the BXD recombinant inbred family that demonstrate variability in latency, endpoint, tumor multiplicity, and tumor mass. a) The schema provided demonstrates how C57BL/6J “B” and DBA/2J “D” parents were crossed (“X”) to create BXD mice. The F2 progeny of each BXD cross were iteratively inbred by sibling mating 20 to 100 times, with an isogenic unique mosaic of B and D alleles labeled as BXD#: BXD1, BXD2…BXD214. The coat colors of the BXD vary as crosses of the B (black) and D (brown) strains. b) C3(1)-T-antigen (“C3Tag”) mice were purchased from The Jackson Laboratory and are well-established models of human basal-like TNBC. The C3Tag is in the FVB/N background, which is a white coat. c) Male mice transgenic for T-antigen were crossed into females of various strains of the BXD recombinant inbred family. C3Tag-BXD F1s breast cancer (BC) models were termed “BXD-BC” followed by the BXD dam's strain number. Tumors develop spontaneously with latency, number, and size of tumors varying both within and between genetic backgrounds (red arrows). d to f) Tumor phenotypes were ranked by mean with individuals represented as data points per mouse. The BXD strain used in each cross is on the x axis. The parent C3Tag FVB/N strain is indicated as “FVB” with an “” asterisk. d) Tumor latency (red circle) and endpoint (blue “x”) are shown with tumor progression defined from age in weeks at latency to endpoint. e) Tumor multiplicity (number of tumors/mouse). f) Tumor weight of all tumors was summed (g) per mouse. “#” denotes F1s with no tumor development after 12 months.*
Tumor latency, progression, and endpoint
The C3Tag mouse was created by Jeff Green at the National Cancer Institute (NCI) using recombinant expression of the simian virus 40 early region transforming sequences under the regulatory control of the rat prostatic steroid binding protein C3(1) gene on the FVB/N background strain (Maroulakou et al. 1994). Latency for female C3Tag in the FVB/N genetic background has a mean of 19 to 20 weeks of age, with tumors arising as early as 11 weeks of age in rare cases depending on the variables tested (Sundaram et al. 2013; Sundaram, Freemerman, et al. 2014; Sundaram, Le, et al. 2014; Cozzo et al. 2016; Qin et al. 2016); thus, palpation for tumors was initiated at 9 weeks of age. BXD-BC mice were palpated across all mammary glands twice weekly since tumors may develop in any mammary gland. Once palpable, tumors were measured by a digital caliper 3 times weekly. The first tumor was called “T1” with subsequent tumors noted as “Tn + 1.” Tumors were allowed to grow until a humane tumor endpoint was reached per IACUC protocol (1 tumor > 2 cm or 3 tumors > 1 cm in diameter). Average tumor burden was calculated as total tumor weight normalized to the total number of tumors (multiplicity) per mouse. Observable TNBC traits were recorded for over 13 phenotypes: age at latency; total tumor volume (mm^3^) at endpoint per mouse; volume, mass, and location of first tumor; total mass of all tumors dissectible (grams) at endpoint per mouse; age at endpoint; survival from latency to endpoint; and location and number of tumors at sacrifice (multiplicity) per mouse.
Endpoint
Mammary tumors were dissected from every mammary gland and weighed. In mice where no palpable tumors were present, the unaffected inguinal fourth mammary gland was isolated. The T1 tumors or mammary glands were divided and flash frozen or formalin (10%) fixed, and paraffin-embedded (FFPE) for histology. All additional tumors were flash frozen and stored at −80 °C until analyzed.
Histology and quantification
T1 tumors or unaffected fourth mammary fat pads were cut at 5 µm thickness. FFPE sections were stained with hematoxylin and eosin (H + E) and scanned by a Panoramic 250 Flash III (Thermo Fisher Scientific, Tewksbury, Massachusetts, United States) scanner in the UTHSC Center for Cancer Research Imaging Shared Resource. Veterinary Pathologist Dr. Robert Read, DVM, blindly scored H + E sections of the tumor and surrounding mammary fat pad adipose tissue for hyperplasia, DCIS, and invasion in accordance with our previous work (Qin et al. 2016). Analysis for each trait was averaged from more than 3 randomly selected regions of interest (ROI) in tumor H and E sections, and a score was generated. Mitosis per high-powered field was quantified as a marker of aggressive tumors. Epithelial to mesenchymal transition (EMT)-type histology was scored from 0 to 4 with areas of no pleomorphism to faint to distinct sarcomatous transition. Vascularity and stromal content were scored from 0 to 5 with areas of no presence to mild to scirrhous presence quantified. The necrosis score was calculated by examining each section and noting none to cavitary tumor loss across a 5-point scale.
Heritability (h2)
Heritability was calculated for measured traits to determine the proportion of phenotypic variance explained by genetic effects, rather than environmental, technical, or stochastic effects. Narrow-sense heritability (h^2^), representing the additive genetic variance component, was estimated as the fraction of variance explained by strain in a one-way ANOVA model (Visscher et al. 2008).
GeneNetwork
Mean values from each hybrid for all collected phenotypes were uploaded to GeneNetwork (GN) for both mapping and to identify candidates using the deep phenome of the BXD family (Zhou and Stephens 2012; Ashbrook et al. 2015, 2019a, 2019b; Ziebarth and Cui 2017; Prins et al. 2019). GN IDs for the project are noted as BXD_2xxxx, with trait dataset IDs noted in Supplementary Table 1.
Quantitative trait loci mapping and definition of significance
The mean value per hybrid was calculated to reduce environmental variations, increasing the ability to detect QTLs. The BXD family has been produced in several “epochs,” using both standard F2 recombinant inbred methods and advanced intercross recombinant inbred methods (Ashbrook et al. 2021), leading to both expected and unexpected kinship between BXD types that can introduce bias. Thus, Genome-wide Efficient Mixed Model Association (GEMMA) was used, a linear mixed model-based method to correct for kinship (Zhou and Stephens 2012), which is accessible on GeneNetwork.org. GEMMA methods use a set of 21,056 markers derived from whole genome sequencing (WGS) of the BXD family with data publicly accessible (Sloan et al. 2016; Ashbrook et al. 2022). GEMMA was used to calculate the strength and location of the QTL, determining the −logP value for each marker and identifying the peak position of the QTL, which corresponds to the marker with the highest −logP value. A −logP of > 4 was defined as genome-wide significant, and >3 as suggestive. To identify genes within the QTL, a 1.5 −logP drop interval was applied around the peak position, providing approximately a 95% confidence interval (Manichaikul et al. 2006). All genes between the first marker before and after this interval were noted as potential candidates. To maximize the potential to detect a biologically significant gene in the QTL identified, the candidate genes were prioritized to include only protein-coding. Previous work has demonstrated that this admittedly biased approach is highly effective (Manichaikul et al. 2006; Sasani et al. 2022).
Cis-expression quantitative trait loci (cis-eQTL) and candidate gene identification
To identify cis-eQTLs, the expression of candidate genes was determined using publicly available BXD transcriptome data in GN in tumor-relevant tissues or cell types (spleen, T-regulatory and T-helper cells) (Alberts et al. 2011; Gibson et al. 2011). A *cis-*eQTL was calculated using GEMMA, defined as an eQTL within a peak ±5 Mb of the cognate gene. Further, to evaluate the significance of the cis-eQTL gene association with tumor traits, the Spearman or Pearson correlation was calculated between the tumor traits and all mRNA assays within the spleen (GeneNetwork (GN)_Accession ID 287), T-regulatory cells (GN_Accession ID 122), and T-helper cells (GN_Accession ID 319). GenomeMUSter was used to identify segregating variants within QTL regions (Ball et al. 2024). Genes within the confidence interval were examined for segregating variants predicted to alter splicing or protein function.
Human phenome-wide association analysis study (PheWAS) translation and survival analysis
Human phenome-wide associations (PheWAS) were conducted using genome-wide association (GWA) summary statistics available online from existing studies to detect gene variants associated with relevant human phenotype associations (e.g. cancer or cancer-associated phenotypes). The human genomic regions syntenic to the mouse QTL were assessed using multiple PheWAS databases including Global Biobank Engine, Gene Atlas, PheWAS Catalog, UK Biobank TOPMed-imputed, Genome-Wide Association Studies (GWAS) Atlas, and BioBank Japan PheWeb (Supplementary Table 2; Denny et al. 2013; Canela-Xandri et al. 2018; Watanabe et al. 2019; Gagliano Taliun et al. 2020; Sakaue et al. 2021). To define the syntenic regions, homologous genes at the start and end of each QTL were defined. The human syntenic region was defined as the start of the first human homologous gene to the end of the last human homologous gene. The web-based survival analysis tool Kaplan–Meier plotter (kmplot.com) database was used to determine the association between OS in basal-like BC patients and RNA-seq candidate gene expression levels (Lanczky and Gyorffy 2021).
Statistics
For mouse and tumor traits, statistical differences between experimental groups were determined using Kaplan–Meier tumor-free survival analysis, One-way or two-way ANOVA, or Student's t-test with Fisher's LSD test for individual comparisons. For body weight, body composition, and tumor volume over time within animals, data were treated as repeated measures. All statistics were performed using statistical software within GraphPad Prism version 10.4.1 (GraphPad Software, Inc., La Jolla, California, United States) or software packages noted and cited above. All data are shown as mean ± standard error of the mean (SEM) unless otherwise noted. KMplot and TNMplot analyses were performed using web-based interfaces (Lanczky and Gyorffy 2021). BXD genetic background ancestry was evaluated using haplotypes from C57BL/6 (B) or DBA2J (D) listed in Supplementary Table 3 across the 28 BXD-BC strains included in this study. For each marker, alleles were coded as B, D, or H (heterozygous). We computed per-chromosome and genome-wide proportions of B and D in R (R Core Team 2023). H markers were handled in 2 ways: split equally between B and D (0.5/0.5) or excluded.
Results
Generation of the BXD-BC genetically engineered mouse model
Our study design is presented as a graphical abstract (Supplementary Fig. 1). Specifically, female BXDs (Fig. 1a) were crossed to C3Tag (Fig. 1b) males to generate BXD-BC females (Fig. 1c). We produced a total of 28 sets of BXD-BC F1 progeny using 28 BXD strains (BXD#/Rww × FVB C3Tag F1), as well as a set of FVB/N “FVB” parent C3Tag cases as a useful comparative baseline of disease severity. We produced an average of 8 hybrids of each F1 type, but with a wide range due to differences in breeding performance (Supplementary Table 4). While most strains met the minimum of 4 to 6 F1 hybrids per strain, the BXD-BC1 strain only generated 2 pups by the study endpoint. However, to maximize coverage and mapping resolution, these 2 hybrids were included in the analyses. While low within-strain replication increases the standard error for that strain mean, it does not bias the effect size estimates or mapping accuracy, provided the genotype is retained. All traits are listed as GeneNetwork (GN) ID in Supplementary Table 1 and are publicly available at GeneNetwork.org (Sasani et al. 2022). In the 28 BXD strains, B (51%) and D (49%) alleles were almost equally covered regardless of heterozygous region (Supplementary Table 3).
BXD-BC tumor phenotypes have significant phenotypic heterogeneity relative to FVB C3Tag mouse
To examine survival as measured by tumor progression, age at latency was recorded along with age at humane (IACUC) endpoint (Fig. 1d). Latency and endpoint varied 1.60- to 1.75-fold from the earliest onset (ie early latency) to the latest onset hybrids (ie delayed latency). The F1s with the earliest latency included BXD-BC161, 66, 29, and 70 with aggressive tumor onset before 18 weeks of age. F1s that displayed delayed latency included BXD-BC44, 210, 113, and 24 hybrids with tumor onset occurring past 23 weeks of age. Absolute progression to endpoint averaged ∼5 weeks but was highly variable, with some hybrids rapidly progressing to endpoint such as BXD-BC90 at 3.06 weeks until endpoint, compared to others which had a much slower progression including BXD-BC154 and BXD-BC24 with progression times as long as 7.79 and 8.39 weeks, respectively. The FVB C3Tag parental strain fell near the median for both latency and endpoint.
Two hybrids were completely resistant to the C3Tag transgene and never developed BC tumors: BXD-BC51 and BXD-BC79. The F1s were maintained for 12 months as per study design to allow for a full year to determine if tumors arose, with palpation twice weekly to attempt to detect tumors. The 12-month endpoint was well past typical C3Tag mean latency in the parental FVB strain. GEMMs develop spontaneous tumors in response to oncogenes, and in the C3Tag with thousands of mice studied, tumor onset typically occurs from as early as 11 weeks of latency to 35 + weeks. No mammary tumors developed in BXD-BC51 and BXD-BC79 as confirmed upon dissection. Mice that did not develop a tumor by 1 year were counted as a zero in tumor traits. Of note, in addition to confirmation of accurate genotyping for the T-antigen transgene, BXD-BC79, and BXD-BC51 hybrids developed other rare tumors reported in the C3Tag parental strain such as rare mixed eccrine sweat gland tumors of the paw (Maroulakou et al. 1994). The fact that the BXD-BC F1 developed other T-antigen-related tumors (paw tumors) demonstrated correct genotyping of the GEMMs. Taken together, all mice in every strain studied developed mammary tumors except all F1 hybrids in these 2 strains. Multiplicity, represented as the total number of tumors per mouse, was quantified at the endpoint and showed significant variance across BXD-BC hybrids (Fig. 1e). The parental FVB C3Tag strain displayed a relatively low mean of 3.17 ± 0.91 tumors per mouse with a range from N = 1 to 7 per mouse (Fig. 1e). The BXD-BC210 F1 females developed the fewest tumors per mouse with a mean of 2.4 ± 0.68 tumors compared to the BXD-BC63 F1 which had 4-fold greater tumor multiplicity, with a mean of 8.8 ± 1.66 tumors per mouse (Fig. 1e). The average coefficient of variation (CV) was 40%, but some progeny had CVs as low as 11% (for BXD-BC1) while C3Tag parental FVB strain had the highest CV of 70% for multiplicity. The variance in CV across strains emphasizes that genetic variants exist which impact the tumor traits to induce variation beyond what is well established in the C3Tag genetically engineered mouse model (GEMM), which spurred our interest to further examine genetic modifiers.
In all hybrids that developed mammary tumors, total tumor mass was quantified by weighing all identified tumors at endpoint (Fig. 1f). Total tumor mass varied 3-fold across BXD-BC F1s ranging from about 1.1 grams per mouse in the BXD-BC66 to 3.3 g in the BXD-BC101. The FVB C3Tag parental strain had a mean total mass of 3.0 g with a range from 2.3 to 4.0 g per mouse. The average CV across all genomes was 42%, but some hybrids displayed a CV as low as 15% for BXD-BC1, while BXD-BC90 had the highest CV of 72%. Average tumor burden calculated as total tumor weight divided by total number of tumors (multiplicity) demonstrated variability across the BXD-BC strains (Supplementary Fig. 2).
Overall, tumor latency, progression multiplicity, mass, and burden demonstrated that germline variants in the BXD hybrids introduced high levels of heritable variation that modulate the onset, progression, and aggression of BC.
Multiple tumor traits display significant heritability in BXD-BC hybrids
The BXD-BC model demonstrated large, heritable variance in multiple tumor traits as demonstrated by calculations for narrow-sense heritability (h^2^) and significance of strain effect. In descending order, age at endpoint (h^2^ = 0.63), age at latency (h^2^ = 0.52), tumor multiplicity (h^2^ = 0.36), and survival (endpoint minus latency, h^2^ = 0.20) revealed robust heritability, with P-values in Table 1. Traits describing the first tumor (T1), including the T1 mammary gland location, T1 tumor weight, T1 tumor volume, and total tumor volume, did not display a significant strain effect (Table 1). Heritability calculations including the 2 BXD-BC hybrids that never developed tumors (BXD-BC51 and BXD-BC79) revealed that survival and age at endpoint are extremely heritable with h^2^ = 0.97 and 0.93, respectively (Supplementary Table 5).
A QTL on chromosome 16 was identified for tumor multiplicity
To identify loci for tumor multiplicity, we mapped QTLs using GEMMA (Wang et al. 2003; Overall et al. 2009; Sasani et al. 2022). For tumor multiplicity, loci were identified depending upon whether all F1 types were used, including the two that never developed tumors and scoring them with zeros (GN ID BXD_ 24403, Fig. 2a), or by dropping these 2 hybrids (GN ID BXD_21528, Fig. 2b). Using all F1s, we defined 3 loci above the suggestive (−logP > 3) threshold on Chr 5 centered at 91.7 to 93.1 Mb, Chr 12 at 116.8 to 119.9 Mb, and Chr 18 at 68.2 Mb. The locus on Chr 12 had the best linkage (−logP = 3.77, Fig. 2a). However, the Chr 12 signal was not reproduced when the 2 tumor-free hybrids were excluded from the analysis. Instead, we defined 4 suggestive loci, two of which overlapped with the above, Chr 5 at 85.2 to 90.4 Mb, Chr 8 at 9.5 to 10.5 Mb, Chr 16 at 36.6 Mb, and Chr 18 at 68.2 Mb, with the highest linkage on Chr 16 (−logP = 4.0, Fig. 2b). Next, all covariate combinations were systematically tested by controlling for 1 locus at a time. Chr 5, 8, and 18 yielded no significant results in conditional analyses. When controlling for the Chr 5 QTL locus, the Chr 16 QTL locus displayed a significant LOD −logP of 4.034 (P = 0.0042, Fig. 2c). Therefore, the Chr 16 locus was prioritized for downstream analyses.
Genome-wide QTL mapping for tumor multiplicity indicated a significant QTL on chromosome 16 with candidate genes relevant in T-helper cells. a to c) Genome-wide QTL plots demonstrate the logarithm of the odds (LOD score) on the y axis across the genome with chromosomes noted below the x axis. a) Variation in tumor multiplicity maps on Chr 5 (peak at 92.8 Mb), Chr 10 (120.6 Mb), Chr 12 (116.78 Mb), and Chr 18 (68.19 Mb), with the QTL on Chr 12 having the highest LOD value (3.12, P = 0.0678). b). Multiplicity in only tumor-bearing hybrids was used to identify QTLs on Chr 5 (86.59 Mb), Chr 8 (10.77 Mb), Chr 16 (36.6 Mb), and Chr 18 (68.2 Mb), with the highest LOD being on Chr 16 (LOD = 3.24, P = 0.12). c) Chr 5 peak marker was included as a covariate revealing a significant QTL on Chr 16 (P = 0.004, LOD 4.0). QTLs are highlighted by black arrows.
Candidate genes for tumor multiplicity on chromosome 16
The QTL 1.5 LOD drop confidence interval at Chr 16: 26.4 to 44.1 Mb contained eighty annotated genes and open reading frames (ORF), 40 of which were protein-coding (Fig. 2c, Supplementary Table 6). Of these, 31 gene variants were predicted to alter protein function or splice regions in 11 genes including Ccdc14, Cd86, Dirc2, Dtx3l, Hspbap1, Mylk, Parp14, Parp9, Sema5b, Slc15a2, and Wdr5b (Supplementary Table 6). Cis-eQTLs were analyzed in several murine cell types or tissues that are specifically relevant to antitumor immunity in existing BXD family publicly available transcriptome datasets in GN: T-helper cells, T-regulatory cells, and spleen. The −logP peak score for each cis-eQTL and correlations between gene expression and tumor multiplicity in the indicated tissue types are reported in Table 2 (GN ID BXD_21528). Notably, the peak associated with QTL expression is at Chr 16: 36.36 Mb. Four protein-coding genes including Slc15a2, Dtx3l, Kiaa0226 (Rubcn), and Zdhhc23 have a significant cis-eQTL within the confidence interval in T cells and/or spleen. Solute carrier family 15 (oligopeptide transporter), member 2 (SLC15A2) is a protein that regulates proton-coupled amino acid transportation and is a novel biomarker in cancer (Yin et al. 2025). RUBCN is a negative regulator of autophagy (Tanaka et al. 2016). Human deltex E3 ubiquitin ligase 3L (DTX3L) is a ubiquitin ligase that complexes with Poly(ADP-ribose) polymerase 9 (PARP9) to ubiquitinate P53 and impact DNA repair (Yan et al. 2023). Zinc finger DHHC-type palmitoyltransferase 23 (ZDHHC23) has protein-cysteine S-palmitoyltransferase activity which is essential to reprogram lipogenesis and maintain homeostasis in T-cell immune responses (Jeong et al. 2023). Among these, Slc15a2 and Dtx3l revealed high −logP scores, particularly in T-regulatory cells (18.52 and 12.19, respectively) and T-helper cells (13.78 and 5.42, respectively) with positive correlation to tumor multiplicity. In the spleen, Kiaa0226 (Rubcn) demonstrated a high −logP score of 12.48 with a significant positive correlation with tumor multiplicity (rho = 0.54, P = 0.017). Dtx3l exhibited a significant positive correlation (rho = 0.9, P = 0.037) with multiplicity in T-helper cells. Conversely, Zdhhc23, with a −logP score of 7.26 in T-helper cells, displayed a significant negative correlation with tumor multiplicity (rho = −0.90, P = 0.037). Taken together, Chr 16 QTL analysis identified 80 candidates narrowed down to 11 genes of interest, with cis-eQTL mapping in immune-relevant tissues highlighting positive (Slc15a2, Dtx3l, and Rubcn) or negative (Zdhhc23) drivers of tumor multiplicity.
Candidate genes for tumor latency on chromosome 10
We next examined tumor latency (GN ID BXD_24402) wherein resistant hybrids that failed to develop a tumor were included in QTL analysis. A significant locus for tumor latency on Chr 10 was identified with a peak at 120.6 Mb (P = 9.4 × 10^−5^, Fig. 3a). The confidence interval extended from 117.3 to 121.5 Mb and included 121 annotated genes, of which 27 were protein-coding (Supplementary Table 7). The eQTL analysis revealed robust gene expression in tissues relevant to antitumor immunity, such as T-helper cells, T-regulatory cells, and spleen (Table 3). Of the 6 protein-coding candidate genes in the Chr 10 QTL, 3 genes were identified with a significant cis-eQTL in at least one of the relevant tissues: Cand1, Tbc1d30, and Rassf3. A correlation matrix of the Chr 10 QTL and eQTL genes identified 5 candidates including Cand1, Lemd3, Tbc1d30, Gns, and Rassf3, revealed strong correlations with each other in at least one of the examined tissues (data not shown). Among these, 3 genes exhibited significant cis-eQTL in the respective antitumor-related tissues: Gns (T-helper cells −logP 5.0), Tbc1d30 (T-regulatory cells −logP 8.65; spleen −logP 9.19), and Rassf3 (spleen −logP 7.2). GNS is a lysosomal enzyme that impacts cancer cell proliferation (Trybus et al. 2023). TBC1 domain family member 30 (TBC1D30, also known as KIAA0984) is a RAB-GTPase-activating protein (Nottingham and Pfeffer 2015). The Ras association domain family member 3 (RASSF3) gene is a member of the subfamily of RAS effectors with inactivation of RASSF family genes in many human tumors (Bovo et al. 2020). GNS and TBC1D30 have predicted impacts on prostate cancer and BC (Mastrangelo et al. 2019; Cheng et al. 2021). Analysis demonstrated that Tbc1d30 and Rassf3 expression in spleen and T-regulatory cells showed positive correlations with tumor latency (Table 3). Interestingly, a positive correlation was evident between Rassf3 expression in spleen and T-helper cells (rho = 0.5, P = 0.013, Fig. 3b). Rassf3 and Tbc1d30 also have a positive correlation to each other in the spleen (rho = 0.47, P = 4.3 × 10^−6^), T-helper cells (rho = 0.434, P = 0.015), and T-regulatory cells (rho = 0.660, P = 2.934 × 10^−5^, Fig. 3c to e). Taken together, the correlation between Tbc1d30 and Rassf3 suggests a potential cis-regulatory role across immune cell types, indicating their possible involvement in shared biological processes. No significant correlation was found with Gns (data not shown) in either spleen, T-helper cells, or T-regulatory cells. Overall, a QTL for tumor latency on Chr 10 identified Tbc1d30 and Rassf3 as key candidate genes with significant cis-eQTLs in immune-related tissues, showing strong positive correlations with each other and with tumor latency, suggesting a shared cis-regulatory role in antitumor immunity.
A significant QTL for tumor latency was identified on chromosome 10. a). QTLs associated with tumor latency (age in weeks) were examined in GEMMA. A QTL is noted with a arrow at 120.6 Mb on Chr 10 (P = 9.4 × 10⁻⁵). b to e) Scatter plots of correlations between Rassf3 and Tbc1d30 in various tissues. Each data point represents the mean gene expression in the noted murine tissue or cell types from a publicly available dataset in GeneNetwork. Data for each mouse is shown as a dot for gene expression, and the correlation line is drawn. b) Rassf3 expression in the spleen (GN ID 10372844, x axis) is positively correlated with Rassf3 in T-helper cells (GN ID 1448547_at, rho = 0.50, P = 1.3 × 10⁻², n = 24. c) Tbc1d30 expression in the spleen (GN ID 10372831, x axis) is positively correlated with Rassf3 expression in the spleen (GN ID 10372844, y axis, rho = 0.48, P = 4.3 × 10⁻⁶, n = 85). d) Tbc1d30 (GN ID 1430607_at, x axis) and Rassf3 (GN ID 1448547_at, y axis) are positively correlated in T-helper cells. Rho = 0.434, P = 1.48 × 10⁻², n = 31. e) Tbc1d30 (GN ID 1430607_at, x axis) and Rassf3 (GN ID 1448547_at, y axis) are positively correlated in T-regulatory (Treg) cells. Rho = 0.660, P = 2.934 × 10⁻⁶, n = 33.
Histological analysis of tumors revealed variability in cancer traits, but heritability was generally low
Mitosis per high-powered field varied from 10 to 80 mitotic nuclei per high-powered field (Supplementary Fig. 3a). EMT was variable across hybrids with means ranging from 1 to 2.7 in each F1 (Supplementary Fig. 3b). Vascularity and stromal content was only moderately variable across hybrids although most tumors displayed a score of 2 on average (Supplementary Fig. 3c). Likewise, tumor necrosis was also moderately variable across hybrids with a mean of 2.4 (Supplementary Fig. 3d). Heritability was calculated for each histologic phenotype quantified. The highest heritability was for mitosis per high-powered field and vascularity and stroma with an h^2^ of 0.34 and 0.33, respectively; however, analysis did not reveal any significant strain effect for histologic traits (Supplementary Table 8).
Gene variants and eQTL analysis identified 2 significant QTL associated with histologic traits
The necrosis score (GN BXD_27515) revealed a significant QTL on Chr 4 with a LOD score of 5.86 and a peak position at Chr 4 105.2 Mb, and a QTL interval at 103.64 to 105.24 Mb (Supplementary Fig. 4a). Further focusing on the 1.5 LOD drop confidence QTL interval, 3,219 gene variants were identified including 23 annotated genes and 6 of which are protein-coding genes including Dab1, C8b, C8a, Fyb2, Plpp3, and Prkaa2 (Supplementary Fig. 4b and Supplementary Table 9). The stroma and vascularity score (GN BXD_27514) identified a locus on Chr 12 with a LOD of 5.12 and a peak at 67 to 68.6 Mb and a confidence interval 64.4 and 69.6 Mb, containing 3,752 sequence variants and 172 annotated genes, 43 of which are protein-coding genes (Supplementary Fig. 4d and Supplementary Table 10). Notably, no significant cis-eQTL gene variants were identified in either region under the conditions analyzed.
Joint mouse–human phenome-wide association study (PheWAS) analysis revealed syntenic regions of interest
The translational validity of the candidate genes was tested based on PheWAS studies in humans including diseases such as BC. The loci on Chr 16 and Chr 10 identified in the BXD-BC model are syntenic to human Chr 3 and Chr 12 regions, respectively (Table 4). Several PheWAS databases (Supplementary Table 2) were evaluated to identify single-nucleotide variants (SNV) associated with cancer phenotypes and their closest genes. The type of variants was included based on predicted functional consequences, and missense variants with a significant P-value < 0.05 (Table 5). Gene variants without any association with cancer-related phenotypes were ignored.
From the genes identified in the Chr 16 QTL associated with tumor multiplicity, PheWAS analysis in the UK Biobank and Biobank Japan databases did not identify specific significant gene variants per se that associated with a specific BC phenotype (Canela-Xandri et al. 2018; Sakaue et al. 2021). However, an interesting intergenic variant located between SLC15A2 and ILDR1 (C > T, rs1225678357) was found to alter the function of 5 genes (KPNA1, CD86, ILDR1, SLC15A2, and EAF2) in “inflammatory disease of the breast” (P = 9.2 × 10^−7^). Similarly, PheWAS analysis identified variants associated with other cancers. Two gene variants that co-regulated bladder cancer phenotypes in humans were identified. A KPNA1 missense variant (C > T, rs189676830) located at the 3′ UTR region at Chr 3 122.424 Mb, and FAM162A intron variant (C > T, rs572858475) at Chr 3:122.389 Mb impacted 6 proximal genes (KPNA1, WRD5B, FAM162A, CCDC58, CSTA, and CASR), which associated with “malignant neoplasm of bladder” (P = 4.40 × 10^−7^) and “bladder cancer” (P = 7.5 × 10^−8^). Interestingly, a poly(ADP-ribose) polymerase family member 15 (PARP15) missense variant (A > G, rs753177428) with altered protein structure is associated with a “malignant neoplasm of an unknown kind” (P = 3.10 × 10^−6^) and influences DTX3L and a nearby gene critical to DNA repair, PARP9 (Supplementary Fig. 5a). Additionally, 2 genes IQCB1 and SLC15A2 identified through cis-eQTL analysis were found to be affected by an IAF2 intron variant (C > G, rs551291937) involved in “non-Hodgkins lymphoma” (P = 1.70 × 10^−7^) and “cancer of other lymphoid, histiocytic tissue” (P = 2.80 × 10^−7^).
The 3 genes identified in the Chr 10 QTL associated with BXD-BC tumor latency found on human Chr 12 (TBC1D30, GNS, and RASSF3) displayed significant associations with human prostate cancer and BC (Table 5). Notably, the RASSF3 intron missense variant (T > C, rs7968403) exhibited significant associations with cancers of the prostate (P = 1.2 × 10^−19^) and breast (P = 4.3 × 10^−6^). Additionally, 2 other missense variants (C > T, rs7313651, and A > GT > C, rs1245183) within the RASSF3 intron region were linked to “breast cancer” (P = 5.10 × 10^−5^) and “prostate cancer” (P = 1.8 × 10^−17^), which impacted the expression of nearby GNS and TBC1D30 genes, respectively (Supplementary Fig. 5b). Furthermore, 2 additional SLC35E3 intron variants (G > A, rs7304105 and C > T, rs74705899) exhibited significant associations with “breast cancer” (P = 4.2 × 10^−10^), affecting CPM, MDM2, and NUP107 gene expression. Interestingly, variants noted in SLC35E3, which are associated with BC and impacted MDM2 and NUP107 gene expression, were of specific interest because of recent work using transcriptome-wide association study (TWAS) analysis in African American females (Li et al. 2024; Ping et al. 2024). Lastly, an intragenic variant at human Chr 12:66, located between HMGA2 and LLPH (T > C, rs147746198), was found to alter gene expression of IAK3, TMBIM4, and LLPH in prostate hyperplasia (P = 9.10 × 10^−7^, Table 5). In sum, conserved genes were identified using the BXD-BC preclinical model that aligned with gene variants that impact BC and other cancer or cancer-associated phenotypes.
Candidate analysis in patients demonstrated combined GNS, RASSF3, and TBC1D30 expression associated with significantly reduced breast cancer patient survival
Analysis of GNS, RASSF3, and TBC1D30 in the RNA-seq database using the web-based analysis tool KMplotter (Gyorffy 2024a,b) demonstrated that greater expression of the 3 genes combined (Fig. 4a) and notably TBC1D30 (Fig. 4b) revealed significantly poorer OS in BC patients. Using the TNMplot web-based tool (Bartha and Gyorffy 2021), Mann–Whitney analysis of TBC1D30 in normal or tumor tissue across 15,648 normal, 40,442 tumor, and 848 metastasis unique patient samples in 22 cancer types revealed that TBC1D30 expression was significantly higher in tumor samples compared to normal tissue in several cancer types including breast, while expression was lower in other cancer types (Fig. 4c). In sum, pan-cancer expression analysis demonstrated that TBC1D30 was a tumor associated candidate for future studies.
*GNS, RASSF3, and TBC1D30 are associated with poor BC patient overall survival. a and b) Overall survival probability in BC patients is graphed for tumors with expression of GNS, RASSF3, and TBC1D30 combined (a) or only for TBC1D30 (b) with high expression compared to low expression using the KmPlotter webserver and breast RNA-seq data. Hazard ratio (HR) and log-rank P-values are 1.49 and P = 0.00071 (a) and 1.68 and P = 0.0000046 (b). A total of N = 2,976 breast cancer patients are included for a and b. c) Differential RNA-seq gene expression pan-cancer analysis on the TNMplot webserver in normal, tumor, or metastatic samples from patients indicates normal (left, thin outline) or tumor (right, thick outline) gene expression with asterisk indicating significance by Mann–Whitney analysis (P < 0.01). Patient sample data include normal (15,648), tumor (40,442), and metastatic (848) tissue. Tumor types are shown for AML (acute myeloid leukemia), Esoph (esophageal), AC (adenocarcinoma), SC (squamous carcinoma), CC (cell carcinoma), CH (chromophobe), PA (papillary), CS (carcinosarcoma), and EC (endometrial cancer).
Discussion
Understanding specific genetic modifiers and molecular mechanisms that drive BC tumor aggressiveness will improve our understanding and treatment of the disease. Genetic modifiers of BC development may interact directly with cancer-initiating genes (ie p53 and RB), influence cancer cell intrinsic mechanisms of DNA repair or cell cycle regulation, or impact response to cancer cells by the tumor microenvironment such as angiogenesis or antitumor immunity to variably impact patient outcomes. The study presented was designed to determine the interaction of modifiers and causal genes in governing the heterogeneity of BC phenotypes in a preclinical model. Previous work by our group using the C3Tag TNBC model demonstrated that pregnancy, obesity, overweight, and weight loss impacted preneoplastic lesions (hyperplasia and DCIS) as well as cancer burden, progression, and response to therapy (Sundaram et al. 2013; Sundaram, Freemerman, et al. 2014; Sundaram, Le, et al. 2014; Cozzo et al. 2016; Qin et al. 2016). The C3Tag GEMM was enhanced herein by crossing it to the highly genetically diverse BXD family to aid in the discovery of genetic modifiers.
A novel model was created, the BXD-BC, which demonstrates heritable variation in multiple breast tumor phenotypes. Average tumor burden was reduced compared to the parent strain across all BXD-BC strains suggesting that the genetic variance introduced by intercrosses with various BXD strains affected both total tumor mass and multiplicity. Compared to novel BXD-BC F1, the parent C3Tag in the FVB strain displayed above-average latency and burden but lower survival and multiplicity which demonstrated that crosses into the BXD strains modulate susceptibility even in a GEMM. Thus, despite C3(1) Tag being a highly penetrant transgenically driven model, the cross to the BXD strains introduced variation, which has allowed for the identification of genetic variants. The intercross generated BXD-BC F1s with demonstrated accelerated tumor onset (i.e. mice with younger latency) or delayed tumor onset (i.e. older latency). Therefore, future studies using extremes of latency may aid in identifying the molecular underpinnings of pathways associated with BC traits. The most highly heritable traits were latency, endpoint, and multiplicity. When F1s from the 2 hybrids did not develop tumors, even when the mice were aged out until 1 year, survival became the greatest heritable trait. How the BXD-BC51 and BXD-BC79 F1 failed to present with mammary tumors is under investigation. Significant QTLs were identified in the BXD-BC F1 based on traits including tumor multiplicity and latency as well as histological qualities including the necrosis or the stroma and vascularity scores.
First, genetic modifiers of tumor multiplicity were examined, and the highest LOD was identified on Chr 16 after covariate analysis. Within the Chr 16 QTL interval, cis-eQTL analysis identified 4 candidate genes—Slc15a2, Dtx3l, Rubcn, and Zdhhc23—with expression in immune-related tissues and cells correlating positively or negatively with tumor multiplicity, suggesting complex regulatory mechanisms. PheWAS associations further support the relevance of SLC15A2, DTX3L, and ZDHHC23 in inflammation, DNA repair, and immune regulation, highlighting their potential roles in tumorigenesis. In sum, identification of 4 candidate genes associated with tumor multiplicity in the BXD-BC hybrids lends strength to this novel model given the links of the identified genes with previously identified variants in antitumor immunity, DNA repair, and human cancer-associated phenotypes.
In contrast to the many QTLs identified with tumor multiplicity, 1 significant QTL was identified on Chr 10 for tumor latency containing prioritized candidates Gns, Tbc1d30, and Rassf3. Functional evidence supports their roles: GNS, a lysosomal enzyme, influences cancer cell proliferation; RASSF3, a RAS effector, is frequently inactivated in tumors; and TBC1D30, a RAB-GTPase activator, interacts with ERα and is predicted to mediate tamoxifen- or fulvestrant-resistance in BC leading to poor outcomes (Vogel et al. 2015; Nassa et al. 2019; Selinger et al. 2022). Survival analyses showed that elevated TBC1D30, alone or in combination with GNS and RASSF3, correlated with reduced overall BC patient survival. Notably, TBC1D30 is broadly overexpressed in tumors compared with normal tissue. Cross-species GWAS studies of mammals, including goats, sheep, and pigs, Matrangelo et al. and Bovo et al. demonstrated that all 3 genes of interest (GNS, TBC1D30, and RASSF3) were found in QTLs associated with fat deposition (or obesity) (Kudo et al. 2012; Donninger et al. 2016; Dhanaraman et al. 2020). Obesity is established to lead to 13 cancers and is strongly associated with worse outcomes and increased mortality (Lam et al. 2024). In sum, this novel BXD-BC hybrid model enabled the identification of 3 candidate genes associated with tumor latency which are also associated with prostate cancer and BC in humans and obesity across multiple species.
In summary, we evaluated 13 clinically relevant cancer phenotypes across the BXD-BC GEMMs, such as measures of tumor onset, multiplicity, burden, and survival. Among these, latency and multiplicity showed the highest heritability, with significant QTLs identified. Within these loci, we highlighted Gns, Tbc1d30, and Rassf3 as poor prognostic markers supported by eQTL and PheWAS analyses. These phenotypes, together with their associated genetic drivers, provide a multidimensional framework for leveraging recombinant inbred GEMMs to dissect genetic modifiers of BC and explore mechanistic parallels with human BC. A limitation to be noted is that all of this work has been accomplished with a single GEMM. Using additional models such as the collaborative cross or diversity outbred families would complement this work (Chesler 2014; Abu Toamih Atamni et al. 2018). Another limitation is that we did not complete an extensive comparison of the parent GEMM to the various strains for histologic and genomic alterations. Indeed, future genomic work would include analyses on histologic traits, transcriptomic profiles, and global genomic alterations such as copy number changes in BXD-BC GEMMs that will elucidate therapeutic markers. Exploring additional developmental or pathway-related genes aside from cancer, as well as long noncoding RNAs and other non-protein-coding elements, may also hold promise for advancing our understanding and treatment strategies. Developmental genes or those affecting pathways tangentially linked to tumor biology (e.g. cell adhesion, immune regulation, and metabolism) may also play important roles. Our initial prioritization strategy emphasized known cancer genes to highlight clear translational relevance; however, we recognize the possibility to exponentially expand our focus (e.g. mitochondria, immunity, metabolism, developmental, and response to environment) to find interactions to cause phenotypes related to cancer. Lastly, in future studies, we aim to take advantage of this BXD GEMM to eventually examine both prostate and TNBC to look for commonalities such as androgen signaling. We and others have identified androgen receptor (AR), splice variants, and signaling in luminal androgen receptor (LAR) BC subtype which could be further dissected in the BXD-BC or prostate cancer model (Li et al. 2022; Asemota et al. 2023; Fernandez et al. 2023).
In conclusion, this report describes the novel BXD-BC model, wherein multiple QTLs and eQTLs were identified, which yielded candidate genes of interest associated with significantly heritable tumor traits. Candidate genes were demonstrated to be conserved in cancer or cancer-related phenotypes in PheWAS studies. Future work is necessary to further validate candidate genes as novel therapeutic targets to improve TNBC outcomes.
Supplementary Material
jkaf238_Supplementary_Data
The reference list from the paper itself. Each links out to its DOI / PubMed record.
- 1Abu Toamih Atamni H, Nashef A, Iraqi FA. 2018. The collaborative cross mouse model for dissecting genetic susceptibility to infectious diseases. Mamm Genome. 29:471–487. 10.1007/s 00335-018-9768-1.30143822 · doi ↗ · pubmed ↗
- 2Alberts R et al 2011. Expression QTL mapping in regulatory and helper T cells from the BXD family of strains reveals novel cell-specific genes, gene-gene interactions and candidate genes for auto-immune disease. BMC Genomics. 12:610. 10.1186/1471-2164-12-610.22182475 PMC 3277499 · doi ↗ · pubmed ↗
- 3Asemota S et al 2023. Identification of a targetable JAK-STAT enriched androgen receptor and androgen receptor splice variant positive triple-negative breast cancer subtype. Cell Rep. 42:113461. 10.1016/j.celrep.2023.113461.37979170 PMC 10872270 · doi ↗ · pubmed ↗
- 4Ashbrook D et al The expanded BXD family of mice: A cohort for experimental systems genetics and precision medicine. bio Rxiv 672097. 10.1101/672097, 8 July 2019 a, preprint: not peer reviewed. · doi ↗
- 5Ashbrook DG et al 2021. A platform for experimental precision medicine: the extended BXD mouse family. Cell Syst. 12:235–247.e 9. 10.1016/j.cels.2020.12.002.33472028 PMC 7979527 · doi ↗ · pubmed ↗
- 6Ashbrook DG, Cahill S, Hager R. 2019 b. A cross-species systems genetics analysis links APBB 1IP as a candidate for schizophrenia and prepulse inhibition. Front Behav Neurosci. 13:266. 10.3389/fnbeh.2019.00266.31920576 PMC 6914690 · doi ↗ · pubmed ↗
- 7Ashbrook DG et al Private and sub-family specific mutations of founder haplotypes in the BXD family reveal phenotypic consequences relevant to health and disease. bio Rxiv 489063. 10.1101/2022.04.21.489063, 21 April 2022, preprint: not peer reviewed. · doi ↗
- 8Ashbrook DG, Williams RW, Lu L, Hager R. 2015. A cross-species genetic analysis identifies candidate genes for mouse anxiety and human bipolar disorder. Front Behav Neurosci. 9:171. 10.3389/fnbeh.2015.00171.26190982 PMC 4486840 · doi ↗ · pubmed ↗