Cross-disease transcriptomic meta-analysis and network pharmacology reveal key therapeutic targets in rheumatoid arthritis, systemic lupus erythematosus and multiple sclerosis
K. Lakshmi, Sundararajan Vino

TL;DR
This study identifies key genes and potential drug targets for three autoimmune diseases using transcriptomic data and network analysis.
Contribution
The study combines cross-disease transcriptomic meta-analysis and network pharmacology to discover shared therapeutic targets in RA, SLE, and MS.
Findings
341 differentially expressed genes were identified, including 8 hub genes linked to autoimmune diseases.
Molecular docking and simulations suggest natural compounds and immunomodulatory drugs as potential therapies.
Hub genes were found to interact with 198 transcription factors and 993 microRNAs, highlighting regulatory networks.
Abstract
Autoimmune disease has a complex etiology that remains not fully understood. We aimed to identify highly perturbed DEGs and hub genes associated with autoimmune disease Rheumatoid Arthritis (RA), Systemic Lupus Erythematosus (SLE) and Multiple Sclerosis (MS). To find potentially lead to more effective therapies that target the root causes of these diseases. Datasets for autoimmune diseases (RA, SLE, and MS) were collected from the GEO database. Differentially expressed genes were identified and subjected to meta-analysis to obtain common DEGs, which were then used for functional enrichment analysis GO and pathway analysis. A PPI network was constructed, and topology-based ranking identified hub genes. These hub genes were further analyzed through regulatory network analysis (TF and miRNA), gene-disease association studies, and drug-gene interaction analysis. Finally, molecular docking…
Genes, proteins, chemicals, diseases, species, mutations and cell lines named across the full text — each resolved to its canonical identifier and authoritative record.
Click any figure to enlarge with its caption.
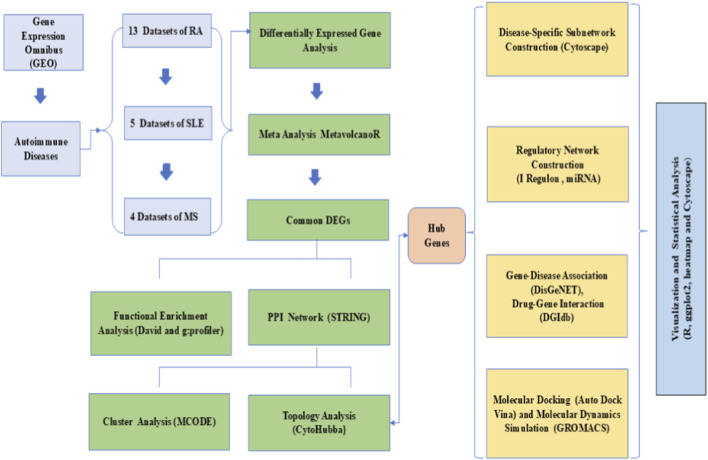 FIGURE 1
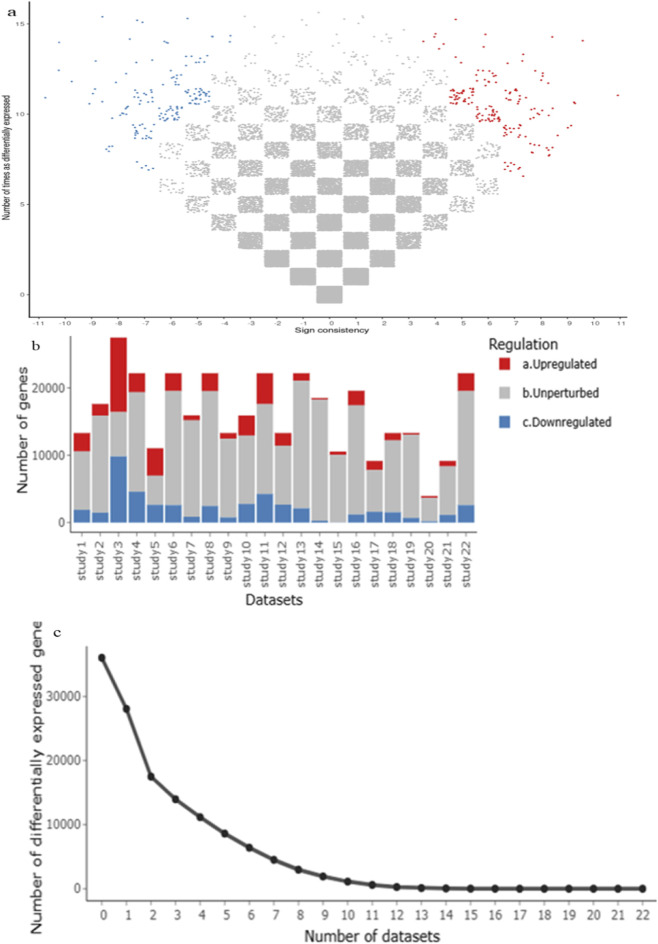 FIGURE 2
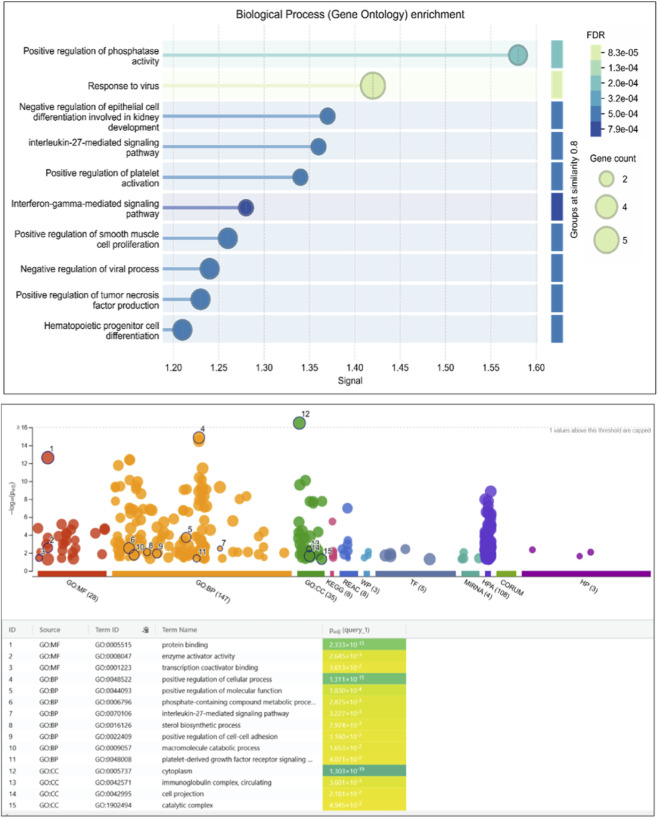 FIGURE 3
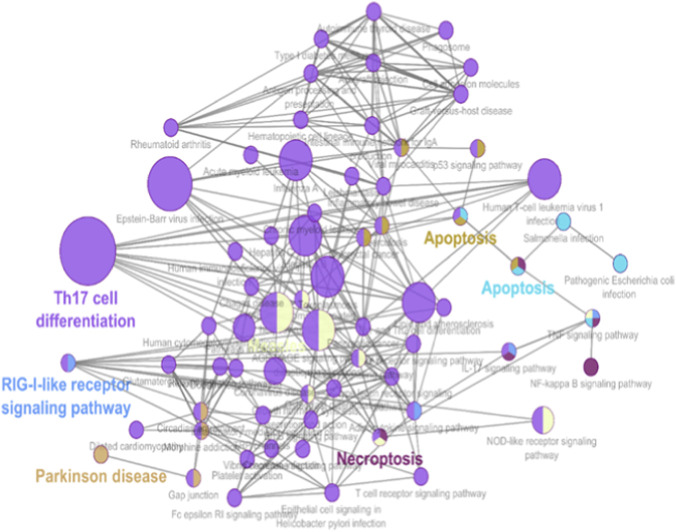 FIGURE 4
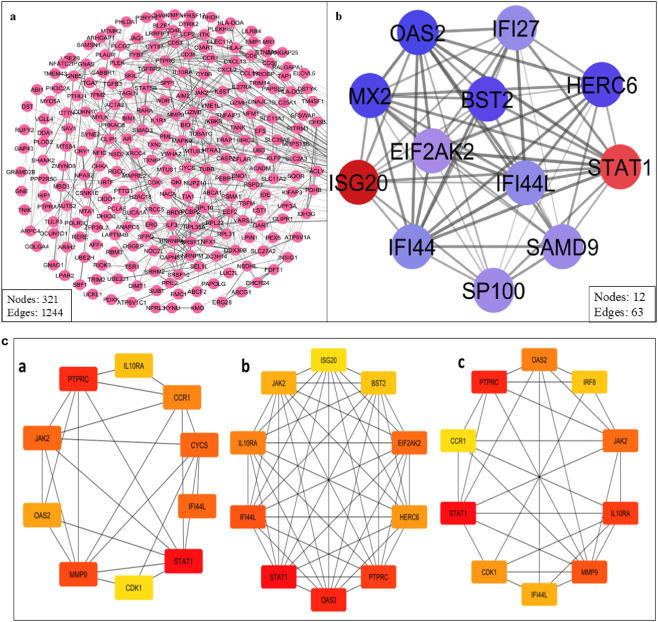 FIGURE 5
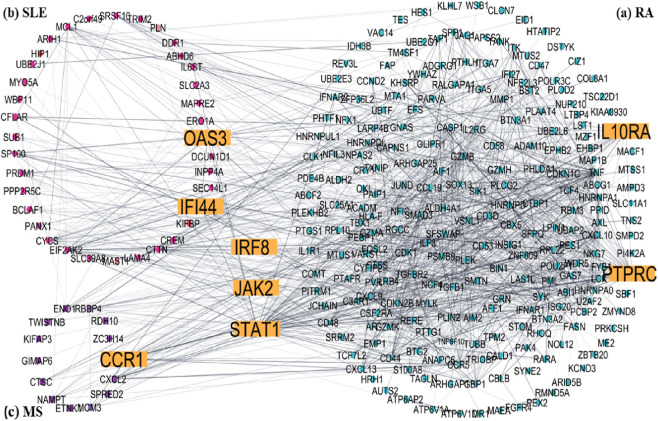 FIGURE 6
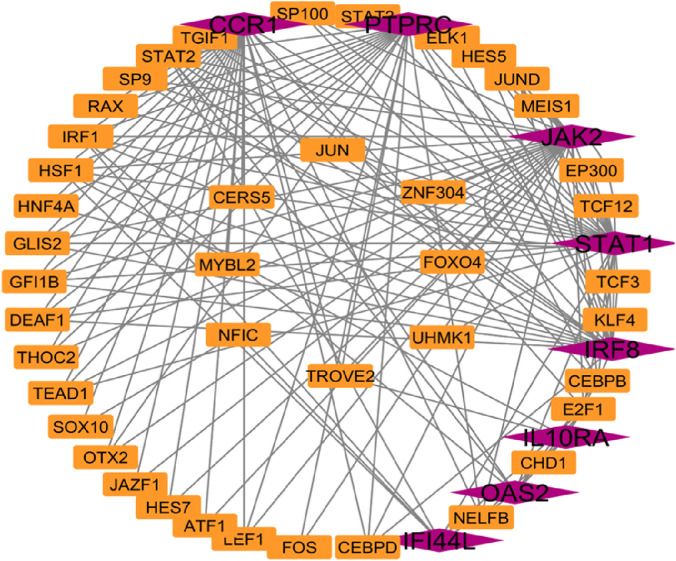 FIGURE 7
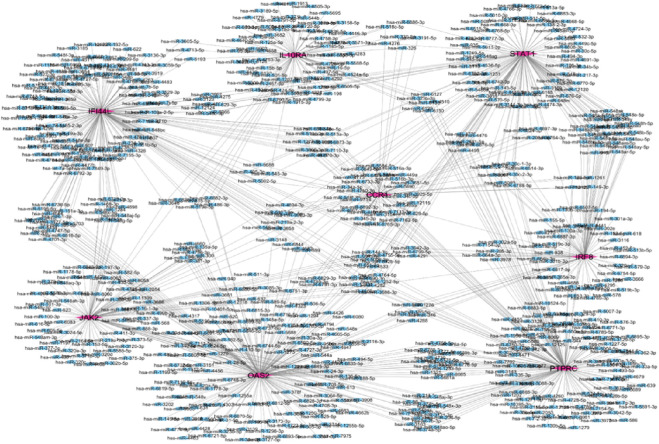 FIGURE 8
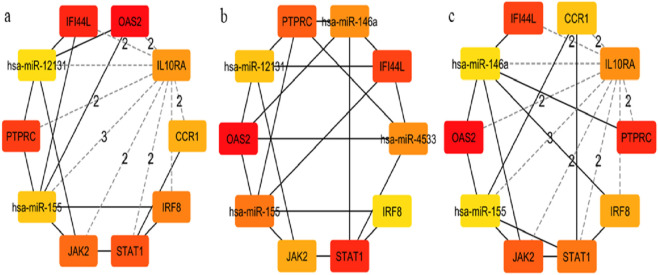 FIGURE 9
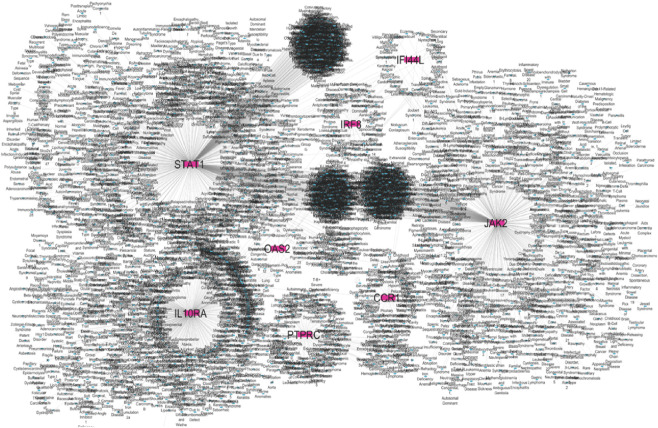 FIGURE 10
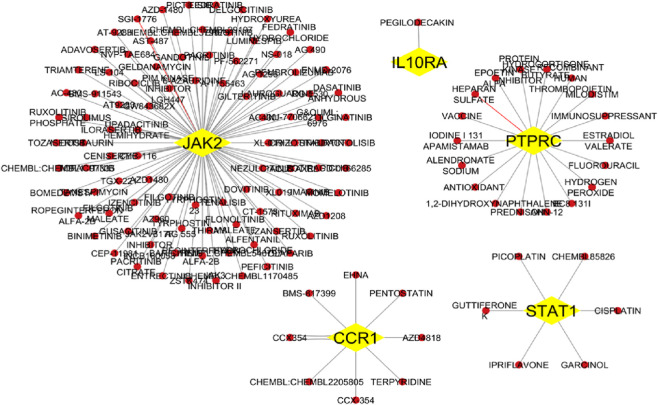 FIGURE 11
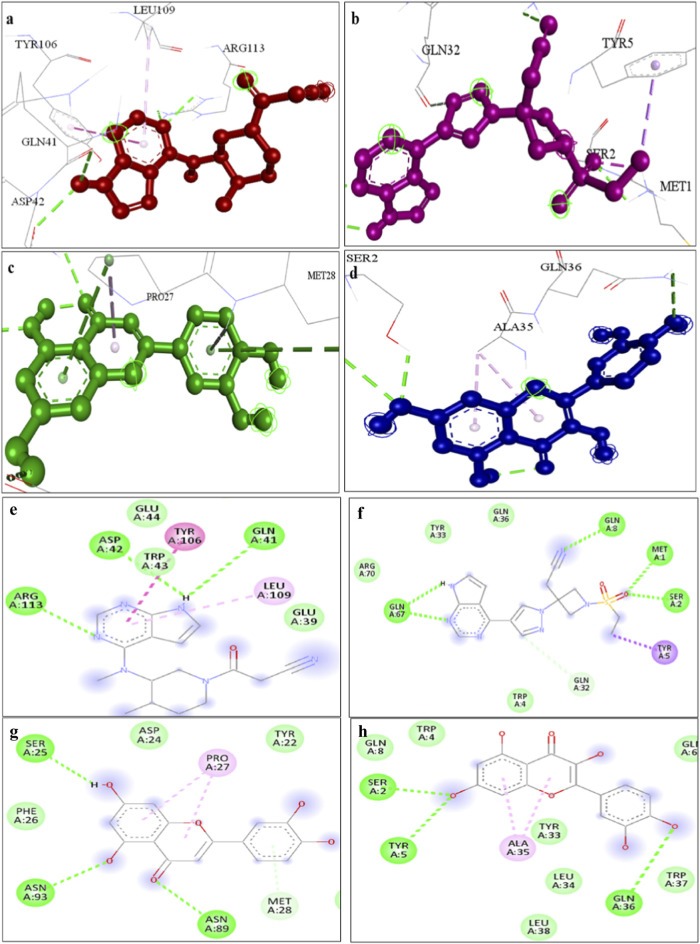 FIGURE 12
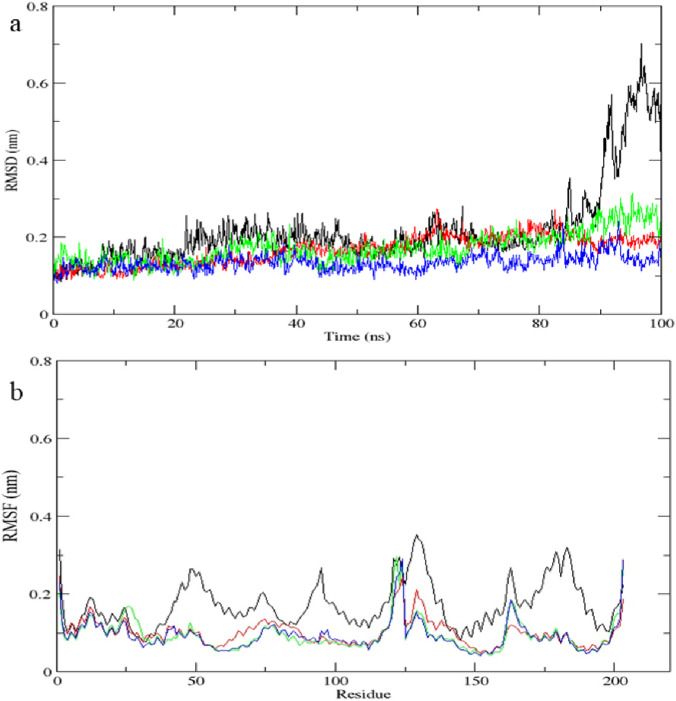 FIGURE 13
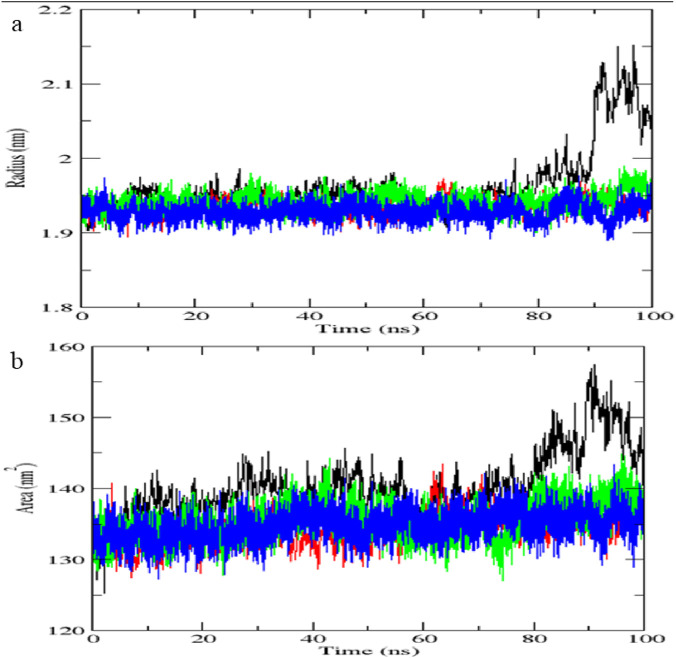 FIGURE 14
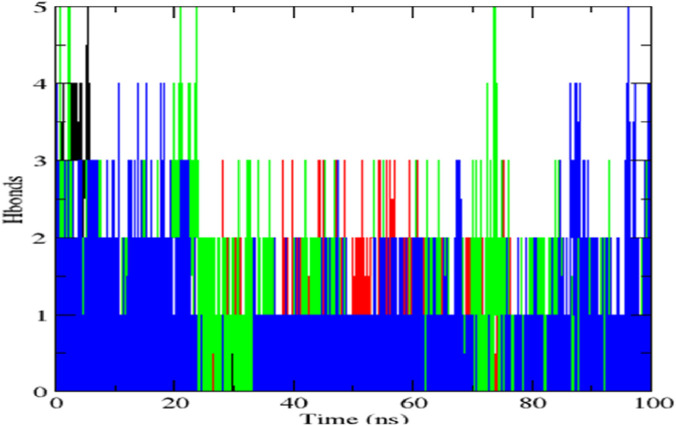 FIGURE 15
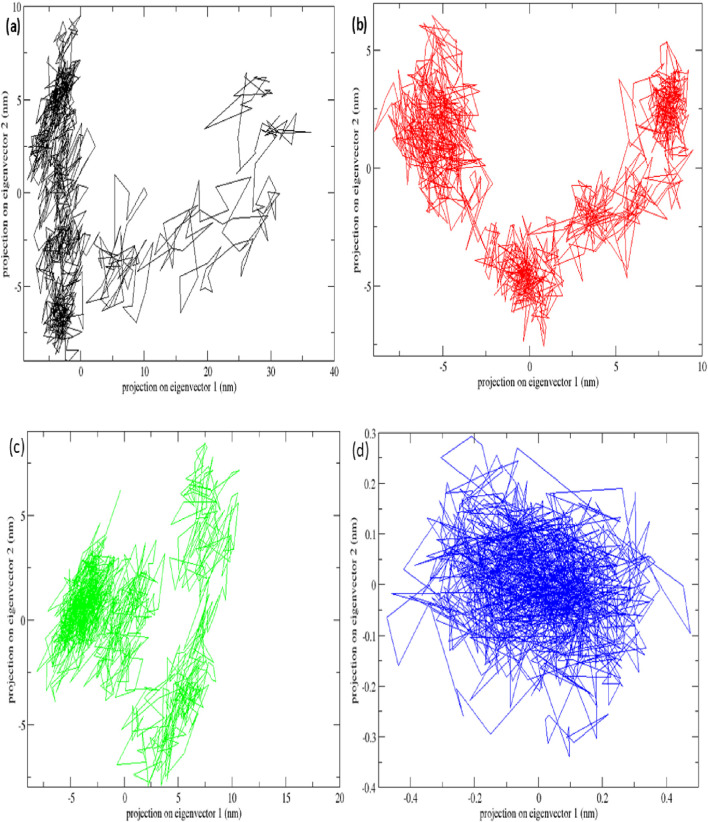 FIGURE 16
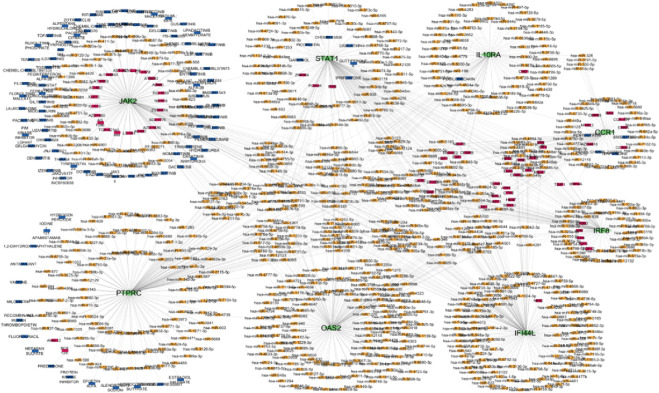 FIGURE 17
| Process step | Tools/database | Parameters | Software version |
|---|---|---|---|
| Differential expression gene | GEO2R, Limma | p-value <0.05 and logFC value >1 | R.4.5.1 |
| Meta analysis | MetavolcanoR | p-value <0.05 and logFC value >1 | R 4.5.1 |
| Functional enrichment analysis | DAVID and g: Profiler. | p-value <0.05 |
|
| PPI network and MCODE clusters. | STRING database, cytoscape | Confidence score >0.40 | 11.5 |
| Hub gene identification | Cytoscape (CytoHubba) | Degree, closeness, MCC | 3.10.2 |
| Disease-specific subnetwork | STRING database, cytoscape | Confidence score >0.40 | 3.10.2 |
| Regulatory network (TF) | iRegulon (TF), cytoscape | FDR ≤ 0.0010. | 1.3 |
| Regulatory network (miRNA) | miRDB, cytoscape | Score >80 | 3.10.2 |
| Gene-disease association | DisGeNET cytoscape | Confidence score >0.40 | 3.10.2 |
| Drug-gene interaction | DGIdb | Confidence score >0.40 | 3.10.2 |
| S. No | Accession ID | Disease | Platform | Sample type control/Disease | Reference |
|---|---|---|---|---|---|
| 1. | RA | Affymetrix human genome U133A array | Tissue; 10/13 | PMID: 24690414 | |
| 2. | RA | Affymetrix human genome U133A array | Tissue; 10/10 | PMID: 24690414 | |
| 3. | RA | Illumina human-6 v2.0 expression beadchip | Blood; 18/15 | PMID: 19710928 | |
| 4. | RA | Affymetrix human genome U95A array | Tissue; 5/10 | PMID: 20858714 | |
| 5. | RA | Affymetrix human genome U133 array | Tissue; 4/7 | PMID: 25927832 | |
| 6. | RA | Illumina NovaSeq 6000 | Tissue; 6/6 | PMID: 38137409 | |
| 7. | RA | Illumina HiSeq 2000 | Tissue; 28/151 | PMID: 28455435 | |
| 8. | RA | Hitachisoft AceGene human oligo chip 30K 1 chip version | Blood; 112/45 | PMID: 28863153 | |
| 9. | RA | Affymetrix human genome U133A/B array | Tissue; 12/9 | PMID: 18721452 | |
| 10. | RA | Affymetrix human genome U133 plus 2.0 array | Tissue; 16/7 | PMID: 26711533 | |
| 11. | RA | Agilent-026652 whole human genome microarray 4 × 44K v2 | Blood; 7/5 | PMID: 29584756 | |
| 12. | RA | Affymetrix human genome U133 plus 2.0 array | Blood; 78/43 | PMID: 30013029 | |
| 13. | RA | SABiosciences innate and adaptive immune responses PCR array | Blood; 40/20 | PMID: 22238028 | |
| 14. | SLE | Affymetrix human genome U133 plus 2.0 array | Blood; 6/4 | PMID: 24391825 | |
| 15. | SLE | Affymetrix human genome U133A 2.0 array | Skin; 13/25 | PMID: 23771123 | |
| 16. | SLE | Affymetrix human genome U133 plus 2.0 array | Blood; 9/17 | PMID: 21886837 | |
| 17. | SLE | Affymetrix human genome U133 plus 2.0 array | Blood; 9/10 | PMID: 19201859 | |
| 18. | SLE | Affymetrix human genome U133A array | Blood; 28/39 | PMID: 18275831 | |
| 19. | MS | Affymetrix human genome U133 plus 2.0 array | Blood; 15/12 | PMID: 22021740 | |
| 20. | MS | Affymetrix human genome U133 plus 2.0 array | Blood; 14/6 | PMID: 22491253 | |
| 21. | MS | Affymetrix human gene 1.0 ST array | Blood; 4/8 | PMID: 21346816 | |
| 22. | MS | Affymetrix human genome U133 plus 2.0 array | Blood; 8/8 | PMID: 21216829 |
| S. No | Degree | Closeness | MCC |
|---|---|---|---|
| 1. |
|
|
|
| 2. |
|
|
|
| 3. |
|
|
|
| 4. |
|
|
|
| 5. |
|
|
|
| 6. |
|
|
|
| 7. |
|
|
|
| 8. |
|
|
|
| 9. |
|
|
|
| 10. |
|
|
|
| S. No | Degree | Closeness | Betweenness |
|---|---|---|---|
| 1 |
|
|
|
| 2 |
|
|
|
| 3 |
|
|
|
| 4 |
|
|
|
| 5 |
| hsa-miR-155 |
|
| 6 |
|
|
|
| 7 |
|
|
|
| 8 |
| hsa-miR-12131 |
|
| 9 | hsa-miR-155 | hsa-miR-4533 | hsa-miR-155RF |
| 10 | hsa-miR-12131 |
| hsa-miR-146a |
| S. No |
| Binding affinity (kcal/mol) | H-bond interaction | Other interactions |
|---|---|---|---|---|
| 1. | Baricitinib | −7.2 | Asp 42, Gln 41, Arg 113 | Tyr 106, Leu 109 |
| 2. | Tofacitinib | −5.6 | Met 1, Ser 2, Gln 8, Gln 67 | Tyr 5 |
| 3. | Luteolin | −9.1 | Ser25, Asn 93, Asn89 | Pro 27 |
| 4. | Quercetin | −7.8 | Ser 2, Tyr 5, Gln 36 | Ala 35 |
| S. No | Ligand | MW g/mol | HBD | HBA | Log p (<5) | TPSA Å2 | nrotb | nViol |
|---|---|---|---|---|---|---|---|---|
| 1. | Baricitinib | 286.24 | 4 | 6 | 1.86 | 111.13 | 1 | 0 |
| 2. | Tofacitinib | 371.4 | 1 | 7 | 1.38 | 128.94 | 5 | 0 |
| 3. | Luteolin | 312.37 | 1 | 4 | 1.70 | 88.91 | 4 | 0 |
| 4. | Quercetin | 302.24 | 5 | 7 | 1.63 | 131.36 | 1 | 0 |
| Protein-ligand complex | ΔVDWaals (kJ/mol) | ΔEEL (kJ/mol) | ΔGGAS (kJ/mol) | ΔGSOLV (kJ/mol) | ΔG Total (kJ/mol) |
|---|---|---|---|---|---|
|
| −6.16 | −6.07 | −12.23 | 8.43 | −3.8 |
|
| −16.32 | −11.55 | −27.87 | 20.49 | −7.38 |
|
| −26.18 | −18.54 | −45.43 | 27.43 | −18 |
|
| −15.4 | −6.17 | −21.57 | 12.82 | −8.72 |
Peer Reviews
No public reviews on file for this paper yet. If you reviewed it on a platform where reviews are public (OpenReview, ICLR, NeurIPS, ICML), you can paste yours below so the community can read it here.
Videos
No videos yet. Explain this paper in a talk, walkthrough, or lecture? Add one.
Taxonomy
TopicsRheumatoid Arthritis Research and Therapies · Bioinformatics and Genomic Networks · Systemic Lupus Erythematosus Research
Introduction
Autoimmune diseases (AIDs) such as rheumatoid arthritis (RA), systemic lupus erythematosus (SLE), and multiple sclerosis (MS) are chronic, multifactorial conditions characterized by immune system dysregulation and sustained inflammation. Although these diseases exhibit distinct clinical manifestations. RA primarily affects synovial joints, SLE involves multi-organ damage, and MS targets the central nervous system, they share overlapping pathogenic mechanisms including the activation of innate and adaptive immune responses, cytokine overproduction, and autoantibody formation (Song et al., 2025; Frazzei et al., 2022; Marrie et al., 2015). Recent transcriptomic evidence highlights the involvement of type I interferon (IFN-I) signaling as a central immune modulator across these autoimmune conditions (Rose et al., 2013; Lerkvaleekul et al., 2022; Guo M. et al., 2024).
Siglec-1 (sialic acid-binding Ig-like lectin-1, CD169), a monocyte/macrophage-specific surface receptor, is a well-characterized IFN-I-inducible gene (Macauley et al., 2014; Brzezicka and Paulson, 2023; Biesen et al., 2008). Unlike most other Siglecs, Siglec-1 lacks immunoreceptor tyrosine-based inhibitory motifs (ITIMs), but mediates key immunomodulatory functions via adhesion and endocytic roles (Macauley et al., 2014; Zheng et al., 2015). Elevated Siglec-1 expression has been reported in RA, SLE, and MS patients and correlates strongly with clinical activity indices such as DAS28 and SLEDAI, as well as with biomarkers including CRP and anti-dsDNA antibodies (Xiong et al., 2014; Lim et al., 2018; Oliveira et al., 2018; Biesen et al., 2008; Stuckrad et al., 2020). In MS, Siglec-1-positive myeloid cells are enriched in active brain lesions, implicating their role in acute neuroinflammation (Ostendorf et al., 2021).
Given the central role of IFN-I and its downstream effectors in AID pathogenesis, there is an urgent need to identify convergent transcriptomic signatures and molecular drivers that transcend individual disease boundaries. While prior studies have investigated DEGs within isolated disease contexts, few have integrated gene expression profiles across RA, SLE, and MS in a unified systems biology framework (De Silva et al., 2022; Cheng et al., 2024; Sun et al., 2014).
In the present study, we performed a large-scale meta-analysis (Table 1) of publicly available transcriptomic datasets to identify differentially expressed genes shared across RA, SLE, and MS. The overall workflow is depicted in Figure 1. Functional enrichment analyses, protein-protein interaction (PPI) network construction, transcription factor and microRNA regulatory mapping, and drug-gene interaction analyses were performed to characterize core molecular networks. We also used molecular docking and dynamics simulation to validate the draggability of selected hub proteins, comparing natural compound interactions to known immunomodulatory drugs. Our findings highlight several key immune regulators, including STAT1, JAK2, and OAS2 as potential therapeutic targets, alongside Siglec-1, providing a comprehensive resource for the development of broad-spectrum therapeutics in autoimmune disease management.
Overall workflow of the study.
Methodology
Data acquisition
We retrieved gene expression datasets for RA, SLE, and MS from the Gene Expression Omnibus (GEO), focusing on human studies that included both disease and control samples (Table 2). Inclusion criteria ensured consistent platform technologies (Affymetrix, Illumina), normalized data, and a minimum of 10 samples per group to ensure statistical robustness. GEO serves as a valuable resource for unbiased data mining and disease comparison across multiple conditions (Barrett et al., 2013).
Meta-analysis of gene expression
Differentially expressed genes (DEGs) for each dataset were identified using GEO2R, followed by integration using the MetavolcanoR package in R. This approach incorporates both p-values and fold-change data, generating consensus DEG lists across diseases. We applied a vote-counting method to accommodate inter-study variability. Genes were filtered using an adjusted p-value <0.05 and logFC value >1. This step enhances detection of consistent transcriptional changes across independent studies and increases the power to identify biologically relevant genes (Rau et al., 2014).
Functional enrichment analysis
Common Differentially expressed gene were subjected to Gene Ontology (GO) and Kyoto Encyclopedia of Genes and Genomes (KEGG) enrichment analyses using DAVID and g: Profiler (version e113_eg59_p19_f6a03c19; https://biit.cs.ut.ee/gprofiler/gost). These tools identify overrepresented biological processes, molecular functions, and pathways such as interferon signaling and cytokine-mediated immune responses. Enrichment analysis contextualizes gene lists within established immunological frameworks (Huang da et al., 2009; Raudvere et al., 2019).
Protein-protein interaction network and hub gene identification
Using the STRING database, we constructed high-confidence protein-protein interaction (PPI) networks of the DEGs. Cytoscape was employed to visualize these interactions. Hub genes were identified using CytoHubba (degree, MCC, and closeness centrality algorithms), while MCODE was used to detect densely connected clusters. Hub genes often represent master regulators or potential drug targets within disease-relevant networks (Szklarczyk et al., 2019; Chin et al., 2014).
Disease-specific subnetwork construction
We constructed separate subnetworks for RA, SLE, and MS using disease-specific DEG lists. These were analyzed using STRING and visualized with Cytoscape to compare topological properties and key nodes. This step allowed us to detect both disease-specific regulators and shared molecular patterns across AIDs. Network metrics such as degree distribution, centrality, and clustering coefficient were compared to distinguish condition-specific versus overlapping hubs (Caldera et al., 2017).
Regulatory network construction
We mapped transcription factors (TFs) and microRNAs (miRNAs) targeting the identified hub genes using Network Analyst, integrating data from iRegulon (TF) and miRDB (miRNA). Constructing these networks helped infer upstream regulatory mechanisms modulating autoimmune-related gene expression. These interactions reveal regulatory hierarchies and offer further therapeutic targeting options (Janky et al., 2014; Chen and Wang, 2020).
Gene-disease association and drug-gene interaction
Gene-disease associations were retrieved from DisGeNET to validate the pathological relevance of identified hub genes. Drug-gene interaction predictions were sourced from DGIdb. Genes with known interactions with approved or investigational drugs were flagged as druggable targets. This integration aids in repurposing existing compounds and informs future therapeutic strategies (Piñero et al., 2020; Freshour et al., 2021).
Molecular docking
We selected representative hub genes for in silico docking studies. Protein structures were downloaded from the Protein Data Bank (PDB), and ligands (including baricitinib, tofacitinib, luteolin, and quercetin) were sourced from PubChem. Auto Dock Vina (version 1.5.7) was used to compute binding affinities and pose predictions. Docking results were analyzed for binding energy and interaction residues. This approach provides an initial screen for potential therapeutic efficacy (Trott and Olson, 2010).
Molecular dynamics simulation
The top-scoring protein-ligand complexes were subjected to 100 ns molecular dynamics (MD) simulations using GROMACS version software (2024). Simulations were conducted under standard physiological conditions. Root mean square deviation (RMSD), root mean square fluctuation (RMSF), and hydrogen bond stability were calculated to assess structural stability and binding retention. MD simulations validate docking predictions by modeling dynamic behaviour of biomolecular interactions (Abraham et al., 2015).
Visualization and statistical analysis
Gene expression volcano plots, PPI, TF-miRNA regulatory, and drug interaction networks were visualized using R (ggplot2) and Cytoscape. All statistical analyses were performed in R, with a significance threshold set at p < 0.05. Data visualization facilitates intuitive understanding of complex results and highlights biologically significant patterns (Shannon et al., 2003; R Core Team, 2023).
Results
Identification of differentially expressed genes
A comprehensive meta-analysis across multiple GEO datasets for RA, SLE, and MS revealed 341 commonly dysregulated genes (Supplementary File). Of these, 172 genes were significantly upregulated and 169 were downregulated across all three disease conditions (Supplementary File). This high overlap underscores shared immune-inflammatory molecular signatures and validates the meta-analysis approach. The volcano plots (Figure 2a) illustrate consistent up- and downregulation across studies, while bar plots (Figures 2b,c) summarize gene counts per category. Notably, several DEGs such as STAT1, OAS2, and IFI44L appeared repeatedly across datasets, pointing to their conserved roles in autoimmune activation.
(a–c) A meta-analysis using the MetaVolcanoR package (vote-counting method) used to identify highly perturbed differentially expressed genes (DEGs), with upregulated genes shown in red and downregulate genes in blue.
Functional enrichment highlights interferon and cytokine signaling
GO and KEGG enrichment analyses were performed to determine the biological relevance of the 341 DEGs. These genes were highly enriched in biological processes related to immune system activation. Specifically, GO terms like “type I interferon signaling pathway,” “response to virus,” and “cytokine-mediated signaling” (Figure 3 and Supplementary File) dominated the enrichment profiles. KEGG analysis highlighted three major pathways: Toll-like receptor signaling, Jak-STAT signaling, and cytokine-cytokine receptor interaction, all of which are known to contribute to AID progression (Figure 4 and Supplementary File). These findings align with known IFN-I dysregulation in RA, SLE, and MS pathogenesis.
GO enrichment analysis of the common DEGs. Molecular function, biological processes, cellular component.
Pathway analysis KEGG pathways common DEGs.
Protein-protein interaction (PPI) network analysis and hub gene selection
The STRING database was used to create a high-confidence (Figure 5a) PPI network of the common DEGs. This network was visualized and further analyzed in Cytoscape to identify (Figure 5b) densely connected nodes using MCODE, and topologically important genes using CytoHubba. Eight genes were identified as hubs: STAT1, PTPRC, IRF8, JAK2, IL10RA, OAS2, CCR1, and IFI44L (Table 3; Figure 5c). These genes showed the highest degree and MCC scores, suggesting central regulatory roles. Several of these, such as STAT1 and IRF8, are known interferon-responsive transcription factors, while IL10RA and CCR1 represent key signaling receptors.
(a) PPI network of the common DEGs. (b) Cluster highly densely connected node. (c) The topological analyses of the PPI Network (a) Degree (b) MCC and (c) Closeness.
Disease-specific subnetwork insights
To understand disease-specific molecular patterns, DEG lists for RA, SLE, and MS were analyzed independently to construct condition-specific subnetworks (Figure 6). The RA subnetwork (Figure 6a) emphasized synovial inflammation genes such as JAK2, IL10RA, and TNFSF10. The SLE subnetwork (Figure 6b) revealed strong enrichment of IFN-stimulated genes including IFI44L and OAS2, reflecting the known IFN-I signature in lupus. The MS subnetwork (Figure 6c) was dominated by STAT1 and CCR1, consistent with their involvement in neuroinflammation. Comparative analysis confirmed that STAT1, JAK2, and IRF8 were central across all subnetworks, underscoring their potential as pan-autoimmune therapeutic targets.
Disease-specific subnetworks construct of common DEGs Hub genes are yellow colour (a) RA, (b) SLE and (c) MS.
Transcription factor and miRNA regulatory networks
Network Analyst was used to construct TF and miRNA interaction maps for the hub genes. Transcriptional regulation by IRF1, STAT2, and NF-κB was prominent, as seen in Figure 7, Supplementary File. These TFs are known to regulate immune and interferon genes. Additionally, microRNAs such as miR-155 and miR-146a were identified as key post-transcriptional regulators (Figures 8, 9 Table 4 and Supplementary File). These miRNAs are highly conserved across species and frequently implicated in autoimmune regulation, offering additional therapeutic entry points.
Transcription factors network analysis Hub genes are represent in pink colour and transcription factors are represented in orange colour.
Hub gene and miRNA network the purple color represent hub genes and blue color represent in miRNA.
Hub-miRNA Network through topological analysis (a) Degree, (b) Closeness, (c) MCC used CytoHubba plugin to Cytoscape.
Gene-disease and drug interaction network findings
DisGeNET confirmed the direct association of hub genes with RA, SLE, and MS, validating their disease relevance (Figure 10 and Supplementary File). DGIdb revealed that multiple hub genes were targeted by existing immunomodulatory drugs. For example, JAK2 was associated with JAK inhibitors (baricitinib, tofacitinib), while natural compounds like luteolin and quercetin showed strong binding predictions for OAS2 and STAT1 (Figure 11 and Supplementary File). These interactions suggest potential for repurposing approved drugs or combining them with nutraceuticals for improved autoimmune therapy.
Gene–disease association hub genes are represented in pink colour and diseases are represented in blue colour.
Drug-gene interaction network analysis hub gene are yellow colour and drugs are red colour.
Molecular docking indicates high affinity interactions
Molecular docking simulations were conducted using Auto Dock Vina. Among the compounds tested, luteolin exhibited the highest binding affinity to STAT1 (−9.1 kcal/mol), while quercetin bound strongly to OAS2 (−8.7 kcal/mol) (Table 5). Drug likeness properties of the ligands are presented in Table 6. These interactions involved key residues in the DNA-binding and SH2 domains, critical for protein activation. Figure 12 illustrates both the 3D and 2D interaction maps, highlighting multiple hydrogen bonds and hydrophobic interactions that contribute to stability. These findings suggest luteolin and quercetin as promising lead compounds.
A representation of 3D interaction analysis of quercetin the top first docked complexes. Interaction of (a) Tofacitinib (b) Baricitinib, (c) Luteolin, (d) Quercetin with STAT1 protein and 2D interaction of (e) Tofacitinib (f) Baricitinib, (g) Luteolin, (h) Quercetin with STAT1 protein.
Molecular dynamics simulation validates complex stability
The STAT1-luteolin complex was subjected to a 100 ns molecular dynamics simulation in GROMACS. RMSD and RMSF analysis (Figure 13) confirmed structural stability of the complex, with minimal fluctuations. The radius of gyration (Figure 14) and solvent-accessible surface area profiles remained consistent throughout the simulation. Hydrogen bond analysis (Figure 15) showed sustained interactions. Principal component analysis (Figure 16) baricitinib, tofacitinib complex occupies a large space and luteolin, quercetin complex occupies lesser space and MM-PBSA calculations (Table 7) yielded a total binding energy of −45.4 kcal/mol. Together, these metrics validate the stability and potential efficacy of luteolin as an inhibitor of STAT1.
Molecular dynamics simulation results of complex native protein STAT1 with ligand complex with Tofacitinib (black), complex baricitinib (red), complex luteolin (green), and complex Quercetin (blue). (a) Time-dependent RMSD of c-a backbone (b) The RMSF of c-a atoms.
(a) Radius of gyration vs. time. (b) SASA vs. time.
Hydrogen bonds formation vs. time.
Principal component analysis plots of all four complexes and STAT1 protein with (a) complex Baricitinib (black), (b) complex Tofacitinib (red), (c) complex luteolin (green) and (d) complex quercetin (blue).
Visualization of multi-layered network results
Integrated visualization was performed to synthesize results from differential expression, PPI, regulatory, and drug interaction analyses, displayed consistent expression patterns of hub genes across diseases. A unified network (Figure 17) was constructed to show interactions among TFs, miRNAs, hub genes, and drugs. This systems-level perspective highlights convergence on a few central regulators, supporting their prioritization as universal autoimmune targets.
Multi layered network hub genes green colour, miRNA orange colour, TF pink colour, drugs blue colour.
Discussion
In the present investigation, we undertook a combined systems biology approach to decipher the common molecular characteristics of Rheumatoid Arthritis (RA), Systemic Lupus Erythematosus (SLE), and Multiple Sclerosis (MS). Although these diseases manifest in distinct physiological systems joints, systemic organs, and the central nervous system we hypothesized that they share a fundamental biological origin. By integrating transcriptomic data across these conditions, we successfully identified shared pathogenic drivers and prioritized novel therapeutic targets.
We observed that despite the heterogeneity in clinical presentation, these diseases converge on a highly conserved immune-inflammatory signature. Our pathway analysis clearly indicates that the Type I Interferon (IFN-I) and JAK-STAT signalling pathways are the primary engines driving this shared pathogenesis. This observation is in strong agreement with recent studies; for instance, Shen and You (2025) recently demonstrated that RA and SLE share significant immune regulatory genes like IFIT3 and TNFSF13B, which are directly linked to Type I interferon signalling. Furthermore, Naveed et al. (2025) reported that shared genetic linkages in autoimmune diseases frequently cluster around these specific inflammatory cascades, validating our findings.
An interesting observation in our study concerns Siglec-1. While we initially noted Siglec-1 as a biomarker for interferon activity (York et al., 2007), it did not appear as a top hub gene in our network. This does not imply that Siglec-1 is insignificant; rather, it suggests that our computational method successfully prioritized the “master regulators” upstream drivers like STAT1 over the “downstream products” biomarkers. Consequently, we identified eight key hub genes: STAT1, PTPRC, IRF8, JAK2, IL10RA, OAS2, CCR1, and IFI44L. Among these, we selected STAT1 as the most critical drug target due to its centrality in the protein-protein interaction network.
A major finding of our study is the identification of Luteolin, a natural phytocompound, as a potent inhibitor of STAT1. We performed molecular docking studies to compare Luteolin with standard FDA-approved drugs. The results were highly encouraging. We found that Luteolin showed a binding affinity of −9.1 kcal/mol, which is significantly superior to the commercially available drugs baricitinib (−7.2 kcal/mol) and tofacitinib (−5.6 kcal/mol). This finding is supported by recent literature; Nadalin et al. (2024), Xia et al. (2016) experimentally proved that Luteolin alleviates apoptosis and inflammation by directly inhibiting the JAK/STAT signalling pathway (Ren et al., 2024; Guo F. et al., 2024). Additionally, Frontiers in Immunology (2025) published a review highlighting that flavonoids like Luteolin effectively modulate macrophage polarization and block NF-κB and JAK-STAT signals in metabolic and autoimmune disorders (Wang et al., 2025).
To further validate this, we ran a 100 ns molecular dynamics simulation. The complex remained stable throughout the simulation period, confirming that Luteolin can effectively bind and block the STAT1 pathway. This aligns with the work of Peng et al. (2024), who reported that Luteolin significantly reduces the secretion of pro-inflammatory factors such as TNF-α and IL-6, further proving its efficacy as an immunomodulator.
It is also noteworthy that while the diseases share a common core, they retain unique characteristics. We observed that the RA network was enriched with genes for joint inflammation, SLE showed a strong interferon signature, and MS emphasized neuroinflammation. This supports the common core, unique periphery model, suggesting that while broad-spectrum agents (like Luteolin) can target the shared STAT1 core, disease-specific therapies are still necessary for unique symptoms.
We acknowledge that the present study has certain limitations. Since this is an in silico work, the findings need to be validated through in vitro and in vivo experiments. However, the alignment of our results with the recent wet-lab findings of Ren et al. (2024) and Shen and You (2025) gives us high confidence in our predictions.
In conclusion, our study provides strong evidence that RA, SLE, and MS share a common molecular mechanism driven by STAT1 and Interferon signalling. We have demonstrated that Luteolin has excellent potential as a lead molecule to target STAT1, showing better theoretical efficacy than some existing synthetic drugs. These findings pave the way for developing cost-effective, broad-spectrum therapeutics for autoimmune diseases.
Conclusion
Our meta-analysis of transcriptome data from patients with RA, MS, and SLE identified a core set of common differentially expressed genes. Through functional enrichment analysis, we narrowed this list to eight key hub genes: STAT1, CCR1, JAK2, IRF8, OAS2, IFI44L, IL10RA, and PTPRC. These genes are central to the shared pathology of these diseases, and our study also explored their complex regulatory networks. To investigate their therapeutic potential, we performed molecular docking and dynamics simulations. Interestingly, this analysis showed that the natural compounds Luteolin and Quercetin are strong candidates for new treatments, performing comparably to established drugs such as baricitinib and tofacitinib. The clear takeaway is that these eight genes are valuable clinical targets, offering a new direction for developing targeted therapies for these autoimmune conditions.
The reference list from the paper itself. Each links out to its DOI / PubMed record.
- 1Abraham M. J. Murtola T. Schulz R. Páll S. Jeremy C. Hess B. (2010). GROMACS: high performance molecular simulations through multi-level parallelism from laptops to supercomputers. Software X 1, 19–25. 10.1016/j.softx.2015.06.001 · doi ↗
- 2Barrett T. Wilhite S. E. Ledoux P. Evangelista C. Kim I. F. Tomashevsky M. (2013). NCBI GEO: archive for functional genomics data sets--update. Nucleic Acids Res. 41, 991–995. 10.1093/nar/gks 1193 23193258 PMC 3531084 · doi ↗ · pubmed ↗
- 3Biesen R. Demir C. Barkhudarova F. Joachim R. G. Marta S. Z. Backhaus M. (2008). Sialic acid-binding Ig-like lectin 1 expression in inflammatory and resident monocytes is a potential biomarker for monitoring disease activity and success of therapy in systemic lupus erythematosus. Arthritis Rheum. 58 (2), 456–465. 18383365 10.1002/art.23404 · doi ↗ · pubmed ↗
- 4Brzezicka K. A. Paulson J. C. (2023). Impact of Siglecs on autoimmune diseases. Mol. Asp. Med. 90, 101140. 10.1016/j.mam.2022.101140 36055802 PMC 9905255 · doi ↗ · pubmed ↗
- 5Caldera M. Felix M. Kaltenbrunner I. Licciardello M. P. Lardeau C.-H. Kubicek S. (2017). Mapping the perturbome network of cellular perturbations. Nat. Commun. 10, 5140. 10.1038/s 41467-019-13058-9 PMC 685394131723137 · doi ↗ · pubmed ↗
- 6Chen Y. Wang X. (2020). mi RDB: an online database for prediction of functional micro RNA targets. Nuc. Acid. Res. 48 (D 1), D 127–D 131. 10.1093/nar/gkz 757 31504780 PMC 6943051 · doi ↗ · pubmed ↗
- 7Cheng X. Meng X. Chen R. Song Z. Li S. Wei S. (2024). Molecular subtypes and gene signatures in autoimmune disease. Comput. Struct. Biotechnol. J. 23, 1348–1363. 10.1016/j.csbj.2024.03.026 38596313 PMC 11001648 · doi ↗ · pubmed ↗
- 8Chin C. H. Chen S.-H. Wu H.-H. Ho C.-H. Ko M.-T. Lin C.-Y. (2014). cyto Hubba: identifying hub objects and sub-networks from complex interactome. BMC Sys. Biol. 8 (Suppl 4), S 11. 10.1186/1752-0509-8-S 4-S 11 25521941 PMC 4290687 · doi ↗ · pubmed ↗