Effectiveness and Safety of Image-Guided Renal Biopsies: Insights from 5,235 Procedures in the German Society for Interventional Radiology and Minimally Invasive Therapy (DeGIR) Registry
R. Ocker-Serger, M. Opitz, L. Klüner, D. Rosok, M. Drews, Y. Thal, M. Forsting, J. Haubold, J. Nadjiri, B. M. Schaarschmidt, S. Zensen

TL;DR
This study shows that image-guided kidney biopsies are highly effective and safe, with ultrasound guidance being linked to fewer complications.
Contribution
The study provides the largest multicenter registry analysis of image-guided renal biopsies, highlighting safety and diagnostic yield.
Findings
Technical success rate was 98.38% and diagnostic yield was 94.92% across 5,235 procedures.
Ultrasound-guided biopsies had lower complication rates compared to CT-guided procedures.
Abstract
This study evaluates the technical success, diagnostic yield, and complication rates of image-guided percutaneous renal biopsies based on multicenter registry data from the German Society for Interventional Radiology and Minimally Invasive Therapy. This retrospective analysis included 5,235 renal biopsies at 176 centers in Germany, Austria, and Switzerland between 2018 and 2024. Technical success was defined as image-guided confirmed needle placement within the target lesion. Diagnostic yield is defined as proportion of procedures providing adequate samples for clinical diagnosis. CT was used for image guidance in 78.53% followed by ultrasound in 12.32%. Technical success was 98.38% and diagnostic yield 94.92%. Technical success was high in both inpatients (98.33%) and outpatients (99.26%; OR = 0.44, 95%CI 0.11–1,80; p = 0.241). The overall complication rate was 5.04%, with major…
Genes, proteins, chemicals, diseases, species, mutations and cell lines named across the full text — each resolved to its canonical identifier and authoritative record.
Click any figure to enlarge with its caption.
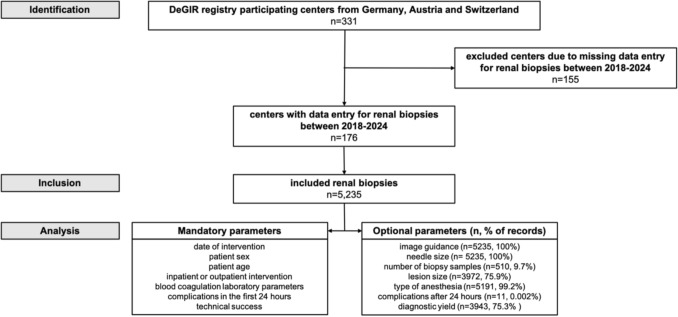 Figure 1
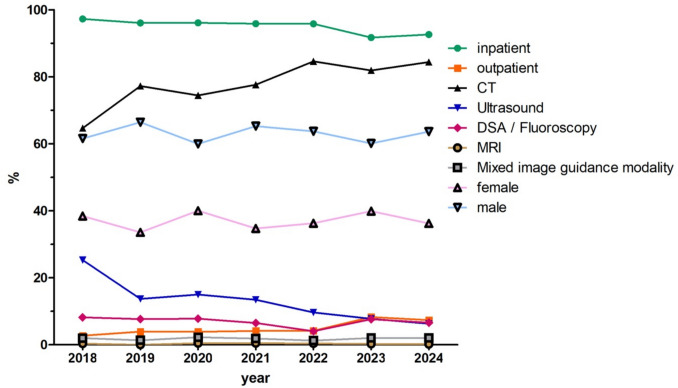 Figure 2
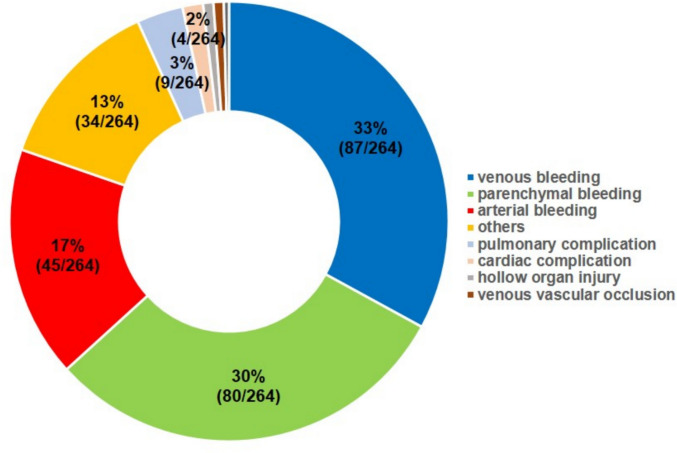 Figure 3
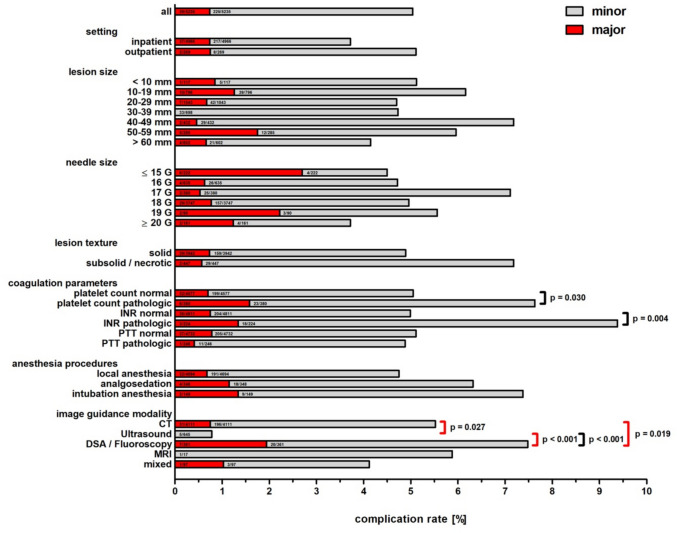 Figure 4
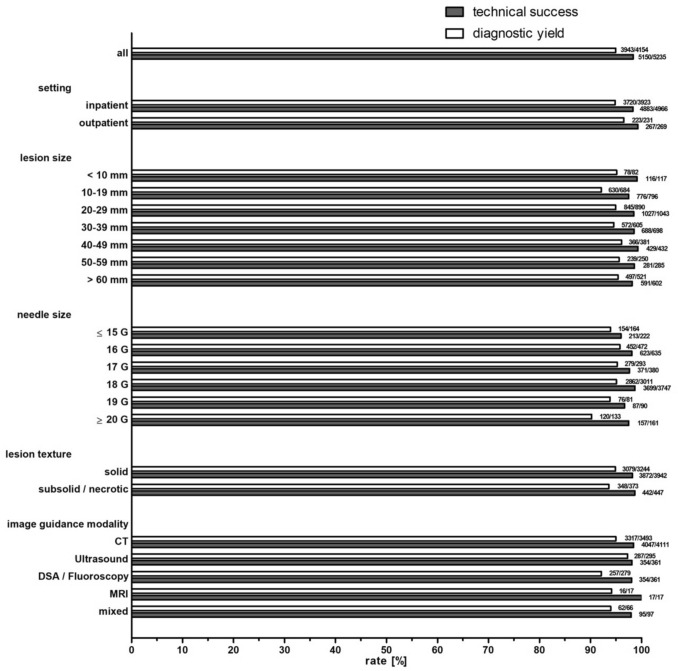 Figure 5
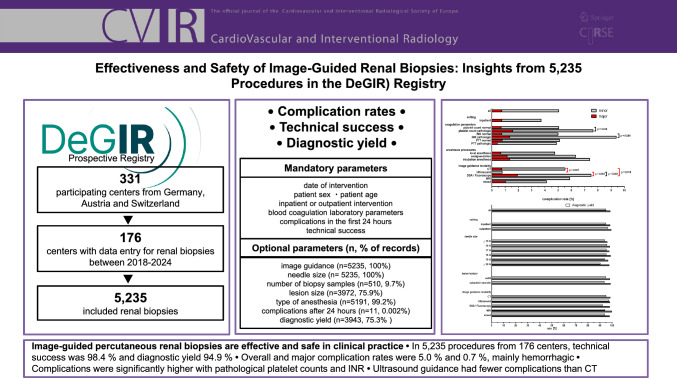 Figure 6
- —Universitätsklinikum Essen (8912)
Peer Reviews
No public reviews on file for this paper yet. If you reviewed it on a platform where reviews are public (OpenReview, ICLR, NeurIPS, ICML), you can paste yours below so the community can read it here.
Videos
No videos yet. Explain this paper in a talk, walkthrough, or lecture? Add one.
Taxonomy
TopicsRenal cell carcinoma treatment · Kidney Stones and Urolithiasis Treatments · Pediatric Urology and Nephrology Studies
Introduction
Percutaneous image-guided renal biopsy plays a central role in the diagnostic workup of renal parenchymal diseases and indeterminate renal masses. With the growing use of targeted therapies and immune checkpoint inhibitors in nephrology and oncology, obtaining adequate tissue for histological classification and molecular profiling has become increasingly important. Imaging modalities, while indispensable for lesion detection and localization, are often insufficient to reliably distinguish between inflammatory, infectious, and neoplastic processes—particularly when treatment decisions hinge on precise histopathological subtypes or molecular alterations [1, 2].
Histopathological evaluation therefore remains the diagnostic gold standard in many renal conditions and is central to precision medicine approaches [3].
Renal biopsies are typically performed under ultrasound (US) or computed tomography (CT) guidance, with the choice of modality depending on lesion visibility, anatomical location, and operator expertise. According to current Guidelines, percutaneous renal mass biopsy is recommended in selected clinical situations, including active surveillance of small renal masses, preablation evaluation, or histological confirmation of metastases [4], and may directly impact treatment [5].
Despite increasing clinical relevance, large-scale multicenter data on safety and diagnostic performance remain limited with published evidence derived from single-center series or prospective cohorts with predominantly US-guided procedures [6–8].
The German Society for Interventional Radiology and Minimally Invasive Therapy (DeGIR), a member of the Cardiovascular and Interventional Radiological Society of Europe (CIRSE), maintains a prospective multicenter registry for quality assurance and research, currently encompassing 331 centers across Germany, Austria, and Switzerland. This provides a robust platform for evaluating clinical routine in interventional radiology [9–12].
The aim of this study was to analyze the technical success, diagnostic yield, and complication rates of image-guided percutaneous renal biopsies across DeGIR registry sites between 2018 and 2024.
Material and Methods
Data Source and Study Design
This retrospective multicenter study included image-guided percutaneous renal biopsies documented in the prospectively DeGIR registry between January 2018 and December 2024. Ethical approval for the registry was obtained centrally, with additional local approval. Participating centers entered standardized routine data via a Web-based platform (samedi GmbH, Berlin, Germany).
Inclusion Criteria and Definitions
The dataset comprised both mandatory and optional variables, as outlined in Fig. 1. Technical success was defined as visually confirmed biopsy needle placement within the target lesion. The coagulation parameters (platelet count, INR, PTT) were recorded as either pathological or normal, based on the local laboratory standards of the individual participating centers. No predefined numerical thresholds were available in the registry.Fig. 1. Study flowchart
Complications were classified according to the Society of Interventional Radiology (SIR) severity grading system, distinguishing between minor (grades A–B) and major (grades C–F) events [13], and categorized as either early (within 24 h) or delayed (onset after 24 h). The updated CIRSE classification system [14] represents the current standard for complication grading in interventional radiology.
Diagnostic yield was defined as the proportion of procedures that resulted in a histologically adequate sample enabling a definitive clinical diagnosis. As histological reports were documented only when entered as an optional registry field, diagnostic yield was calculated from the subset of cases with available reports (n = 4,154). Lesion texture was classified at the time of biopsy according to imaging appearance. Cases with missing data were excluded from the respective analyses.
Statistical Analysis
Statistical analysis was performed using SPSS software, version 26.0 (IBM Corp., Armonk, NY, USA). The distribution of continuous variables was assessed with the Kolmogorov–Smirnov test. Non-normally distributed variables are reported as median with interquartile range (IQR). Categorical variables, including technical success, diagnostic yield, and complication rates, were compared using the Chi-square test. Non-normally distributed continuous variables between groups were compared using the Mann–Whitney U test. Binary univariable and multivariable logistic regression models were performed to identify independent predictors of complications. A p-value < 0.05 was considered statistically significant. All subgroup analyses were exploratory, and no formal adjustment for multiple testing was applied. Reported p-values should therefore be interpreted descriptively.
Results
Patient Characteristics
Between 2018 and 2024, a total of 5,235 image-guided percutaneous renal biopsies were reported to the DeGIR registry by 176 centers (Fig. 1). The median number of procedures per center was 8 (IQR: 3–32). The majority of procedures were performed in male patients. The median patient age was 70 years (IQR: 60–80). Information on interdisciplinary tumor board decisions was available for 7.49% of procedures (392/5,235), and in all documented cases, the biopsy had been recommended by the board. Most procedures were performed in inpatients (94.9%), with an increasing proportion of outpatient biopsies (Table 1, Fig. 2).Table 1. Frequency of percutaneous image-guided renal biopsies from 2018 to 2024 by setting, gender distribution, and image guidance modality2018201920202021202220232024AllAll549664794795714784935523510.49%12.68%15.17%15.19%13.64%14.98%17.86%100%SettingInpatient534638763762684719866496697.27%96.08%96.10%95.85%95.80%91.71%92.62%94.86%Outpatient152631333065692692.73%3.92%3.90%4.15%4.20%8.29%7.38%5.14%Gender distributionFemale211223318276259313339193938.43%33.58%40.05%34.72%36.27%39.92%36.26%37.04%Male338441476519455471595329561.57%66.42%59.95%65.28%63.73%60.08%63.64%62.94%Image guidance modalityCT355513591617604642789411164.66%77.26%74.43%77.61%84.59%81.89%84.39%78.53%US1399111910769615964525.32%13.70%14.99%13.46%9.66%7.78%6.31%12.32%DSA/fluoroscopy455162522960623618.20%7.68%7.81%6.54%4.06%7.65%6.63%6.90%MRI2044322170.36%0%0.50%0.50%0.42%0.26%0.21%0.32%Mixed119181591619972.00%1.36%2.27%1.89%1.26%2.04%2.03%1.85%Fig. 2. Frequency of percutaneous image-guided renal biopsies from 2018 to 2024 by setting, gender distribution, and image guidance modality
Lesion and Biopsy Characteristics
CT was the predominant image guidance modality (78.53%), followed by US, DSA/fluoroscopy, MRI, and mixed guidance (Table 1). The median lesion size was 26 mm (IQR: 16–43 mm). For CT-guided procedures, the median lesion size was 29 mm (IQR: 20–45), for US-guided procedures 30 mm (IQR: 20–55 mm; p = 0.139). Most lesions were solid (75.30%, 3,942/5,235). The number of biopsy samples was documented in 9.74% (510/5,235) of all procedures, with a median number of 3 samples (IQR: 2–3). Among the documented cases, in 35.67% (182/510), only a single biopsy sample was obtained. In 81.96% (418/510), up to 3 biopsy samples were obtained. 1.45% (76/5,235) of procedures were discontinued, most commonly due to patient noncooperation (50.0%, 38/76), miscellaneous reasons (23.68%, 18/76), or technical/ anatomical difficulties (18.42%, 14/76). Intervention-dependent complications led to discontinuation in only 1.32% (1/76). Nearly all discontinued procedures (97.37%) occurred in an inpatient setting (74/76) (Table 2).Table 2. Complications within 24 h of percutaneous image-guided renal biopsies**Procedures (n)****Complications total (n [%])****Major according to SIR classification [13] (n [%])**All5235264395.04%0.74%SettingOutpatient2691023.72%0.74%Inpatient4966254375.11%0.75%Lesion Size < 10 mm117615.13%0.85%10–19 mm79649106.16%1.26%20–29 mm10434974.70%0.67%30–39 mm6983304.73%0%40–49 mm4323127.18%0.46%50–59 mm2851755.96%1.75% > 60 mm6022544.15%0.66%Not specified126254104.28%0.79%Needle Size14 G173663.47%3.47%15 G49408.16%0%16 G6353044.72%0.63%17 G3802727.11%0.53%18 G3747186294.96%0.77%19 G90525.56%2.22%20 G120625%1.67%21 G41000%0%Lesion textureSolid3942188294.77%0.74%Subsolid1431218.39%0.69%Necrotic3041916.25%0.33%Mixed texture93818.6%0.01%Unspecified7533774.91%0.93%Coagulation-related laboratory parametersPlatelet count normal4577231325.05%0.70%Platelet count pathological3802967.63%1.58%International normalized ratio (INR) normal4811240364.99%0.75%International normalized ratio (INR) pathological2242139.38%1.34%Partial thromboplastin time (PTT) normal4732242375.11%0.78%Partial thromboplastin time (PTT) pathological2461214.88%0.41%Anesthesia proceduresLocal anesthesia4694223324.75%0.68%Analgosedation3482246.32%1.15%Intubation anesthesia1491127.38%1.34%Unspecified44112.27%2.27%Image guidance modalityCT4111227315.52%0.75%Ultrasound645500.78%0%DSA/fluoroscopy3612777.48%1.94%MRI17105.88%0%Mixed97414.12%1.03%
Complications
The overall complication rate within 24 h post-procedure was 5.04%. Most complications were minor (4.30%), including 59.11% (133/225) classified as SIR grade A (no therapy, no sequelae) and 40.89% (92/225) as grade B (requiring symptomatic therapy or observation). Major complications occurred in 0.74%, including 69.23% grade C (27/39) and 30.77% grade D complications (12/39). There was no permanent health damage (Grade E) or death (Grade F) within 24 h. The most frequent complication type was bleeding (Fig. 3). The cause of bleeding (venous, parenchymal, arterial) was documented in the register by the attending physician; the diagnostic method was not specified.Fig. 3. Complications of percutaneous image-guided renal biopsies differentiated by complication type
A total of 0.21% (11/5.235) delayed complications (> 24 h post-procedure) were reported, of which 36.36% were classified as minor (4/11) and 63.64% as major (7/11). All delayed complications were observed in the inpatient setting, with 27.3% (3/11) resulting in death (Grade F).
When comparing image guidance modalities, CT-guided biopsies were associated with significantly higher overall complication rates than US-guided procedures (5.52% vs. 0.78%, p < 0.001). Major complications occurred significantly more frequently with CT guidance than with US guidance (0.75% vs. 0%, OR = 0.99, 95%CI 0.99–0.995; p = 0.027). In the multivariable logistic regression including measurable confounders, CT guidance remained the only independent predictor of complications compared to US (adjusted OR 8.57, 95%CI 3.40–21.58; p < 0.001, Table 3). When comparing fluoroscopy with CT- and US-guided procedures, fluoroscopy was associated with significantly higher major complication rates (CT vs. fluoroscopy major: OR = 0.38, 95%CI 0.17–0.88; p = 0.019; US vs. fluoroscopy, p < 0.001 for both overall (OR = 0.1, 95%CI 0.04–0.25) and major complications (OR = 1.02, 95%CI 1.01–1.04). Fluoroscopy did not remain a significant predictor after adjustment for confounders.Table 3. Baseline predictors of complications within 24 h following percutaneous image-guided renal biopsies: results from univariate and multivariable logistic regressionPredictorCategory (reference)Complications, n (%)Univariable OR95% CIp-valueMultivariable OR95% CIp-valueSettingInpatient (ref.) Outpatient254 (5.11%) 10 (3.72%)1.3960.733–2.6590.3101.4200.740–2.7260.292Lesion Size < 10 mm6 (5.13%)1.2850.169–9.7740.8090.7020.394–1.2500.22910–19 mm49 (6.16%)0.6940.433–1.1120.1291.2810.167–9.8340.81120–29 mm49 (4.70%)0.9440.589–1.5140.8120.7380.456–1.1950.21730–39 mm33 (4.73%)0.9210.552–1.5340.7510.9800.607–1.5820.93440–49 mm31 (7.18%)0.5890.350–0.9930.0470.9460.564–1.5850.83250–59 mm17 (5.96%)0.7560.417–1.3690.3560.6270.369–1.0630.083 > 60 mm (ref.)25 (4.15%)not specified54 (4.28%)1.0270.648–1.6300.9090.7810.428–1.4240.420Needle Size14 G6 (3.47%)1.3320.485–3.6560.5783.2090.777–13.2630.10715 G4 (8.16%)0.5880.209–1.6510.3131.3050.469–3.6350.61016 G30 (4.72%)1.0530.710–1.5640.7970.7440.252–2.1940.59217 G27 (7.11%)0.6830.450–1.0370.0741.0230.682–1.5340.91318 G (ref.)186 (4.96%)19 G5 (5.56%)0.8880.356–2.2150.7990.7630.497–1.1700.21520 G6 (5.00%)0.9920.431–2.2850.9861.1220.430–2.9320.814Lesion textureSolid (ref.)188 (4.77%)Subsolid12 (8.39%)0.5470.297–1.0050.0520.9830.590–1.6400.948Necrotic19 (6.25%)0.7510.462–1.2220.2500.5350.281–1.0200.057Mixed texture8 (8.60%)0.5380.357–1.1270.1010.7890.479–1.3010.354Unspecified37 (4.91%)0.9680.674–1.3890.8590.6710.311–1.4450.308Coagulation-related laboratory parametersPlatelet count normal (ref.)231 (5.05%)Platelet count pathological29 (7.63%)0.6410.429–0.9580.0303.3741.008–11.2980.049International Normalized Ratio (INR) normal (ref.)240 (4.99%)International Normalized Ratio (INR) pathological21 (9.38%)0.5080.318–0.8100.0043.5400.749–16.7310.111Partial thromboplastin time (PTT) normal (ref.)242 (5.11%)Partial thromboplastin time (PTT) pathological12 (4.88%)1.0510.580–1.9040.8700.3920.165–0.9310.034Anesthesia proceduresLocal anesthesia (ref.)223 (4.75%)Analgosedation22 (6.32%)0.7630.486–1.1990.2422.4200.323–18.1100.390Intubation anesthesia11 (7.38%)0.6460.345–1.2110.1730.6620.413–1.0620.087Unspecified1 (2.27%)2.2160.304–16.1600.4330.7070.374–1.3360.286Image guidance modalityCT (ref.)227 (5.52%)Ultrasound5 (0.78%)7.4613.064–18.171** < 0.0018.5663.400–21.580 < 0.001**MRI1 (5.88%)0.8770.115–6.6700.8990.9210.120–7.0690.937DSA/fluoroscopy27 (7.48%)0.7210.477–1.0910.1220.8230.516–1.3120.413Mixed4 (4.12%)1.5060.550–4.1250.4261.7630.619–5.0200.289
The overall complication rates did not differ significantly between inpatient and outpatient procedures (OR = 0.72, 95%CI 0.38–1.36; p = 0.308). Major complication rates were identical in both settings (OR = 1.00, 95%CI 0.24–4.18; p = 0.998, Fig. 2). Lesion size did not significantly influence complication risk. Pathological platelet counts (7.63% vs. 5.05%; OR = 1.55, 95%CI 1.04–2.32; p = 0.030) and pathological INR values (9.38% vs. 4.99%; OR = 1.97, 95%CI 1.23–3.15; p = 0.004) were associated with higher complication rates, but not in those with pathological PTT (4.88% vs. 5.11%; OR = 0.95, 95%CI 0.53–1.72; p = 0.870). After adjustment, none of these coagulation parameters remained independently associated with complications (Table 3). Rates of major complications showed no significant differences across these groups (Table 2, Fig. 4).Fig. 4. Complications of percutaneous image-guided renal biopsies, including significant p-values
Compared to procedures performed under local anesthesia, procedures under analgosedation and general anesthesia showed numerically higher complication rates; however, none of these differences reached statistical significance (all p > 0.14).
Technical Success
The overall technical success rate was 98.38%. Technical success rates were equally high for CT guidance and for US guidance (OR = 1.2, 95%CI 0.64–2.23; p = 0.567), for inpatients and outpatients (OR = 0.44, 95%CI 0.11–1.80; p = 0.241) as well as solid and subsolid lesion texture (OR = 0.39, 95%CI 0.05–2.82; p = 0.333). No consistent association was found between needle size and technical success (Table 4, Fig. 5).Table 4. Technical success and diagnostic yield of percutaneous image-guided renal biopsiesProceduresTechnical successDiagnostic yieldnProcedures (n)Rate (%)Report available (n)Diagnosis possible (n)Rate (%)All5235515098.384154394394.92SettingOutpatient26926799.2623122396.54Inpatient4966488398.333923372094.83Lesion size ≤ 10 mm11711699.15827895.1210–19 mm79677697.4968463092.1120–29 mm1043102798.4789084594.9430–39 mm69868898.5760557294.5540–49 mm43242999.3138136696.0650–59 mm28528198.6025023995.60 ≥ 60 mm60259198.1752149795.39not specified1262124298.4274171696.63Needle Size ≤ 14 G17316595.3812912294.5715 G494897.96353291.4316 G63562398.1147245295.7617 G38037197.6329327995.2218 G3747369998.723011286295.0519 G908796.67817693.8320 G12011999.17989091.84 ≥ 21 G413892.68353085.71Lesion textureSolid3942387298.223244307994.91Subsolid14314299.3011510793.04Necrotic30430098.6825824193.41Mixed939197.85837995.18Unspecified75374498.8045343696.25Number of biopsies118218210012311593.502110110100747195.953126126100999898.99444441003131100519191001616100622221001515100 ≥ 7771005480Not specified4725464098.203791359394.78Anesthesia proceduresLocal anesthesia4694461798.363734353994.78Analgosedation34834298.2825625198.05Intubation anesthesia14914910012311795.12Unspecified444295.45413687.80Image guidance modalityCT4111404798.443493331794.96Ultrasound64563398.1429528797.29DSA/fluoroscopy36135498.0627925792.11MRI1717100171694.12Mixed979597.94666293.94Fig. 5Technical success and histological representativeness rates of percutaneous image-guided renal biopsies
Diagnostic Yield
Diagnostic yield was high for CT and US guidance (OR = 0.53, 95%CI 0.26–1.08; p = 0.074). The overall diagnostic yield was 94.92%, whereby outpatients achieve similar rates to inpatients (OR = 1.52, 95%CI 0.74–3.12; p = 0.250).
Subsolid and necrotic had slightly, not significantly lower diagnostic yield compared to solid lesions (subsolid: OR = 0.72, 95%CI 0.34–1.49; p = 0.373; necrotic: OR = 0.76, 95%CI 0.45–1.27; p = 0.295). Diagnostic yield was highest in lesions measuring 40–49 mm (96.06%, 366/381) and lowest in lesions between 10 and 19 mm (92.11%, 630/694, Table 4). No consistent association was found between needle size and diagnostic yield (Table 4, Fig. 5).
The number of biopsy samples was reported in 9.74% of procedures (510/5,235). Among these, diagnostic yield increased with the number of biopsy samples obtained, reaching 99% (98/99) with three samples and 100% with four to six samples (62/62).
Discussion
This large-scale registry analysis provides important insights into the current use, effectiveness, and safety of image-guided renal biopsies: Reported biopsies showed consistently high technical success and diagnostic yield rates, underscoring their established diagnostic role in nephrologic and oncologic care. The overall complication rate was low (5.04%), with major complications occurring in only 0.74% of cases, confirming a favorable safety profile. The proportion of outpatient procedures—although still limited—steadily increased over the study period, reflecting growing confidence in decentralized biopsy strategies and supporting their feasibility in selected patients.
Bleeding accounted for the majority of complications, reflecting the kidney’s dense vascularization and limited compressibility in the retroperitoneum. Importantly, major complications were rare (0.74%), and no fatal events occurred within 24 h, in line with recent meta-analyses and national registries [6, 7, 15, 16].
US guidance was independently associated with a lower complication risk compared with CT, even after adjustment for measurable confounders. Although this finding supports guideline recommendations favoring US guidance whenever feasible, causal inference is limited by the observational design and possible preferential use of US in technically less complex cases; residual selection bias cannot be excluded. Fluoroscopy-guided renal biopsy showed significantly higher major complication rates in univariable analysis, consistent with current guidelines that no longer recommend fluoroscopy as a standard modality [17].
Patients with coagulation abnormalities, particularly pathological platelet count or INR, had higher complication rates in univariable analyses. The findings are consistent with previous institutional reports [6, 16] and reinforce consensus guidelines that emphasize the importance of thorough preprocedural coagulation screening and correction [17, 18]. The SIR guideline further recommends individualized risk assessment and defines specific thresholds for platelet count and INR and provides detailed protocols for managing anticoagulation in image-guided interventions [19, 20]. Even after adjustment, none of these coagulation parameters remained independently associated with complications, and our findings emphasize that adherence to these standards is essential for procedural safety.
Lesion size, including lesions < 10 mm, did not significantly affect complication rates. These data align with previous studies suggesting that small lesion size does not inherently increase procedural risk, provided appropriate technique and imaging guidance are used [21–23]. Thus, lesion size alone should not preclude biopsy when histological diagnosis is clinically indicated.
Technical success was equally high for both CT- and US-guided biopsies, indicating that both modalities are reliable when lesions are adequately visualized. Technical success rates were consistently high in both outpatient and inpatient procedures, which supports the feasibility and safety of renal biopsy in selected outpatient procedures. Previous studies and guideline recommendations indicate that the vast majority of patients are suitable for outpatient renal biopsy. Hospitalization should be restricted to rare cases with unmodifiable anticoagulation or severe coagulation disorders [24–26].
Subsolid or necrotic lesions had slightly lower diagnostic yield compared to solid lesions, likely due to sampling of non-viable, hemorrhagic, or acellular tissue—an effect that has been reported in prior studies [21, 27].
A very high diagnostic yield (62/62 cases) was observed when 4–6 cores were obtained. This association should be interpreted with caution, given the relatively small subgroup size and the observational nature of our study; causality cannot be inferred. This observation supports the EAU guideline recommendation to retrieve at least two good quality biopsy samples, and avoid necrotic areas to maximize diagnostic yield [4]. In nephrologic indications, recommendations suggest retrieving enough tissue to evaluate approximately 10–20 glomeruli for sample adequacy in renal biopsies [8, 28]. This approach supports both diagnostic reliability and procedural safety. While excessive sampling could theoretically increase bleeding risk, adequate tissue sampling should be prioritized, especially in oncologic or complex nephrologic cases.
As a registry-based study, our analysis is subject to certain limitations. Data completeness depended on site-reported entries, and optional parameters were not uniformly documented. Selection bias cannot be fully excluded, especially for outpatient procedures, which may have been performed in lower-risk patients. Furthermore, the number of outpatient biopsies was relatively low (n = 269 compared to 4,966 inpatient procedures), which led to limited statistical significance for subgroup comparisons. All delayed events (> 24 h) occurred in hospitalized patients, which is likely due to differences in monitoring rather than an actual absence of events in the outpatient group; this detection bias must be taken into account when interpreting the safety data. No central histopathological review was available and complications were classified according to the SIR rather than the newer CIRSE-based standards. Procedural details such as post-biopsy observation time, specific biopsy indication, and operator-level factors were not captured, and thresholds for defining pathological coagulation parameters may have varied between centers. Underreporting cannot be excluded, representing a potential reporting bias. Nonetheless, the large sample size, multicenter scope, and real-world nature of the dataset offer valuable insights into routine practice across a broad healthcare landscape.
Conclusion
Image-guided percutaneous renal biopsy is a safe and highly effective diagnostic tool across a wide spectrum of clinical settings. The low rate of major complications—even in routine clinical settings—highlights its favorable safety profile, particularly when coagulation parameters are within recommended limits. With appropriate patient selection, outpatient biopsy is feasible, without compromising safety or diagnostic quality. Adequate tissue sampling and strict adherence to coagulation management protocols remain critical to ensure diagnostic utility and minimize procedural risk. These real-world data contribute to refining procedural standards and support the broader implementation of renal biopsy in the era of precision medicine.
The reference list from the paper itself. Each links out to its DOI / PubMed record.