Side effects of mandibular advancement devices in obstructive sleep apnea patients – observational results of a randomized controlled trial
Olaf Bernhardt, Nikolaos Nikitas Giannakopoulos, Horst Kares, Alexander Meyer, Carl-Maximilian Nürnberger, Sebastian Ruge, Christian Schwahn, Jörg Schlieper, Sarah Yousif, Hendrik Zenner, Philipp Kanzow

TL;DR
This study compared side effects of two mandibular advancement devices used to treat sleep apnea and found both caused similar orofacial pain and posterior tooth contact loss.
Contribution
The study provides observational evidence on side effects of two MAD designs in a randomized controlled trial setting.
Findings
Both MADs caused similar levels of orofacial pain, though results were not statistically significant.
Posterior tooth contact loss was significant in both MAD groups despite jaw exercises and occlusal guides.
Somnological variables improved over time with no major differences between MAD designs.
Abstract
To identify side effects of two different mandibular advancement devices (MAD) for treating obstructive sleep apnea. Sixty-five patients were randomly assigned to two MADs (MAD 1 with bilateral sliding wings, MAD 2 with bilateral bars according to the Herbst appliance). Instructions for supportive jaw exercises and a morning occlusal guide were supplied. Orofacial pain, tenderness of masticatory muscles and temporomandibular joints, interdental contact analysis (digital bite registration system, Greifswald Digital Analyzing System (GEDAS) and Shimstock-foil), Epworth Sleepiness Scale, Pittsburgh Sleep Quality Index, and the Oral Health Impact Profile 5 were assessed before and after one year of treatment. MADs were compared using linear models, which were adjusted for study center, age, sex, and baseline values. Tooth type and tooth status were also included in the multilevel model of…
Genes, proteins, chemicals, diseases, species, mutations and cell lines named across the full text — each resolved to its canonical identifier and authoritative record.
Click any figure to enlarge with its caption.
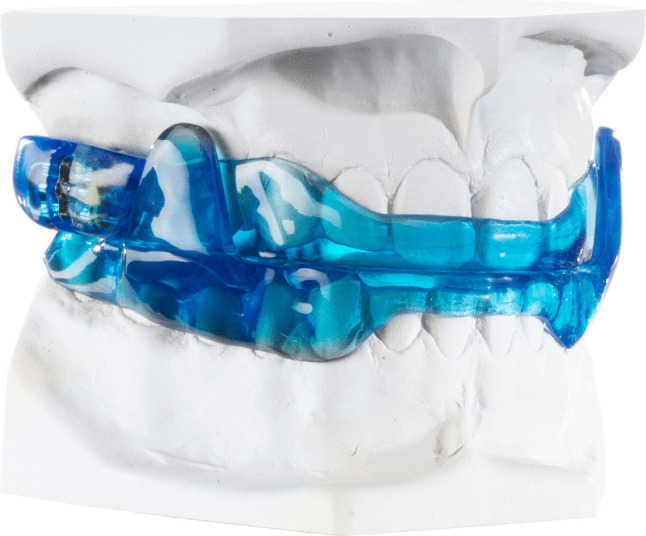 Figure 1
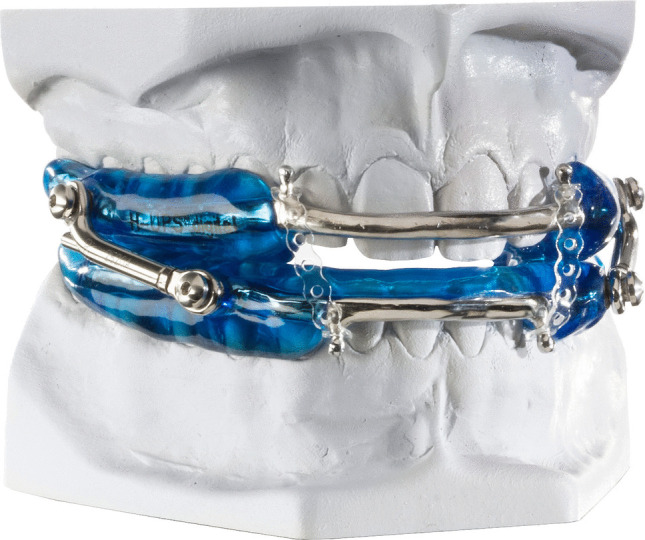 Figure 2
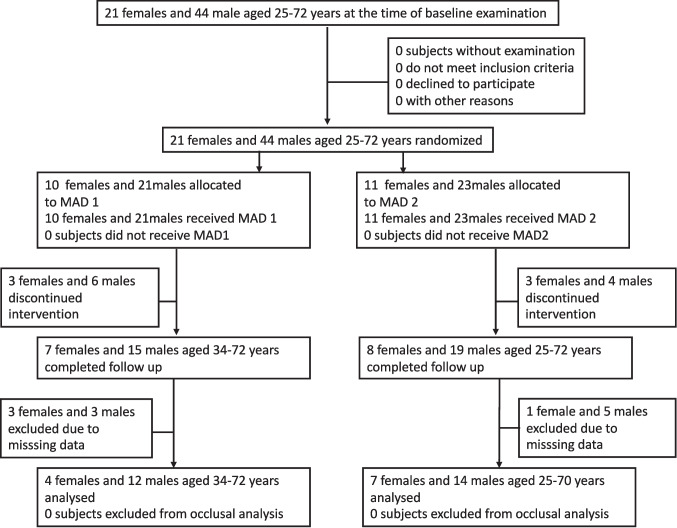 Figure 3
- —Universitätsmedizin Greifswald (8976)
Peer Reviews
No public reviews on file for this paper yet. If you reviewed it on a platform where reviews are public (OpenReview, ICLR, NeurIPS, ICML), you can paste yours below so the community can read it here.
Videos
No videos yet. Explain this paper in a talk, walkthrough, or lecture? Add one.
Taxonomy
TopicsObstructive Sleep Apnea Research · Temporomandibular Joint Disorders · Orthodontics and Dentofacial Orthopedics
Introduction
Mandibular advancement devices (MADs) are a common therapeutic approach involving appliances for the treatment of snoring and obstructive sleep apnea (OSA) [1]. They are recommended as an alternative treatment option to continuous positive airway pressure (CPAP) therapy, especially in mild to moderate OSA [2]. Several clinical studies have demonstrated the efficacy of MAD therapy, leading its classification as a recommended choice of treatment [2, 3]. Compared with CPAP, MADs have been associated with superior patient adherence [4]. Despite variations in design, all MADs share a comparable mechanism of action based primarily on stabilizing the mandible in a protruded position. This mechanical advancement creates tension in the suprahyoid muscles, promoting dilatation and stabilization of the upper airway, especially at the level of the velum, the tongue base, and the epiglottis [5].
Despite this favorable results, potential side effects may occur during or following the nocturnal use of MADs, depending on the device’s specific design and the patient´s characteristics [6]. At the beginning of treatment, patients may experience hypersalivation, xerostomia, increased dental sensitivity, soft-tissue irritation, or gingival inflammation due to contact with the appliance margins [7]. In the short to medium term, mandibular protrusion may lead to temporomandibular disorders (TMD), including sensations of tension or pain in the masticatory muscles and/or temporomandibular joints (TMJ), which typically subside with continued use [8]. Multiple studies have confirmed that prolonged MAD therapy might lead to measurable occlusal changes in the anterior teeth, most notably a reduction in overjet and overbite [7, 9]. After two years of treatment, in up to 18% of patients the development of a posterior open bite was apparent [10]. Long-term studies indicate that such reduced posterior dentition contacts do not spontaneously resolve over a ten-year period [11]. Jaw exercises are considered as a beneficial strategy for preventing occlusal alterations as well as preventing pain [12].
The aim of the study was to compare two various MAD designs with different protrusion mechanics as well as different interincisal vertical dimensions regarding the extent of harmful side effects of these appliances.
Special attention was laid on examining change of occlusal contacts. We hypothesized that a jaw exercise protocol together with the application of an occlusal guide prevent occlusal changes in the posterior teeth.
Material and methods
Subjects
Recruitment
Patients were recruited at five dental or maxillofacial surgery clinics that specialized in treating OSA patients with MAD and networked with referring sleep medicine centers. Recruitment took place from December 1, 2019, to December 31, 2021. Follow-up examinations were included in the final analysis till December 21, 2022. The target number of 194 patients, however, could not be reached; only 65 patients were recruited by five of the originally planned nine study centers. This discrepancy was primarily caused due to the global SARS-CoV-2 pandemic. Business closures in various economic sectors or price increases could be possible reasons for not reaching the recruitment target. Due to this major limitation affecting analyses at the subject level (including those of the primary outcome, orofacial pain) we focused on analyses including the tooth level, such as interdental contact analyses. These analyses have greater statistical power than pure subject-level analyses because they have a higher number of observations.
Sample characteristics
The inclusion criteria for this study were as follows: a medical indication for mandibular protrusion (MAD) due to obstructive sleep apnea (OSA) or a request for snoring treatment; an age of 18 to 75 years; mandible protrusion of at least 5 mm; at least the number of eight teeth or four implants existing per jaw, no or fixed dental restorations or a stable, removable partial denture that occludes at least up to the area of the second premolars on both sides; and mental health, as well as a the signed declaration of informed consent.
Sample size calculation
The required sample size was determined based on the numerical pain scale (0–10) assuming a difference of 1 point and a standard deviation of 2. This results in an effect size of 0.5 which corresponds to a moderate effect size in terms of Cohen's d. Wilcoxon-Mann–Whitney test was used with a two-sided α = 0.05 and a power of 0.90 assuming a family of logistic distributions (G*Power, version 3.1). The final sample was 156. Assuming the annual dropout rate of 10%, a total sample of 194 was calculated for a two-year period (194-20 = 174 after one year and 174-18 = 156 after two years).
Study design
This study is part of a randomized multi-center, two-arm trial with an active control group. (ClinicalTrials.gov ID: NCT04050514). Originally, the study aimed to analyze the side effects of two different MADs in 194 OSA and snoring patients over a two-year period.
Randomization
Randomized grouping into blocks at a ratio of 1:1 took place via sequentially numbered opaque sealed envelopes containing the allocation key for the respective MAD. The assignment was stratified according to sex within the 9 intended study centers. Nine series of 40 pseudo-random numbers for male patients and 20 pseudo-random numbers for female patients were generated with Stata/MP software, version 17.0 (Stata Corporation, College Station, TX, USA) and assigned to the respective patient numbers by a person not participating in the active study phase. Envelopes were sent to the nine primary study centers. Examiners were instructed to open the envelopes after consent of the eligible patients. All study protocols for baseline and follow up examinations were labelled with the individual patient ID including the allocation to the treatment group. The clinical trial coordination center at the University of Greifswald verified the ordered sequence of the patient ID after receiving the study protocols.
Study procedures
All patients received a structured general and somnological history and physical examination during their first visit to the sleep laboratory. Additionally, stationary polysomnography or outpatient polygraphy was performed. Patients were referred to specialized dental practices for base line dental assessment as well as for the fabrication and integration of a MAD based on a diagnosis at a medical sleep center. There, the number of teeth and fixed as well as removeable restorations, orofacial functional condition according to the Diagnostic Criteria for Temporomandibular Disorders (DC/TMD) and the questionnaire on Graded Chronic Pain (GCPS) [13] and questionnaires for sleep quality as well as oral health related quality of life were recorded at baseline and follow up examination.
Primary outcome was defined as the change of orofacial pain during MAD application, measured on a numeric rating scale (NRS; 0–10) at the time of the follow-up appointments. Occurrence of pain was accounted as largest side effect in MAD treatment with major harm. We asked the following question to the patients: “How would you rate your facial pain right now? Use a scale from 0 to 10, where 0 is no pain and 10 is pain as bad as could be.”
Following secondary outcomes were assessed
Muscle and temporomandibular joint (TMJ) pain with palpation: We examined m. temporalis (posterior, middle, anterior), m. masseter (origin, body, insertion) TMJ lateral pole and around lateral pole each left and right side resulting in 12 palpation sites for the muscles and 4 palpation sites for the TMJs.
Apnea Hypopnea Index (AHI): AHI is a measure of how many breathing pauses in the form of apneas and hypopneas a patient experiences while sleeping per hour [14].
Oxygen Desaturation Index (ODI): ODI is the number of oxygen desaturations per hour of sleep [14].
Pittsburgh Sleep Quality Index (PSQI): PSQI retrospectively asks for a four-week period the incidence of sleep disturbing events, sleep quality assessment, sleep habits, sleep latency and sleep duration, sleeping medication use, and daytime sleepiness (range 0–21) [15].
Epworth Sleepiness Scale (ESS): The Epworth Sleepiness Scale (ESS) is a short questionnaire for the detection of daytime sleepiness, in which the probability of falling asleep or falling asleep in eight typical everyday situations is retrospectively inquired (range 0–24) [4].
Oral Health Impact Profile (OHIP-5): OHIP is a measurement tool for assessing the oral health-related quality of life in adults. It can describe the individual oral health status of patients and measure and compare disease-related burdens in the course (range 0–20) [16].
The questionnaires (PSQI, ESS, OHIP-5) were completed by the investigators in the form of an interview with the patient. AHI and ODI were collected in the sleep laboratory.
Occlusion protocol
Bite registrations in habitual occlusion were created using thin, flowing, addition-crosslinking silicone (Greenbite Apple, Detax, Germany) and scanned with a flatbed scanner for evaluation in transmitted light. Layer thicknesses of 20 μm or less were interpreted as occlusal contacts and assigned to the anatomical structures of the occlusal surfaces using the Greifswald Digital Analyzing System (GEDAS). Contacts are given in pixel per tooth (range:0—4139) [17]. Furthermore, the number antagonistic tooth contacts between the upper and lower jaw were recorded with 8 micron-thick Shimstock slides for each tooth. Contacts are given in contacts per tooth (0;1) All occlusal assessments were repeated at least one year after the baseline examination. For both procedures all patients were instructed to close their jaws firmly in maximal intercuspal position. All examiners received detailed instructions and training for the examination procedures according to the study protocol before the study started.
Materials
MAD therapy
Both included designs of MADs (F-UPS® WO2019238744; H-UPS® DE10216242) were fabricated in the same dental laboratory (Schultheis, Solingen, Germany). MAD 1 was made of polymethyl-methacrylate (PMMA) with bilaterally attached sliding side wings, with a 5-mm interincisal distance, and protrusion as measured by a George Gauge (Great Lakes Dental Technologies, Tonawanda, NY, USA). Lower jaw advancement began at 5 mm from to the maximal possible point of retrusion upon MAD insertion and progressed to the final titrated mandibular advancement during the therapy phase (Fig. 1).Fig. 1MAD 1
The MAD 2 was made of PMMA including stainless steel-cast inserts with bilateral bars identical to the Herbst appliance, and a 2-mm interincisal distance. Here, due to the steel-cast labial bow, upper incisors had no contact with the appliance. Lower jaw advancement also began at 5 mm protrusion in the same manner as for MAD 1 (Fig. 2).Fig. 2MAD 2
Due to the different effects of the geometry of the protrusion elements of both devices on the risk of mouth opening, elastics, which can hinder lip closure and comfort and thus the effectiveness of the therapy, were not generally used in MAD 1, in contrast to MAD 2.
After delivery and integration of the assigned MAD, all patients received an extended guide to jaw gymnastics according to Cunali et al. [12] with the instruction to apply the shown exercises in the morning upon waking and in the evening before going to sleep. Patients were as well trained using a morning occlusal guide, the Airway Management Aligner (AM-Aligner, Airway Management Inc., Dallas, TX, USA) which should enable the patients to reestablish occlusion in the habitual pre-treatment position.
Statistical analyses
We addressed multiplicity by specifying the priority ordering of the outcomes in the study protocol as recommended [18].The secondary outcomes were ordered as follows: muscle and joint pain to assess harm alongside the primary outcome, the number of contact points, as well as PSQI, ESS, OHIP-5, AHI, and ODI. Contrary to the protocol, we removed the STOP-Bang questionnaire and the average oxygen saturation during sleep, but we added titration on demand. As the number of contacts were modeled using multilevel models [19] including subject and tooth level, we structured the text slightly differently for readability.
For the subject-level analysis of the primary outcome, orofacial pain as an ordinal variable, the limiting sample size m was clearly less than the total sample size n [20]. This did not allow for ordinal regression specified in the protocol. To strike a balance between the limiting sample size m (m = 16 for the primary outcome), the guidelines’ requirements, the smallest possible deviation from the study protocol, fulfilling the model assumptions, and ensuring efficiency aspects, we decided to use the linear regression model (m = n = 49 unless stated otherwise). Using splines for continuous covariates addressed the most important mathematical model assumption of the linear regression model. [21, 22]. Nevertheless, we addressed the heteroscedasticity and lack of normality of the residuals using the robust HC3 or Efron variance estimator, which is recommended for small sample sizes [20].
Thus, the linear model allowed for nine degrees of freedom. According to the study protocol, these degrees of freedom were spent for treatment, sex, age, centers, and baseline pain. However, we deviated from the protocol by not including school education in the model. In line with the study protocol, we modeled age using “restricted cubic splines (RCS) with 3 knots, which requires 2 coefficients”. RCS were not applicable for including baseline pain in order to gain efficiency. Instead, we used a linear spline at pain level one. For secondary outcomes on subject-level, we used the same model, but with the corresponding baseline values. However, the baseline values of PSQI and ESS, were modeled using RCS with 3 knots. For titration (n = 34), treatment was adjusted for sex, linear age, and centers (6 degrees of freedom).
The change in the number of pixels between the baseline and one-year follow-up examination was analyzed using linear multilevel models, including 37 patients and 475 teeth combined for both MADs and in separate analyses. The model included group, study center, sex, age, tooth type, and tooth status, as well as the interaction between group and tooth type in additional analyses. Age was modeled using RCS with three knots. Less critical model assumptions, such as homoscedasticity and normality of residuals, showed some deviations[21]. Therefore, small-sample correction according to Kenward and Roger [23] was applied, especially since robust variance estimates are only recommended when at least 42 clusters (patients) are available [19].
Any change in the number of contacts between the baseline examination and the one-year follow-up was analyzed using an ordinal multilevel model for 37 patients and 475 teeth in the combined analysis. The model included the same variables as the model for the analysis of the pixel count. Separate analyses for each MAD were performed accordingly.
As only the 16 dropouts (Fig. 3) for whom an outcome was not observed (but no patients for protocol violations) were excluded from the analysis, the analyses presented address the intention-to-treat principle albeit in a less strict interpretation. This principle also applies to the occlusal analysis, as ‘missing at random’ can be assumed for the additional 12 patients with missing occlusal values (Fig. 3) [20]. This was addressed using multilevel models, which can handle ‘missing at random’ data, unlike simple linear regression [20].Fig. 3. Flow chart of the study population eligible for occlusal analyses, one-year follow up
The exact Wilcoxon signed-rank test was used for paired observations between baseline and 12 months.
The data were analyzed using Stata/MP software, version 17.0 (Stata Corporation, College Station, TX, USA).
Results
Of the 65 subjects initially enrolled, 49 patients were available for reevaluation after the period of one year, which was considered the full follow-up period. Sixteen of the subjects dropped out of the study at an early stage. (Fig. 3). A further twelve patients were excluded during data processing due to incomplete data (missing or unusable occlusion protocols) resulting in a sample size of 37 patients for the occlusal analysis.
Demographic characteristics of the 37 patients included in the occlusal contact analyses are presented in Table 1.Table 1. Demographic characteristics of participants of the randomized clinical trial “Occlusal changes after one year MAD treatment in OSA Patients”, n = 37VariableMAD 1 (n = 16)MAD 2 (n = 21)Age, yearsMedian52 (44,60)54 (50,64)SexMale12 (75)14 (67)Study center14 (25)5 (24)28 (50)11 (52)33 (19)4 (19)40 (0)0 (0)51 (6)1 (5)Education (highest level) < 10 years school01 (5)10 years school2(12)0 (0) > 10years school4 (25)10 (48)University degree10 (62)10 (48)Marital status Married10 (62)10 (48)Married, living separately0 (0)2 (10)Single4 (25)6 (29)Divorced2 (12)2 (10)Widowed0 (0)1 (5)Household income €4500 (2500–6667)6667 (2750–6667)BMI, kg/m^2^26.2 (24.7–27.9)25.3 (23.4–28.6)AHI, episodes, continuously16.6 (8.6–36.9)15.9 (11.0–26.0)AHI episodes, categorical 0–51 (6)1 (5) > 5–157 (44)9 (43) > 15–303 (19)6 (29) > 305 (31)5 (24)Max. protrusion11.5 (10.0–13.0)10.0 (10.0–12.0)Tooth number26 (23–28)27 (25–28)Missing teeth1 (0; 4)0 (0; 2)Replaced teeth (FPD0 (0; 2)0 (0; 1)Replaced teeth (RPD)0 (0; 0)0 (0; 0)Pain (NRS)0 (0; 0)0 (0; 0)The number (proportion in the group or column percentage) or the median (interquartile range) is given. BMI: body mass index, FPD: fixed partial denture, AHI: apnoe hypopnoe index RDP: removeable partial denture, NRS: numeric rating scale
Orofacial pain as the primary outcome
Based on the 95% CI, the data are consistent with a true group difference (MAD 2—MAD 1) in means between −0.06 and 0.57 (point estimate of 0.26; P = 0.107), which is basically a “state of we do not know”. In MAD 1, the single pain level above zero at baseline changed from one to zero after one year, as did the remaining levels (n = 22; P = 1). In MAD 2, four pain levels were above zero at baseline (with a maximum of six), and six pain levels were above zero after one year (with a maximum of three) (n = 27; P = 0.953).
Secondary outcomes – pain variables
The data for muscle pain with palpation are consistent with a true group difference in means between −0.61 and 0.41 for the 95% CI (point estimate of −0.10; P = 0.685). In MAD 1, the single palpation site at baseline did not occur after one year, as were the remaining subjects without pain (P = 1). In MAD 2, three subjects had at least one palpation site at baseline (with a maximum of six sites in one subject), and three subjects had at least one palpation site after one year (with a maximum of 12 sites in one subject) (P = 0.500).
TMJ pain with palpation did not occur after one year. At baseline, no pain occurred in MAD 1. In MAD 2, two subjects experienced pain at three palpation sites (P = 0.500 for the within group comparison).
Secondary outcomes – sleep related variables and OHIP
The group difference was 0.88 for the PSQI (95% CI: −0.54 to 2.30; P = 0.216; n = 47), −0.17 for the ESS (95% CI: −1.69 to 1.35; P = 0.818; n = 47), and 0.42 for the OHIP (95%: −0.49 to 1.32; P = 0.357; n = 47). The sample size was too small for modeling AHI and ODI (n = 22 and n = 18, respectively).
For the PSQI the observed values were 5 (4–8) at baseline and 4 (3–6) after one year (P = 0.035; n = 47). For the ESS the corresponding values were 6 (3–9) and 5 (3–7) (P < 0.001; n = 47).
For the OHIP, the corresponding values were 0 (0–2); and 0 (0–2), P = 0.677; n = 47). Overall a reduction in the AHI from 14 (10–24.1) events per h to 4.6 (2–7.4) events per h was observed (P < 0.001; n = 22). There was also a decrease in the ODI (n = 18) from 10.3 (0–19.9) to 2.9 (0.8–6.6) (P = 0.001; n = 18).
Titration
Regarding final length of the lower jaw advancement the modeled treatment difference was −0.39 (95% CI: −0.97 to 0.18; P = 0.171; n = 34), with observed values of 5.25 mm (5–6.5) and 5 mm (5–5) in groups 1 and 2, respectively.
Secondary outcomes – occlusal variables
Table 2 shows the median and interquartile range of the pixels that represent the contact areas of the occluding teeth determined by the GEDAS at baseline and at one year follow up. Pixels are calculated per tooth type of the upper jaw and summed up for the left and right sides.Table 2. Pixel count (according to image resolution of 300 dpi) of occluding teeth (right and left sides pooled) determined by GEDAS at baseline and one year follow up for 475 observations/teeth (37 patients) MAD 1and 2 combined and separateCombined MAD 1 + MAD 2MAD 1MAD 2BaselineOne year follow upBaselineOne year follow upBaselineOne year follow upTooth type (FDI notation)MedianIQRMedianIQRMedianIQRMedianIQRMedianIQRMedianIQR130.50–187.8160–142.2350–180.500–112190–237.5160–228.5235.00–157100–82350–13520–76.532.50–156.8140–101.23117.00–312770–2091120–181.5860–187175.50–444710–2464458.0134–7692193–525258.547.5–471.2173.50–378.8663250–877.535072.5–720.55502.080.5–953.51941.5–500.527820.5–61916610–342.5736.5189.2–1247.8212.50–668.26643.0113–1705429146–95539636–1155.536570.5–686.51343160–2234669245–13937717.0132–153649360–1073.5717310–1232470155–10067688.75–2641495.547.5–1211.2FDI: Federation Dentaire Internationale, IQR: interquartile range
Table 3 shows the total number of contacts between the occluding teeth, as determined by Shimstock-foil in maximal intercuspidation at baseline and the one-year follow-up. Contacts are given for teeth in the upper jaw per tooth type summarized for the right and left side.Table 3. Number of contacts of occluding teeth (right and left sides pooled) determined by Shimstock-foil in maximal intercuspidation at baseline and one year follow up for 475 observations/teeth (37 patients), MAD 1and 2 combined and separatelyCombined: MAD 1 + MAD 2N = 475 (37 patients)MAD 1N = 207 (16 patients)MAD 2N = 268 (21 patients)BaselineOne year follow upBaselineOne year follow upBaselineOne year follow upTooth type (FDI notation)No contactContactNo contactContactNo contactContactNo contactContactNo contactContactNo contactContact1313925451318112018211425235342445171411201820132532840155313181021152253241059960624525435435596214575265264369316960145562252333893275541049223223331826Total12734811136462145491586520362268FDI: Federation Dentaire Internationale
Table 4 shows the changes in the number of pixels between the baseline and the one-year follow up, as determined with the GEDAS system in combined and separate analyses for MAD 1 and MAD 2. A linear regression model is presented for each tooth type summarized for the right and left sides, with the first incisor serving as the reference. Third molars were excluded from the analysis. This analysis corresponds to an observational study because tooth type, rather than treatment, was the exposure of interest. There was no evidence against the hypothesis of zero pixel change for the second incisor, canine and first premolar (P > 0.05). A significant drop in pixels was observed in the second premolar, first molar, and second molar (P < 0.05).Table 4. Linear multilevel model for changes in number of pixels (right and left sides pooled) between baseline and one year follow up. Combined and separate analyses for MAD 1 and MAD 2, coefficients, 95% confidence intervals (CI) and P values are givenCombined: MAD 1 + MAD 2N = 475 (37 patients)MAD 1N = 207 (16 patients)MAD 2N = 268 (21 patients)VariableCoefficient95% CIP valueCoefficient95% CIP valueCoefficient95% CIP valueTooth type (FDI notation)1 reference---2−15.4−199.4 – 168.50.869−1.9−256.8 – 252.90.988−32.9−269.3 – 230.60.8063−55.7−240.6 – 129.10.55431.0−223.7 – 285.80.810−125.4−390.5 – 139.80.3524−102.9−291.9 – 85.00.285−13.8−278.8 – 250.40.918−154.0−423.9 – 115.90.2625−265.7−449.7 – −81.80.005−86.5−344.9 – 171.90.509−410.3−671.0 – −149.60.0026−412.3−508.6 – −226.1 < 0.001−367.5−637.3 – 97.60.007−466.4−726.2 – −206.60.0017−388.8−583.6 – −194.8 < 0.001−310.5−586.8 – 34.20.027−458.2−732.3 – −184.00.001MAD design−140.3−366.4 – 85.70.214-----Adjusted for sex, age, tooth status (present, removable replaced, fixed replaced) and, study center, FDI: Federation Dentaire Internationale
The global (joint) tests over tooth type were significant for both designs (MAD 1: P = 0.018, MAD 2: P < 0.001). MAD design, included as a confounder, showed an uncertain effect (95% CI: −366.4 to 85.7, P = 0.214). Separate analyses revealed a significant change for the second premolar in MAD 2 but not in MAD 1. Furthermore, the interaction between MAD design and tooth type showed a large P value of 0.630, thereby supporting the pooled analysis.
Table 5 shows the ordinal regression model for changes in the number of interdental contacts from baseline to the one-year follow up determined with Shimstock-foil. In the combined analysis, the second incisors and canines showed an insignificant tendency for an increase of contacts, whereas second premolars and molars displayed significantly fewer contacts after one year. Except for tooth status (present teeth or fixed restorations, P < 0.05), none of the other confounders reached significance.Table 5. Ordinal multilevel model for changes in number of interdental contacts (right and left sides pooled) between baseline and one year follow up. Combined and separate analyses for MAD 1 and MAD 2, coefficients, 95% confidence intervals (CI) and P values are givenCombined MAD 1 + MAD 2N = 475 (37 patients)MAD 1N = 207 16 patientsMAD 2N = 268 (21 patients)VariableCoefficient95% CIP valueCoefficient95% CIP valueCoefficient95% CIP valueTooth type (FDI notation)1 reference---20.43−0.44 – 1.290.5720.76−0.54 – 2.060.2540.14−1.01 – 1.300.80630.62−0.24 – 1.480.1570.19−1.14 – 1.540.7750.87−0.25 – 1.990.1284−0.85−1.76 – 0.050.066−1.11−2.54 – 0.310.126−0.55−1.77 – 0.650.3685−1.21−2.11 – −0.320.008−1.06−2.46 – 0.330.137−1.45−2.65 – −0.250.0176−1.24−2.15 – −0.340.007−0.83−2.30 – 0.640.268−1.59−2.79 – −0.400.0097−1.25−2.20 – −0.300.010−0.95−2.44 – 0.530.208−1.56−2.82 – −0.300.015MAD design−0.11−0.90 – 0.680.787------Adjusted for sex, age, tooth status (present, removable replaced, fixed replaced), and study center, FDI: Federation Dentaire Internationale
In separate analyses, MAD 1 in contrast to MAD 2, did not reveal a significant drop of contacts in premolars and molars, MAD 1 and MAD 2, however, showed small P values for the global (joint) tests over tooth type (MAD 1 P = 0.102; MAD 2, P < 0.001). According to modern interpretations of P values, it is not advisable to consider a difference between ‘significant’ and ‘not significant’ as significant in itself [24]. Furthermore, the interaction between MAD design and tooth type showed a large P value of 0.573, thereby supporting the pooled analysis.
Discussion
We did not record relevant levels of orofacial pain at baseline or in the follow up examination in both MADs. Due to these low pain levels and the low sample size, analysis of group differences resulted in a state of we don’t know. The retention of low levels or just transient increase of orofacial pain and tenderness in the masticatory muscles and the TMJ, however, was described previously [25]. In general, TMD-like symptoms do not appear to worsen with the use of MADs [26].
The effect of both MADs on somnological parameters was similar to that in previous studies [27, 28]. AHI, ODI, ESS and PSQI were significantly reduced. Oral health-related quality of life did not change over time. Improvement of somnological variables indicates that both MADs might have routinely used by the patients.
This is the first study to apply the GEDAS analysis for longitudinal assessment of occlusal alterations in patients treated with MAD for OSA or snoring. After one year of MAD treatment, we observed a measurable decrease in posterior tooth occlusal contacts. None of the confounders included in the combined GEDAS analysis were significant. That means that both MAD designs with 2 mm vs. 5 mm increase in vertical dimension influenced occlusion in similar manner. All patients were trained to perform mandibular exercises in order to prevent pain and maintain posterior contacts [2, 12]. Occlusal side effects, however, could not be prevented.
With exception of the second premolar, separate analyses confirmed the combined analysis determined with the GEDAS system. GEDAS, first reported in 2006, has proven to be a reliable and highly reproducible method for localizing static contacts during intercuspation [17, 29]. It has also been used to identify occlusal contact point patterns in a large-scale study [30].
The results of GEDAS were partly confirmed by interdental contact tests using Shimstock-foil. A lower number of observations in the MAD 1 group may also count for insignificance of posterior contact change. Shimstock-foil, in general suitable for clinical measurements of occlusal contacts in the intercuspal position, provides only a qualitative yes/no decision per tooth pair [31]. It might be not as sensitive for the detection of initial occlusal changes as GEDAS. Further studies with higher power are necessary to investigate this question.
There is strong evidence for dental changes during long-term MAD therapy for OSA patients [9, 32]. Reviews and meta-analyses of randomized controlled trials and non-randomized studies consistently report dento-skeletal remodeling of the intermaxillary relationship. Overbite and overjet decrease mainly due to retroclination of the upper incisors and proclination of the lower incisors. Over time, the lower jaw might undergo clockwise rotation during MAD therapy [9, 32].
Several studies have described infraocclusion in the premolar and molar areas evaluating dental casts after two to ten years of observation [11, 33]. Short-term observation over a period of three months, however, did not establish dental or skeletal changes [28]. In our study we established a loss of posterior contacts yet after one year with digitalized silicone bites and for the MAD 2 also with Shimstock-foil. Posterior open bite might appear immediately after starting the MAD therapy, regardless of preventive interventions, such as jaw exercises. These preventive procedures do not seem to arrest occlusal side effects, and the use of morning occlusal guides to re-adjust mandibular jaw position was not successful in preventing changes in incisor inclination in 23 MAD patients after one year of therapy [34].
Since occlusal changes appeared independent of preventive procedures, a comprehensive education instruction for the patients is necessary. Mostly patients are unaware of small occlusal changes because discomfort due to occlusal discrepancies only occurs after longer periods of time [9]. In the beginning, minor occlusal changes do not seem to be of clinical relevance. At an early stage within the first year of treatment, it is unlikely that patients feel impaired and therapists detect occlusal discrepances, especially if just standard methods as Shimstock-foil are applied. Control appointments with occlusal check-ups should be routinely performed for longer periods. After years of MAD therapy, however, dentists, sleep medicines and patients have to evaluate which effects have a deeper impact on quality of live for the respective patient – changes in occlusion or the consequences of sleep apnea [2].
Study limitations
The main limitation of the study was the small sample size for the primary outcome, which resulted in deviations from the pre-specified analysis. Main reason for this was the outbreak of the COVID-19 pandemic in Germany at the time of subject recruitment. Only five of the nine study centers were able to contribute patients to the study. Furthermore, MAD therapy was not covered by statutory health insurance at that time, so patients or private insurances had to cover the costs. The pandemic-associated economic crisis in Germany, may have reduced patients' willingness to accept additional financial burdens, further impacting the number of participants. Another drawback, is the inability to measure patient adherence to the exercise and morning occlusal guide protocol, as well as to the MAD. Due to the study setting and the pandemic, it was not feasible to control patient adherence to the training program or employ more expensive types of MAD with integrated micro‐recorder chips. Since tooth type was the focus in the analyses of occlusion, study results have merely observational character. Furthermore, generalizability is limited by the low pain levels observed and the high socio-economic status of the participants. Finally, regression to the mean might also have an influence on measurements [35].
Strength of the study
Occlusal discrepancies were measured using an innovative digital analysis system based on silicone impressions. This method enabled a blinded analysis of occlusal contact situations [17].
Conclusions
For comparing pain in MAD groups, more data will be needed to pool in meta-analyses. Regarding the treatment effect for OSA and snoring, both MAD designs were successful in terms of objective and subjective measures (overall reduction of AHI, ODI, ESS and PSQI). Loss of interocclusal contacts in posterior teeth could not be prevented by jaw exercises or the use of an occlusal guide. The GEDAS analysis seems to be suitable for longitudinal tracking of interocclusal contacts.