The effects of plyometric training on physical fitness in adolescent team sports: a systematic review and meta-analysis
Fengming Zhang, Yang Liu, Jiale Liu, Oleksandr Yeremenko, Lei Shi

TL;DR
Plyometric training improves jump performance, sprint speed, and change-of-direction in adolescent team-sport athletes, with optimal results for those aged 16–18.99 and training durations of 8–10 weeks.
Contribution
This study provides a systematic review and meta-analysis showing specific physical performance improvements from plyometric training in adolescents.
Findings
Plyometric training significantly improves jump performance and sprint speed in adolescent athletes.
Training durations of 8–10 weeks yield more consistent gains in specific physical metrics.
Increasing the total number of jumps does not consistently enhance training outcomes.
Abstract
This systematic review and meta-analysis examined the effects of plyometric training (PT) on the physical fitness of adolescent team-sport athletes. We systematically searched the PubMed, Web of Science, Scopus, and Embase databases. The methodological quality of the studies was evaluated using the Cochrane Risk of Bias Tool (ROB-2). Meta-analyses were conducted using RevMan 5.4 and STATA 15.0. A total of 31 studies involving 1,033 athletes (906 males and 127 females) were ultimately included. PT improved jump performance, including countermovement jump (ES = 0.89), countermovement jump with arms (ES = 1.00), squat jump (ES = 0.48), and standing long jump (ES = 1.10). PT also improved linear sprint over ≤10-m (ES = −0.59), 20-m (ES = −0.42), and 30-m (ES = −0.97), and improved change-of-direction (ES = −0.73). Plyometric training can significantly improve the jumping performance,…
Click any figure to enlarge with its caption.
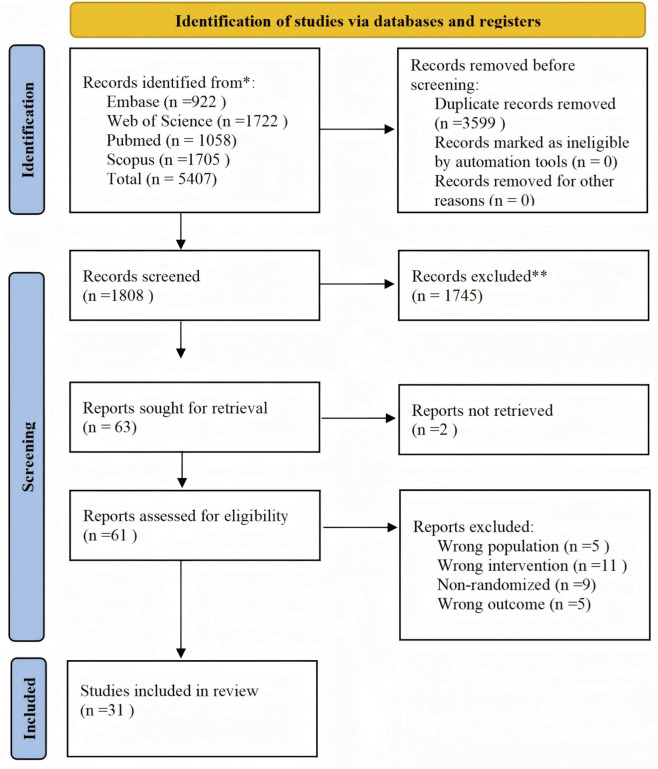 FIGURE 1
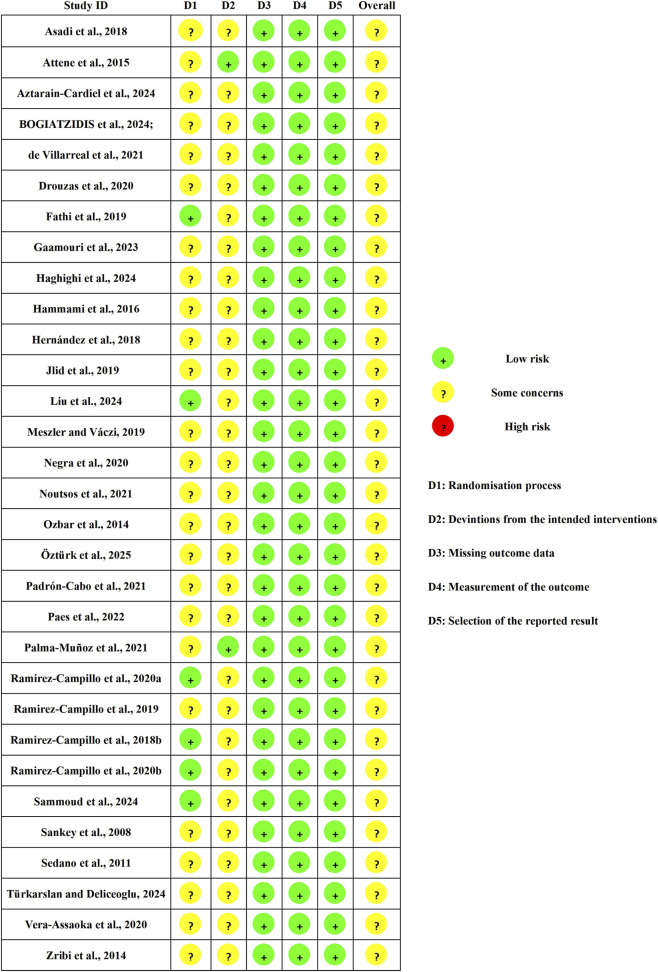 FIGURE 2
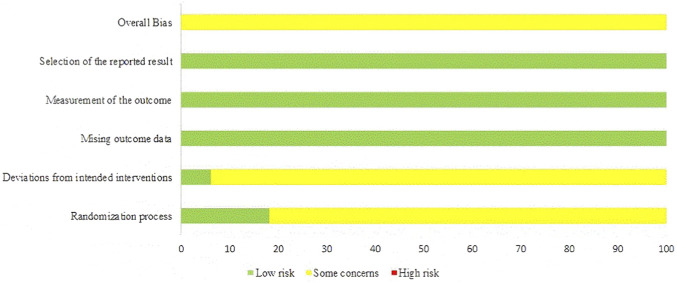 FIGURE 3
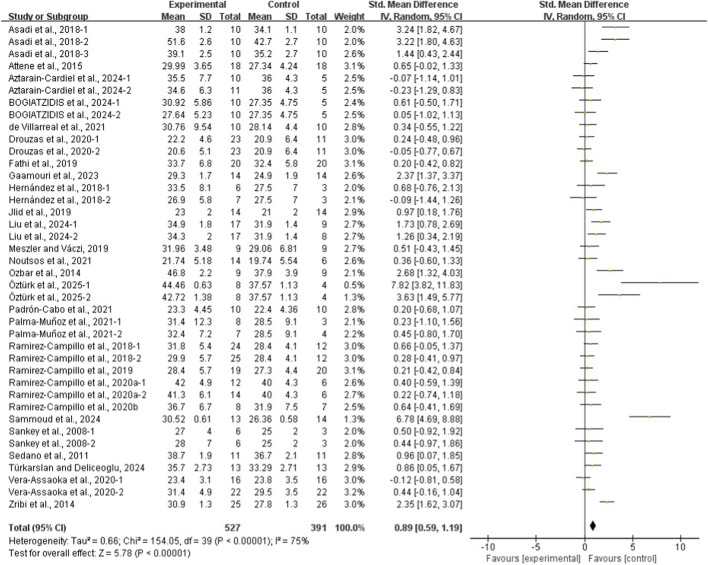 FIGURE 4
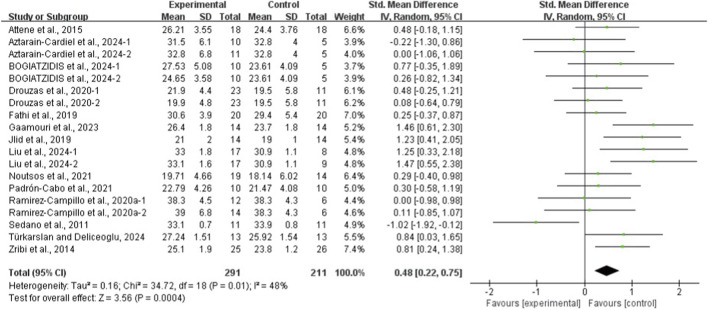 FIGURE 5
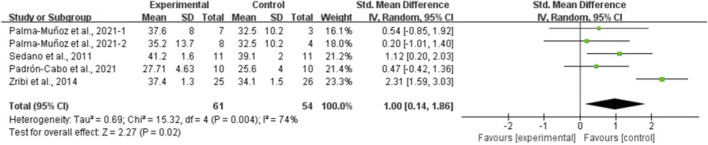 FIGURE 6
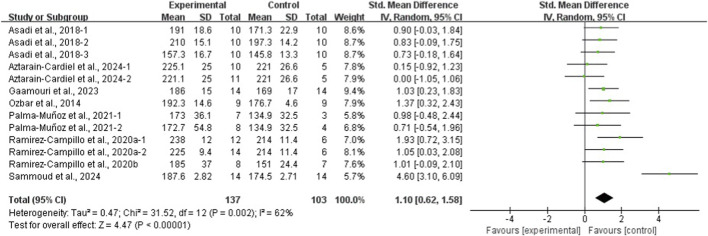 FIGURE 7
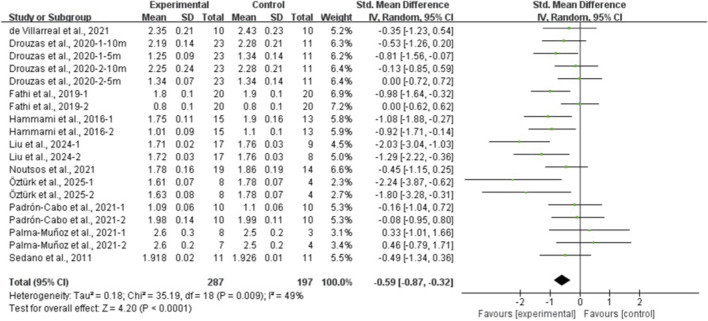 FIGURE 8
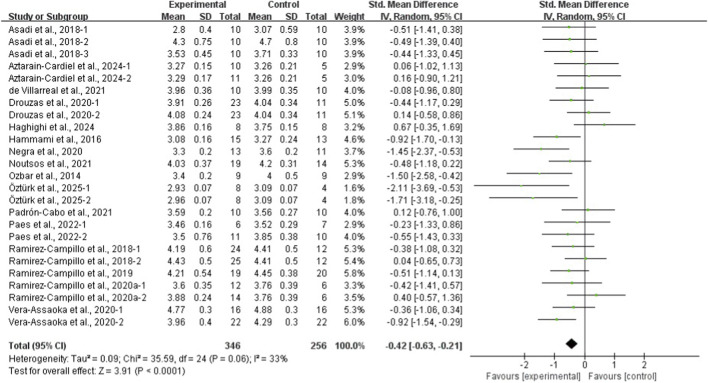 FIGURE 9
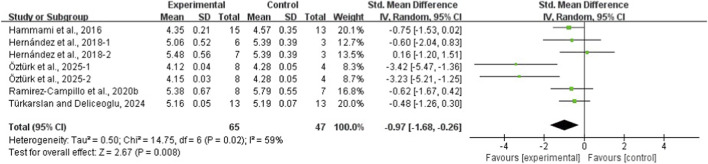 FIGURE 10
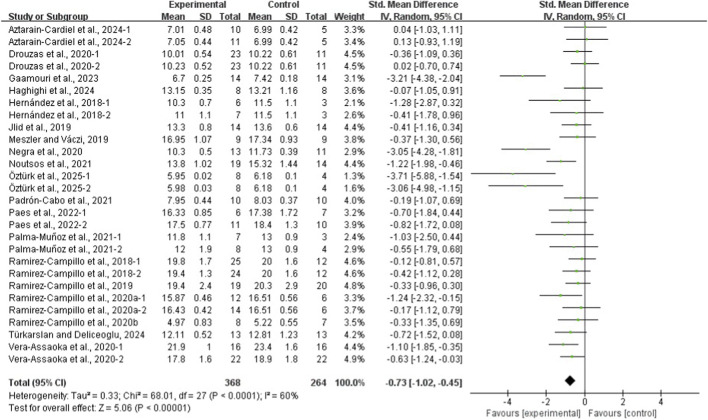 FIGURE 11
| Category | Inclusion criteria | Exclusion criteria |
|---|---|---|
| Population (P) | Healthy adolescent team-sport athletes aged 10–19 years (e.g., basketball, football/soccer, handball, volleyball, | Adolescent team athletes who are over the age limit or have health problems such as injuries or recent surgery |
| Intervention (I) | At least 4 weeks of PT. The experimental group must add PT to usual sport-specific training; PT primarily involves SSC-based lower-limb explosive jump drills (e.g., jumps/hops/bounds, drop/depth jumps, reactive jumps). The control group receives only conventional specialized training, similar to that of the experimental group, without any plyometric training | Duration under 4 weeks; Interventions combining PT with other training modalities (e.g., strength training, sprint training, aerobic training, agility training, or upper-body plyometric training) |
| Comparison (C) | Active control: Usual team-sport training or general physical conditioning, without additional plyometric training | Lack of active control |
| Outcome (O) | Include results from at least one physical fitness measure listed below: Countermovement jump (CMJ), countermovement jump with arms (CMJA), standing long jump (SLJ), ≤10-m linear sprint, 20-m linear sprint, 30-m linear sprint, or change-of-direction (COD) | Incomplete data reporting; presented solely in graphical format with no extractable data |
| Study design (S) | Randomized controlled trial (RCT) | Non-randomized trials; non-controlled studies; single-group pre-post designs; observational studies; and secondary research (reviews, meta-analyses, and study protocols) |
| References | Participants characteristics | Intervention | Control | Characteristics of intervention | Measurements | Outcome | ||||
|---|---|---|---|---|---|---|---|---|---|---|
| Train content | L/F/D | Volume | Season | Time | Groups | |||||
|
| N = 31; TB:7.6 ± 1.3years; S:M | PT | Basketball | MIX | L: 6 weeks F: 2 sessions/week D:NR | E.G.,1:80-128 per session 1,184 in total, E.G.,2:40-64 per session 592 in total | In-season | CMJ, SJ, SLJ, 20 m Sprint, COD ability (V-Cut) | E.G.,1 and, E.G.,2: CMJ, SJ, SLJ ↑, others ↔; CG: all ↔ | CMJ, SJ ↑, others ↔ in, E.G.,1 and, E.G.,2 vs. CG |
|
| N = 51; TB:2.5 ± 0.5; S:M | PT | Basketball | V-JUMP | L: 9 weeks F: 2 sessions/week D:15–25 min | 60–100 per session | In-season | 5 m,30 m sprint, CMJ, SJ, CMJA, SLJ (5jumps) | E.G.,:5 m,30 m Sprint, CMJ, SJ, CMJA ↑, others ↔; CG: All ↔ | 5 m,30 m Sprint, CMJ, SJ, CMJA↑, others ↔ in, E.G., vs. CG |
|
| N = 22; TB:NR; S:M | PT | Basketball | MIX | L: 6 weeks F: 2 sessions/week D:15–26 min | E.G.,1:60 per session | In-season | CMJ, CMJA, SLJ, 10 m Sprint, COD ability (T-test) | E.G.,1: COD ↑, others ↔; E.G.,2: CMJ, CMJA, SLJ, 10 m Sprint, COD ↑, others ↔ | All ↔ in, E.G.,1 vs. CG; SLJ, CMJ, CMJA ↑, others ↔ in, E.G.,2 vs. CG |
|
| N = 36; TB:NR; S:FM | PT | Basketball | MIX | L: 6 weeks F: 2 sessions/week D:20 min | 67-126 per session | NR | CMJ, SJ | E.G.,: All ↑ | CMJ and SJ ↑ in, E.G., vs. CG |
|
| N = 20; S:M, A = 14.2 ± 1.3years | PT | Basketball | MIX | L: 7 weeks F: 2 sessions/week D:20 min | 140-180 per session 1,340 in total | In-season | CMJ, CMA, COD ability (Zig-zag 10 m),10 m,20 m Sprint | E.G.,: CMJ, CMJ↑, others ↔; CG: all ↔ | COD↑, Others↔ in, E.G., vs. CG |
|
| N = 34; TB:NR; S:M and FM | PT | Basketball | MIX | L: 6 weeks F: 2 sessions/week D:30–60 min | 50-100 per session | Pre-season | 20 m Sprint, COD ability (Illinois agility test) | E.G.,: All ↑ | NR |
|
| N = 19; TB:5 years at least; S:M | PT | Basketball | MIX | L: 7 weeks F: 2 sessions/week D:NR | 71-170 per session | In-season | CMJ,20 m,30 m sprint, COD (T-test) | E.G.,1 and, E.G.,2: All ↑ | All ↑ in, E.G.,1 and, E.G.,2 VS CG |
|
| N = 16; S:FM | PT | Basketball | MIX | L: 6 weeks F: 2 sessions/week D:NR | 63-108 per session | Pre-season | 20 m sprint, COD (lane agility drill) | E.G.,: All ↑ | 20mSprint↑, Others↔ in, E.G., vs. CG |
|
| N = 18; TB:5 years at least; S:FM | PT | Basketball | MIX | L: 7 weeks | 40–100 per session | In-season | CMJ, COD (T-test, IAT) | E.G.,: CMJ↓, others ↔; | NR |
|
| N = 60; TB:2 years at least; S:M | PT | Soccer | V-JUMP | L: 6 weeks | 60 per session | NR | CMJ, SLJ,20 m sprint | E.G.,: all↑ | NR |
|
| N = 28; TB:NR; S:M | PT | Soccer | V-JUMP | L: 8 weeks | 35-70 per session | Pre-season | 5 m,10 m,20 m,30 m sprint, COD (the sprint 9-3-6-3-9 m withS180°turns and backward and forward running) | E.G.,:5 m,10 m,20 m sprint ↑ | 5 m Sprint↑, others ↔ in, E.G., VS CG |
|
| N = 24; TB: 5.0 ± 1.3; S:M, E.G.,: A = 12.7 ± 0.2years, H = 158.6 ± 4.5 cm | PT | Soccer | MIX | L: 8 weeks | 50-120 per session | In-season | 20 m sprint, COD (T-test) | E.G.,: All ↑ | 20 m Sprint, COD ↑ in, E.G., VS CG |
|
| N = 18; S:FM | PT | Soccer | MIX | L: 8 weeks | 90-220 per session | In-season | CMJ, SLJ,20 m Sprint | E.G.,: All ↑ | All ↑ in, E.G., vs. CG |
|
| N = 20; S:M, TB: 5.52 ± 1.21year | PT | Soccer | H-JUMP | L: 6 weeks | 24-56 per session | In-season | CMJ, CMJA, SJ, COD (IAT) | E.G.,:CMJ, CMJA ↑, others ↔; CG: All ↔ | CMJA, others ↔ in, E.G., vs. CG |
|
| N = 22; S:M | PT | Soccer | MIX | L: 10 weeks | 80-130 per session | In-season | CMJ, CMJA, SJ,10 m sprint | E.G.,: All ↑ | NR |
|
| N = 38; S:M | PT | Soccer | MIX | L: 7 weeks | E.G.,1and, E.G.,2: 69-240 per session 2,334 in total | In-season | CMJ, SLJ, SJ,20 m sprint, COD (Illinois) | E.G.,: All ↑ | All ↑ in, E.G.,1 vs. CG; |
|
| N = 28; S:M | PT | Soccer | MIX | L: 6 weeks | 54-124 per session | Pre-season | CMJ, SJ, COD (T-test) | E.G.,: All ↑ | All ↑ in, E.G., vs. CG |
|
| N = 68; S:M | PT | Soccer | MIX | L: 10 weeks | E.G.,1 and, E.G.,2: 60-120 per session | Pre-season | CMJ, SJ, SLJ,5 m,10 m,20 m sprint, COD (T-test) | E.G.,1: SLJ, CMJ,5 m Sprint, COD ↑, others ↔ | NR |
|
| N = 30; S:M | PT | Soccer | E.G.,1: V-JUMP | L:12 weeks | 40-65 per session | In-season | CMJ, SJ | E.G.,1:E.G.,: All ↑ | All ↑ in, E.G.,1 and, E.G.,2 vs. CG |
|
| N = 51; TB = 4.9 ± 2.9 years; S:M | PT | Soccer | H-JUMP | L: 8 weeks | E.G.,1: 34-48 per session | NR | CMJ, SJ, 10 m sprint | E.G.,: All ↑ | All ↑ in, E.G.,1 and, E.G.,2 vs. CG |
|
| N = 27; TB = 5.0 ± 1.1 years S:M | PT | Soccer | MIX | L: 6 weeks | 50-120 per session | In-season | CMJ, SLJ, COD (505 test) | E.G.,: All ↑ | All ↑ in, E.G., vs. CG |
|
| N = 26; TB:NR, S:M | PT | Soccer | MIX | L: 8 weeks | 96-180 per session | NR | CMJ, SJ, 30 m sprint, COD (T-test) | E.G.,: All ↑ | All ↑ in, E.G., vs. CG |
|
| N = 24; S:M | PT | Soccer | MIX | L: 8 weeks | NR per session | In-season | CMJ, 10m, 20m, 30 m sprint, COD (zigzag) | E.G.,1 and, E.G.,2: All ↑ | All ↑ in, E.G.,1 and, E.G.,2 vs. CG |
|
| N = 39; TB: 2 years at least, S:M | PT | Soccer | MIX | L: 7 weeks | 60 per session | In-season | CMJ, 20 m sprint, COD (Illinois) | E.G.,: All ↑ | All ↑ in, E.G., vs. CG |
|
| N = 15; TB: 3 years at least, S:M | PT | Soccer | V-JUMP | L: 8 weeks | 40-70 per session | In-season | CMJ, SJ, 30 m sprint, COD (Meylan test) | E.G.,: All ↑ | All ↑ in, E.G., vs. CG |
|
| N = 76; TB:3 years at least, S:M | PT | Soccer | V-JUMP | L: 7 weeks | 60 per session | In-season | CMJ, 20 m sprint, COD (Illinois) | E.G.,1: CMJ, COD ↑, others ↔ | 20 m Sprint, COD |
|
| N = 73; TB: 2 years at least S:M | PT | Soccer | V-JUMP | L: 7 weeks | 48-90 per session | In-season | CMJ, 20 m sprint, COD (Illinois) | E.G.,1: CMJ, COD, others ↔ | CMJ, COD ↑, others ↔ in, E.G.,1 vs. CG |
|
| N = 28; TB: 5 years at least, S:FM | PT | Handball | MIX | L: 10 weeks | 60-90 per session | In-season | CMJ, SJ, SLJ, COD (T-test) | E.G.,: All ↑ | All ↑ in, E.G., vs. CG |
|
| N = 33; TB: 2 years at least, S:M | PT | Handball | MIX | L: 6 weeks | 144 per session | In-season | CMJ, SJ,10m, 20 m Sprint, COD (T-test) | E.G.,: COD ↑, others ↔ | NR |
|
| N = 18; TB: NR; S:M | PT | Rugby | E.G.,1: V-JUMP | E.G.,1 and, E.G.,2 | E.G.,1:110 per session | In-season | CMJ | E.G.,: All ↑ | NR |
|
| N = 40; TB:NR, S:M | PT | Volleyball | V-JUMP | L: 16 weeks | 24-50 per session | Pre-season | CMJ, SJ,5 m,10 m sprint | E.G.,: All ↑ | All in, E.G., vs. CG ↔ |
| Quality assessment | |||||||
|---|---|---|---|---|---|---|---|
| Number of studies (Participants) | Study design | Risk of bias | Inconsistency | Indirectness | Imprecision | Other considerations | Quality |
| Countermovement jump | |||||||
| 27 (931) | RCT | Serious | serious | No | serious | Publication bias | ⨁◯◯◯ |
| Squat jump | |||||||
| 14 (502) | RCT | Serious | NO | NO | serious | NO | ⨁⨁◯◯ low |
| Countermovement jump with arms | |||||||
| 4 (115) | RCT | Serious | serious | NO | serious | Publication bias | ⨁◯◯◯ |
| Standing long jump | |||||||
| 8 (240) | RCT | Serious | serious | NO | serious | Publication bias | ⨁◯◯◯ |
| ≤10-m linear sprint | |||||||
| 10 (484) | RCT | Serious | serious | NO | serious | NO | ⨁⨁◯◯ low |
| 20-m linear sprint | |||||||
| 16 (602) | RCT | Serious | NO | NO | serious | NO | ⨁⨁◯◯ low |
| 30-m linear sprint | |||||||
| 5 (112) | RCT | Serious | serious | NO | serious | Publication bias | ⨁◯◯◯ |
| Change-of-direction | |||||||
| 19 (632) | RCT | Serious | serious | NO | serious | Publication bias | ⨁◯◯◯ |
| Fitness attribute | na | ES (95%CI) | p (Overall effect) | p (Heterogeneity) | I2 (%) | RW (%) | Egger’test (p) |
|---|---|---|---|---|---|---|---|
| Countermovement jump | 27,40,30,931 | 0.89 (0.59–1.19) | <0.001 | <0.001 | 75 | 0.5–3.2 | 0.001 |
| Countermovement jump with arms | 4,54,115 | 1.00 (0.14–1.86) | = 0.02 | 0.004 | 74 | 16.1–23.3 | NR |
| Squat jump | 14,19,14,502 | 0.48 (0.22–0.75) | <0.001 | 0.01 | 48 | 3.7–7.4 | 0.636 |
| Standing long jump | 8,13,10,240 | 1.10 (0.62–1.58) | <0.001 | 0.002 | 62 | 5.7–9.4 | NR |
| ≤10-m linear sprint | 10,19,14,484 | −0.59 (−0.87 to −0.32) | <0.001 | 0.009 | 49 | 2.3–7.2 | 0.215 |
| 20-M linear sprint | 16,25,20,602 | −0.42 (−0.63 to −0.21) | <0.001 | 0.06 | 33 | 1.6–6.0 | 0.415 |
| 30-M linear sprint | 5,75,112 | −0.97 (−1.68 to −0.26) | 0.008 | 0.02 | 59 | 8.3–20.1 | NR |
| Change-of-direction | 19,28,21,632 | −0.73 (−1.02 to −0.45) | <0.001 | <0.001 | 60 | 1.3–4.9 | 0.007 |
| Subgroup | Type | K | n | ES (95%CI) | p (Overall effect) | I2 (%) | p (Heterogeneity) | p (Subgroup difference) |
|---|---|---|---|---|---|---|---|---|
| Countermovement jump | ||||||||
| Age | 10–12.99 | 7 | 220 | 0.48 (−0.01–0.97) | 0.06 | 64 | 0.005 | 0.03 |
| 13–15.99 | 17 | 538 | 0.76 (0.38–1.14) | <0.001 | 74 | <0.001 | ||
| 16–18.99 | 6 | 173 | 1.83 (0.98–2.67) | <0.001 | 77 | <0.001 | ||
| Sex | M | 23 | 831 | 0.82 (0.51–1.13) | <0.001 | 74 | <0.001 | 0.24 |
| FM | 4 | 100 | 1.47 (0.42–2.52) | 0.006 | 79 | 0.002 | ||
| Training duration | ≤7 | 16 | 558 | 0.68 (0.34–1.02) | <0.001 | 69 | <0.001 | 0.009 |
| ≥8 < 10 | 6 | 195 | 1.92 (1.15–2.70) | <0.001 | 73 | <0.001 | ||
| ≥10 | 5 | 220 | 0.56 (0.03–1.08) | 0.04 | 70 | 0.002 | ||
| Total number of jumps | ≤800 | 5 | 158 | 1.32 (0.51–2.13) | 0.001 | 78 | <0.001 | 0.45 |
| >800 ≤ 1,400 | 14 | 430 | 0.85 (0.39–1.32) | <0.001 | 76 | <0.001 | ||
| >1,400 | 10 | 343 | 0.73 (0.30–1.16) | 0.001 | 69 | <0.001 | ||
| Squat jump | ||||||||
| Age | 10–12.99 | 5 | 200 | 0.54 (0.22–0.86) | 0.001 | 16 | 0.31 | 0.76 |
| 13–15.99 | 6 | 244 | 0.51 (0.16–0.86) | 0.004 | 24 | 0.24 | ||
| 16–18.99 | 3 | 111 | 0.36 (−0.55–1.27) | 0.44 | 79 | <0.001 | ||
| Training duration | ≤7 | 6 | 185 | 0.35 (0.05–0.65) | 0.02 | 0 | 0.44 | <0.001 |
| ≥8 < 10 | 4 | 156 | 1.08 (0.73–1.42) | <0.001 | 0 | 0.60 | ||
| ≥10 | 4 | 160 | 0.13 (−0.32–0.57) | 0.58 | 42 | 0.12 | ||
| Total number of jumps | ≤800 | 3 | 86 | 0.73 (−0.02–1.47) | 0.06 | 60 | 0.06 | 0.61 |
| >800 ≤ 1,400 | 3 | 92 | 0.30 (−0.11–0.72) | 0.15 | 24 | 0.73 | ||
| >1,400 | 9 | 324 | 0.46 (0.10–0.82) | 0.01 | 58 | 0.01 | ||
| ≤10-m linear sprint | ||||||||
| Training duration | ≤7 | 4 | 115 | −0.17 (−0.54 to 0.21) | 0.38 | 0 | 0.80 | <0.001 |
| ≥8 < 10 | 3 | 131 | −1.35 (−1.76 to −0.95) | <0.001 | 0 | 0.43 | ||
| ≥10 | 3 | 238 | −0.41 (−0.71 to −0.11) | 0.009 | 21 | 0.27 | ||
| Total number of jumps | ≤800 | 4 | 158 | −0.78 (−1.33 to −0.24) | 0.005 | 68 | 0.02 | 0.42 |
| >800 ≤ 1,400 | 4 | 135 | −0.67 (−1.33 to 0.00) | 0.05 | 63 | 0.01 | ||
| >1,400 | 3 | 191 | −0.39 (−0.69 to −0.09) | 0.01 | 0 | 0.68 | ||
| 20-M linear sprint | ||||||||
| Age | 10–12.99 | 6 | 197 | −0.39 (−0.75 to −0.04) | 0.03 | 30 | 0.20 | 0.44 |
| 13–15.99 | 9 | 305 | −0.34 (-0.60 to −0.09) | 0.008 | 13 | 0.32 | ||
| 16–18.99 | 4 | 100 | −0.85 (−1.57 to −0.13) | 0.02 | 60 | 0.03 | ||
| Sex | M | 14 | 547 | −0.42 (−0.62 to −0.21) | <0.001 | 23 | 0.16 | 0.95 |
| FM | 3 | 55 | −0.45 (−1.62 to 0.71) | 0.45 | 76 | 0.02 | ||
| Training duration | ≤7 | 11 | 440 | −0.29 (−0.49 to −0.10) | 0.003 | 0 | 0.66 | <0.001 |
| ≥8 < 10 | 4 | 94 | −1.35 (−1.82 to −0.88) | <0.001 | 0 | 0.66 | ||
| Total number of jumps | ≤800 | 5 | 147 | −0.54 (−0.94 to −0.15) | 0.007 | 26 | 0.23 | 0.37 |
| >800 ≤ 1,400 | 9 | 316 | −0.47 (−0.80 to −0.14) | 0.005 | 45 | 0.04 | ||
| >1,400 | 3 | 139 | −0.19 (−0.55 to 0.16) | 0.29 | 0 | 0.47 | ||
| Change-of-direction | ||||||||
| Age | 10–12.99 | 7 | 224 | −0.85 (−1.50 to −0.19) | 0.01 | 71 | 0.002 | 0.24 |
| 13–15.99 | 11 | 346 | −0.58 (−0.88 to −0.28) | <0.001 | 48 | 0.01 | ||
| 16–18.99 | 2 | 62 | −1.80 (−3.28 to −0.32) | 0.02 | 77 | 0.004 | ||
| Sex | M | 16 | 537 | −0.66 (−0.94 to −0.39) | <0.001 | 51 | <0.001 | 0.82 |
| FM | 4 | 83 | −1.08 (−2.32 to 0.16) | 0.09 | 84 | <0.001 | ||
| Training duration | ≤7 | 13 | 447 | −0.52 (−0.71 to −0.32) | <0.001 | 0 | 0.69 | 0.08 |
| ≥8 < 10 | 4 | 89 | −1.98 (−3.29 to −0.66) | 0.003 | 81 | <0.001 | ||
| ≥10 | 2 | 96 | −1.12 (−2.74 to 0.51) | 0.18 | 91 | <0.001 | ||
| Total number of jumps | ≤800 | 4 | 69 | −1.02 (−2.37 to 0.34) | 0.14 | 82 | <0.001 | 0.63 |
| >800 ≤ 1,400 | 10 | 323 | −0.58 (−0.90 to −0.26) | <0.001 | 41 | 0.05 | ||
| >1,400 | 7 | 240 | −0.83 (−1.34 to −0.32) | 0.002 | 67 | 0.001 | ||
| Covariate | Coefficient | 95%CI | 95%CI | t | p |
|---|---|---|---|---|---|
| Countermovement jump height | |||||
| Intercept | −1.41632 | −4.322483 | 1.489842 | −0.99 | 0.330 |
| Training duration | −0.0329261 | −0.2196788 | 0.1538266 | −0.36 | 0.723 |
| Total ground contacts | −0.0003162 | −0.0011059 | 0.0004735 | −0.81 | 0.422 |
| Age | 0.2112292 | 0.0266013 | 0.395857 | 2.32 | 0.026* |
| Squat jump | |||||
| Intercept | 1.35279 | −0.6153355 | 3.320915 | 1.47 | 0.164 |
| Training duration | −0.0105397 | −0.1121702 | 0.0910909 | −0.22 | 0.828 |
| Total ground contacts | −0.0004846 | −0.0009667 | −2.52e-06 | −2.14 | 0.049* |
| Age | −0.0069975 | −0.1308152 | 0.1168202 | 1.47 | 0.164 |
| ≤10-m linear sprint | |||||
| Intercept | 0.8048927 | −0.9484814 | 2.558267 | 0.98 | 0.343 |
| Training duration | −0.004712 | −0.0968085 | 0.0873846 | −0.11 | 0.915 |
| Total ground contacts | 0.0002311 | −0.0002817 | 0.000744 | 0.96 | 0.352 |
| Age | −0.1186683 | −0.2316182 | −0.0123101 | −2.38 | 0.031* |
| 20-M linear sprint | |||||
| Intercept | 2.183454 | 0.0028397 | 4.364067 | 2.08 | 0.050 |
| Training duration | −0.206024 | −0.3948244 | −0.0172236 | −2.27 | 0.034* |
| Total ground contacts | 0.0004498 | −0.0000189 | 0.0009184 | 2.00 | 0.059 |
| Age | −0.1173318 | −0.2165343 | −0.0181293 | −2.46 | 0.023* |
| Change-of-direction | |||||
| Intercept | 3.288426 | 0.0237177 | 6.553134 | 2.08 | 0.048 |
| Training duration | −0.2815789 | −0.562539 | −0.0006188 | −2.07 | 0.050 |
| Total ground contacts | 0.0001669 | −0.0005559 | 0.0008897 | 0.48 | 0.638 |
| Age | −0.1625591 | −0.3235699 | −0.0015483 | −2.08 | 0.048* |
Peer Reviews
No public reviews on file for this paper yet. If you reviewed it on a platform where reviews are public (OpenReview, ICLR, NeurIPS, ICML), you can paste yours below so the community can read it here.
Videos
No videos yet. Explain this paper in a talk, walkthrough, or lecture? Add one.
Taxonomy
TopicsSports Performance and Training · Sports injuries and prevention · Cardiovascular and exercise physiology
Introduction
1
Team sports such as football, basketball, handball, and volleyball are high-intensity intermittent sports (Stølen et al., 2005; Duncan et al., 2006; Ziv and Lidor, 2009; Abdelkrim et al., 2010), requiring athletes to repeatedly perform high-intensity explosive movements such as jumping, sprinting, sudden stops, and changes of direction, and high-intensity physical contact during the game (Ostojic et al., 2006; Faude et al., 2012; Passos et al., 2017; Taylor et al., 2017). Excellent physical fitness, such as strength, speed, and change of direction, is essential for executing explosive movements and for athletes to maintain peak performance and success in high-level competitions (Stølen et al., 2005; Ostojic et al., 2006; Wagner et al., 2014; Mancha-Triguero et al., 2019). During the critical period of neuromuscular development in adolescence, targeted physical training can not only effectively improve physical fitness, such as strength, speed, and agility, but also lay the foundation for an athletic career (Moran J. et al., 2017; Moran J. J. et al., 2017; Radnor et al., 2018). Jumping ability, speed, and change of direction are the basis for assessing athletic potential and future development into high-level athletes during the talent selection process for adolescents (Burgess and Naughton, 2010; Unnithan et al., 2012; Han et al., 2023; Kelly, 2023; Sanpasitt et al., 2023). Therefore, designing effective physical training methods for teenagers is very important.
Traditional resistance training, plyometric training (PT), compound training, and sprint training are commonly used effective training methods for improving physical fitness (MacDonald et al., 2012; Morris et al., 2022). Numerous studies have demonstrated that, compared with traditional resistance training, plyometric training may provide greater improvements in explosive power, sprint speed, and change-of-direction (Rædergård et al., 2020; Luo et al., 2025). PT utilizes the physiological advantages of stretch-shortening cycles (SSC), it employs a muscle contraction pattern characterized by a rapid eccentric pre-stretch followed by a rapid concentric contraction (Lloyd et al., 2011; Davies et al., 2015). This muscle contraction pattern is closer to the explosive movement patterns of jumping and sprinting in team sports such as basketball, football, and handball, thus improving performance in actual sports (Slimani et al., 2016; Wang et al., 2024). This improvement is primarily achieved through long-term training, leading to various adaptive mechanisms such as muscle fiber hypertrophy, enhanced motor unit recruitment, increased tendon stiffness, and improved intramuscular and intermuscular coordination (Komi, 2003; Fouré et al., 2010; Taube et al., 2012; Chu and Myer, 2013).
Numerous meta-analyses of PT have confirmed its effectiveness in improving jumping performance, linear sprinting, and change-of-direction. These studies either included both adults and adolescents or only included general adolescents, rather than trained adolescent athletes (de Villarreal et al., 2012; Oxfeldt et al., 2019; Chen et al., 2023a; Sun et al., 2025). Existing evidence suggests that untrained adolescents, due to their lower baseline fitness levels, show greater improvement than trained adolescents (Behm et al., 2017). Furthermore, adolescents are in a critical stage of growth and development, and their neuromuscular systems, hormonal and metabolic levels, and recovery and adaptation abilities differ from those of adults (Lloyd et al., 2015).Therefore, applying evidence from adults or untrained adolescents to guide PT programming in adolescent team-sport athletes may not yield optimal training adaptations.
Existing systematic reviews and meta-analyses have summarized the effects of PT in the adolescent population, but they mostly focus on specific groups and do not cover all the outcome indicators comprehensively (Chen et al., 2023b; Chen et al., 2024). Currently, there is a lack of a systematic evaluation that targets adolescent team sport athletes and integrates key physical fitness indicators such as jumping, different distances of linear sprints, and change-of-direction. Therefore, this meta-analysis aims to explore the impact of PT on the physical fitness of adolescent team athletes and to conduct moderating-variable analyses, including age, gender, training program, and training volume, to investigate the potential influence of these factors on the effectiveness of training. The aim is to establish an evidence base for the scientific development of safe and efficient PT programs for adolescent team sports.
Methods
2
This meta-analysis and systematic review adhered to the Preferred Reporting Items for Systematic Reviews and Meta-Analyses (PRISMA) (Moher et al., 2009). It was registered in PROSPERO under the registration number CRD420251034889.
Information sources and search strategy
2.1
A comprehensive search was conducted across the Scopus, Web of Science, PubMed, and Embase databases. The initial search was conducted on 23 April 2025, and was updated on 6 November 2025. Database searches used keywords combined with MeSH terms. Search terms included: “Stretch-Shortening Exercise” OR “Stretch Shortening Cycle” OR “plyometric training” OR plyometric OR plyometrics OR “jump training” OR “jump exercise” OR “ballistic training” OR “drop jump” OR “depth jump” AND “basketball” OR “soccer” OR “football” OR “handball” OR “volleyball” OR “rugby” OR “team sport”. The search was limited to titles and abstracts, with no restrictions applied to publication region, year, or language. We also searched PROSPERO and the Cochrane Database of Systematic Reviews for relevant protocols to determine whether they had been published.
Eligibility criteria
2.2
Eligibility criteria were defined according to the PICOS framework and are summarized in Table 1. The age range followed the World Health Organization definition of adolescents (10–19 years) (Organization, 2023).
Selection process
2.3
Duplicate references were identified and removed by one reviewer (FZ) using EndNote 21 (Clarivate Analytics, Philadelphia, Pennsylvania, USA). Two researchers (FZ and YL) then independently screened titles, abstracts, and full texts against the predefined criteria.
Data extraction
2.4
Basic information of the literature was extracted independently by one author (FZ), including: (1) author and publication year; (2) age and gender of the subjects; (3) sample size; (4) sport and athlete level; (5) intervention measures; (6) training duration, training frequency, and training volume; and (7) outcome indicators. The results were reviewed by a second author (YL). We first attempted to obtain missing or unclear data by directly emailing the corresponding authors. All discrepancies between reviewers were then resolved through discussion. For any persisting disagreements, a final decision was made by a designated senior reviewer (LS). To avoid overestimating the sample size, if a control group in a study is compared with multiple experimental groups, the sample size of the control group should be divided by the number of comparisons for allocation. Biological maturity information was extracted and summarized descriptively, with emphasis on the reported maturity metrics. Athlete level was reclassified in a standardized manner using the McKay Participant Classification Framework (PCF; Tier 0–5) (McKay et al., 2021). When multiple COD tests were reported in a study, only the longest test time was included in the analysis, defined as the COD protocol with the greatest total test distance or the highest number of directional changes.
Risk of bias assessment and certainty of evidence
2.5
Two assessors (FZ and JL) independently assessed risk of bias using the Cochrane RoB 2.0 tool. The assessment covered five domains: (D1) Randomisation process, (D2) deviations from intended interventions, (D3) missing outcome data, (D4) measurement of the outcome, and (D5) selection of the reported result. Judgements were made for each domain and overall, as low risk, some concerns, or high risk. The certainty of evidence for each primary outcome was assessed using the GRADE approach. As all included studies were randomized controlled trials, certainty started at high and was downgraded when applicable across the following domains: risk of bias, inconsistency, indirectness, imprecision, and other considerations (e.g., publication bias). The overall certainty for each outcome was rated as high, moderate, low, or very low (Guyatt et al., 2011). Disagreements were resolved by discussion, with arbitration by a third assessor when necessary.
Statistical analysis
2.6
The meta-analyses were conducted using Review Manager V.5.4.0 and Stata 15.0. A total of eight meta-analyses were performed: (1) CMJ, (2) CMJA, (3) SJ, (4) SLJ, (5) ≤10-m linear sprint, (6) 20-m linear sprint, (7) 30-m linear sprint, (8) COD. A meta-analysis was conducted when at least three independent studies reported the same outcome measure (Borenstein et al., 2021). The effect size (ES) is represented by Hedge’s g and calculated by the mean and standard deviation of each dependent variable before and after training. For time-based outcomes, negative effect sizes represent improvements in performance. Given the expected between-study differences in participants, training programmes, and testing protocols, a random-effects model was used to pool effect sizes. Pooled effects are presented as Hedges’g with 95% confidence intervals (Deeks et al., 2019). The effect size is explained by the following criteria: trivial (<0.2), small (0.2-0.6), moderate (>0.6-1.2), large (>1.2-2.0), very large (>2.0-4.0), and extremely large (>4.0) (Hopkins et al., 2009). Heterogeneity among studies was assessed using the I^2^ statistic, categorized as low (<25%), moderate (25%–75%), or high (>75%) (Higgins and Thompson, 2002). Egger’s test was used to assess publication bias. When publication bias was detected, the trim-and-fill method was used (Duval and Tweedie, 2000). Sensitivity analysis was employed to ensure the robustness of the meta-analysis results. p < 0.05 was set as the threshold for statistical significance.
To explore potential sources of heterogeneity, subgroup analyses and meta-regression analyses were conducted. Age, training duration, and total number of jumps were taken as moderating variables. Specifically, age groups followed the WHO age-based developmental stage classification described in: 10–12.99 (pre-PHV), 13–15.99 (mid-PHV), and 16–18.99 years (post-PHV), which reflects chronological age rather than directly assessed maturity. The training duration and the total number of jumps lack standardized classifications. To ensure the subgroup analysis has sufficient statistical power, we grouped them according to the distributions observed in the included studies. Meta-regression analysis was conducted when at least 10 studies reported the same outcomes (Cumpston et al., 2019).
Results
3
Study selection
3.1
A preliminary literature search yielded 5,407 articles. After deleting duplicate literature, an initial screening was performed based on the title and abstract, followed by downloading and reading the full text. Finally, 31 studies met the inclusion criteria (Sankey et al., 2008; Sedano et al., 2011; Ozbar et al., 2014; Zribi et al., 2014; Attene et al., 2015; Hammami et al., 2016; Asadi et al., 2018; Hernández et al., 2018; Ramirez-Campillo et al., 2018; Fathi et al., 2019; Jlid et al., 2019; Meszler and Váczi, 2019; Ramirez-Campillo et al., 2019; Drouzas et al., 2020; Negra et al., 2020; Ramirez-Campillo et al., 2020a; Ramirez-Campillo et al., 2020b; Vera-Assaoka et al., 2020; de Villarreal et al., 2021; Noutsos et al., 2021; Padrón-Cabo et al., 2021; Palma-Muñoz et al., 2021; Paes et al., 2022; Gaamouri et al., 2023; Aztarain-Cardiel et al., 2024; BOGIATZIDIS et al., 2024; Haghighi et al., 2024; Liu et al., 2024; Sammoud et al., 2024; Türkarslan and Deliceoglu, 2024; Öztürk et al., 2025). The complete literature screening process is summarized in Figure 1.
Systematic review search and screening procedure.
Characteristics of participants and interventions
3.2
Characteristics of study participants and intervention protocols are detailed in Table 2.
Sample size
3.2.1
Thirty-one articles included a total of 1,033 participants (127 females, 906 males), with individual studies ranging from 15 to 76 participants. This comprised 247 basketball players, 667 footballers, 61 handball players, 40 volleyball players, and 18 rugby players.
Sex
3.2.2
Twenty-five studies included male participants, five studies included female participants, and one study included both.
Biological maturity
3.2.3
Eight studies used maturity offset, seven used Tanner staging, and sixteen did not report maturity-related information.
Playing level
3.2.4
Based on the McKay Participant Classification Framework, most included studies involved developmental-level athletes, while a smaller number examined national-level players.
Training duration
3.2.5
The studies ranged in duration from 6 to 12 weeks, with only one lasting 16 weeks.
Training frequency
3.2.6
Twenty-eight studies employed twice-weekly training. Two studies employed a once-weekly frequency. Only one study reported a frequency of three times a week.
Session duration
3.2.7
Twenty-four studies indicated single-session lengths varying from 15 to 60 min.
Training volume (total number of jumps)
3.2.8
The number of jumps in a single session was between 24 and 220. The total number of jumps ranged from 512 to 2,880.
Intervention methods
3.2.9
Twenty studies combined horizontal and vertical PT. Eight studies employed vertical PT. Two studies included only horizontal PT. One study reported both vertical and horizontal PT.
Seasonal training timing
3.2.10
Twenty-three studies reported implementing training programs during the season, while six studies reported pre-season implementation. Three studies did not report this information.
Risk of bias assessment and certainty of evidence
3.3
Detailed results of the bias risk assessment for each area and overall are presented in Figures 2, 3. The primary sources of risk of bias were “randomization process” and “deviation from the intended intervention”, as it is challenging to blind participants and assessors in sports training. Only six studies explicitly described the randomization process (Hernández et al., 2018; Fathi et al., 2019; Ramirez-Campillo et al., 2020a; Ramirez-Campillo et al., 2020b; Liu et al., 2024; Sammoud et al., 2024). Only two studies were rated as having a low risk of bias in the domain of deviations from the intended interventions (Attene et al., 2015; Palma-Muñoz et al., 2021). For the primary outcome, the GRADE evidence quality level is low or very low (see Table 3). Downgrading was mainly due to risk of bias, inconsistency, and imprecision, with suspected publication bias for several outcomes.
Risk of overall bias.
RoB-2 assessments.
Meta-analysis results
3.4
The results of the eight meta-analyses are presented in Table 4, and the corresponding forest plots are provided in Figures 4–11.
Forest plot of the effect of plyometric training on CMJ in adolescent team-sport athletes.
Forest plot of the effect of plyometric training on SJ in adolescent team-sport athletes.
Forest plot of the effect of plyometric training on CMJA in adolescent team-sport athletes.
Forest plot of the effect of plyometric training on SLJ in adolescent team-sport athletes.
Forest plot of the effect of plyometric training on ≤10-m linear sprint in adolescent team-sport athletes.
Forest plot of the effect of plyometric training on 20-m linear sprint in adolescent team-sport athletes.
Forest plot of the effect of plyometric training on 30-m linear sprint in adolescent team-sport athletes.
Forest plot of the effect of plyometric training on COD in adolescent team-sport athletes.
PT significantly improved jump performance (CMJ: ES = 0.89, 95% CI: 0.59–1.19, I^2^ = 75%; CMJA: ES = 1.00, 95% CI: 0.14–1.86, I^2^ = 74%; SJ: ES = 0.48, 95% CI: 0.22–0.75, I^2^ = 48%; SLJ: ES = 1.10, 95% CI: 0.62–1.58, I^2^ = 62%). For time-based outcomes, PT also improved linear sprint performance (≤10 m: ES = −0.59, 95% CI: −0.87 to −0.32, I^2^ = 49%; 20 m: ES = −0.42, 95% CI: −0.63 to −0.21, I^2^ = 33%; 30 m: ES = −0.97, 95% CI: −1.68 to −0.26, I^2^ = 59%) and COD (ES = −0.73, 95% CI: −1.02 to −0.45, I^2^ = 60%).
Additional analyses
3.5
A total of 17 subgroup analyses were conducted (Table 5). For CMJ, significant between-subgroup differences were observed for age (p = 0.04) and training duration (p = 0.009), with the largest improvements in athletes aged 16–18.99 years and in programmes lasting ≥8 to <10 weeks. For SJ, significant between-subgroup differences were observed for training duration (p < 0.001), with the largest improvement in programmes lasting ≥8 to <10 weeks. Similarly, for the ≤10-m and 20-m linear sprints, training duration showed significant between-subgroup differences (p < 0.001), with the greatest improvements in programmes lasting ≥8 to <10 weeks. Detailed information on the pooled effect size, heterogeneity, and the number of included studies for each subgroup can be found in Table 5.
When there were at least 10 studies for the same outcome measure, age, training duration, and training volume (total number of jumps) were used as covariates in a meta-regression analysis (see Table 6). The results indicated that age was significantly associated with improvements in CMJ (β = 0.211, p = 0.026), ≤10-m linear sprint (β = −0.119, p = 0.031), 20-m linear sprint (β = −0.117, p = 0.023), and COD (β = −0.163, p = 0.048). Training duration was significantly associated with improvements in 20-m linear sprint time (β = −0.206, p = 0.034). The total number of jumps was significantly associated with improvements in the SJ, although the magnitude of the association was small (β = −0.00048, p = 0.049).
Publication bias and sensitivity analyses
3.6
Publication bias was assessed only for outcomes with ≥10 studies. Therefore, Egger tests were performed for five outcomes (see Table 4). CMJ and COD showed a risk of publication bias. By using the trim-and-fill method for adjustment, the results' significance remained unchanged, indicating that publication bias did not significantly affect the effect size.
Sensitivity analyses indicated that the pooled ES was robust for CMJ, SJ, SLJ, all sprint outcomes, and COD, whereas the pooled ES for CMJA was sensitive to omission of individual studies (Supplementary Figures S1–S8).
Discussion
4
Overall, this systematic review and meta-analysis indicates that plyometric training (PT) can enhance the jumping, linear sprint, and change of direction (COD) performance of adolescent team sport athletes. However, there is moderate to high heterogeneity in multiple outcome measures, and the certainty of evidence is generally low to very low. Therefore, the results of subgroup analysis and meta-regression should be interpreted with caution and regarded as exploratory findings, which are not sufficient to form definitive conclusions.
Jump performance
4.1
The meta-analysis showed that PT can effectively improve jump performance in youth team-sport athletes. Specifically, PT significantly improved CMJ (ES = 0.89), CMJA (ES = 1.00), and SLJ (ES = 1.10), whereas the improvement in SJ (ES = 0.48) was smaller but still statistically significant. CMJA results should be interpreted cautiously because they were not robust in sensitivity analyses.
Notably, the improvement in CMJ was clearly larger than that in SJ, suggesting that PT may be more sensitive for jumps involving a countermovement. This may be related to the relatively long pause at the bottom position of the SJ (three to five s). Such a pause may reduce the use of elastic energy stored during the eccentric phase, forcing the movement to rely mainly on concentric contraction, and thereby limiting the contribution of the SSC (MacDougall and Sale, 2014; Stojanović et al., 2017). Improvements in jump performance following PT may be related to structural and neuromuscular adaptations, such as muscle fiber hypertrophy and improved tendon collagen properties, which increase tendon stiffness (Pääsuke et al., 2001; Shepstone et al., 2005), enhance the rapid recruitment of high-threshold motor units, improve central nervous system excitability and reflex control, and strengthen intermuscular and intramuscular coordination (Markovic and Mikulic, 2010; Seiberl et al., 2021).
Regarding potential moderators, subgroup and meta-regression analyses suggested that age and training duration may be associated with the CMJ training effect. The subgroup aged 16–18.99 years showed a greater improvement in CMJ performance (ES = 1.83, p = 0.04), and meta-regression similarly demonstrated a significant association between age and CMJ improvement (β = 0.211, p = 0.026). Importantly, the subgroup and meta-regression results were consistent, suggesting that age may be associated with PT responsiveness. A reasonable explanation is that in older adolescent athletes, a more mature central nervous system and higher levels of testosterone and growth hormone may promote structural and neuromuscular adaptations (Moran J. J. et al., 2017; Radnor et al., 2018; Ramirez-Campillo et al., 2023). In contrast, in younger athletes, lower hormone levels may limit structural adaptations, and their improvements are more related to neuromuscular optimization (Tumkur Anil Kumar et al., 2021). However, because age was used as a proxy rather than directly assessed biological maturity, this interpretation should be considered cautiously.
For training duration, CMJ showed a larger improvement in programmes lasting ≥8 to <10 weeks (ES = 1.92, p = 0.009), and the SJ duration subgroup showed a similar trend (ES = 1.08, p < 0.001). Taken together, the current evidence indicates that programmes lasting ≥8 to <10 weeks may yield clearer improvements in jump performance, without showing that “longer is always better.” The meta-regression indicated a very small negative correlation between the total number of jumps and SJ improvement (β = −0.00048, p = 0.049), which has limited practical significance and should be interpreted with caution. However, the current evidence is insufficient to support the idea that increasing the total number of jumps leads to better training outcomes. One possible explanation is that, because the neuromuscular system of adolescents is still developing, excessive training volume may lead to central nervous system fatigue and high energy expenditure, resulting in impaired neural regulation and the accumulation of metabolic stress. These factors may compromise explosive performance and increase the risk of sports-related injuries (Cairns, 2006; Schoenfeld, 2010; Enoka and Duchateau, 2016). In contrast, appropriately prescribed training duration and volume may facilitate the restoration of energy reserves and muscle tissue repair following high-intensity training, thereby promoting supercompensation (Şahin et al., 2022; Luo et al., 2025). Notably, rapid growth around peak height velocity (PHV) may be associated with a further increase in injury risk (Faigenbaum et al., 2009; Luke et al., 2011). Therefore, greater emphasis should be placed on balancing training load and recovery during this stage.
Linear sprinting
4.2
The meta-analysis showed that plyometric training (PT) can significantly improve linear sprint performance in adolescent team-sport athletes. PT significantly improved ≤10-m (ES = −0.59), 20-m (ES = −0.42), and 30-m sprint performance (ES = −0.97). In practical terms, adding PT to regular sport-specific training may benefit both short-distance acceleration and longer-distance sprint performance. PT may enhance sprint performance through improved neural drive and neuromuscular coordination, increased lower-limb stiffness, and improved rapid force production, which together may reduce ground contact time and increase step frequency (Ross et al., 2001; Mackala and Fostiak, 2015; Tomalka et al., 2020).
Regarding potential moderators, subgroup analysis indicated that for ≤10-m sprint, programmes lasting ≥8 to <10 weeks produced larger improvements (ES = −1.35), with significant between-subgroup differences compared with ≤7 weeks and ≥10 weeks (p < 0.001). A similar pattern was also observed for 20 m sprint (ES = −1.35, p < 0.001). These findings suggest that a duration of ≥8 to <10 weeks may be more favorable for sprint improvements, but this should not be interpreted as a definitive “optimal” training duration. A reasonable explanation is that shorter programmes may provide insufficient accumulated stimulus, whereas longer programmes may involve excessive SSC loading, which may reduce tendon stiffness and make muscle fatigue and a neuromuscular adaptation plateau more likely, thereby compromising recovery (Komi, 2000; Nicol et al., 2006).
For age-related effects, meta-regression showed that age was associated with the training effect for both ≤10-m and 20-m sprints (≤10-m: β = −0.118, p = 0.031; 20-m: β = −0.117, p = 0.023), suggesting that older athletes may achieve larger improvements. With growth and development, progressive central nervous system maturation and hormonal changes may facilitate structural and neuromuscular adaptations (Lloyd and Oliver, 2013; Radnor et al., 2018; Silva et al., 2022); meanwhile, increases in lower-limb length may optimize the stride length–frequency combination and translate more effectively into sprint performance (Asadi et al., 2018). In addition, older athletes typically have longer trained experience, more stable neuromuscular control, and more consistent sprint technique, which may facilitate the translation of PT stimuli into sprint gains (Fort-Vanmeerhaeghe et al., 2016). In terms of the total number of jumps, the current evidence is insufficient to support the claim that simply increasing the total number of jumps can lead to better sprint training results. Further research is needed to verify this.
Agility (change-of-direction)
4.3
The meta-analysis demonstrated that plyometric training (PT) significantly improves change-of-direction (COD) performance in adolescent team-sport athletes, with a moderate overall effect size (ES = −0.73). Good COD is essential in team sports such as basketball, football, and handball, as it is closely related to offensive and defensive actions, the creation of scoring opportunities, and may be associated with reduced injury risk. These findings indicate that incorporating PT into regular sport-specific training may enhance COD and contribute to improved overall sport performance.
During COD tasks, athletes are required to rapidly transition between deceleration and re-acceleration, a process that fundamentally relies on eccentric–concentric muscle actions and the stretch–shortening cycle (SSC) of the lower-limb musculature (Sheppard and Young, 2006; Chaabene et al., 2018). PT imposes substantial inertial and eccentric braking loads during the deceleration phase, which may enhance eccentric strength and neural drive, improve inter- and intramuscular coordination, increase SSC efficiency, and enhance balance and joint stability (Markovic and Mikulic, 2010; Granacher et al., 2015; Chaabene et al., 2018; Jimenez-Iglesias et al., 2024). Collectively, these adaptations may facilitate faster deceleration control and more efficient re-acceleration, ultimately leading to improvements in COD performance.
Regarding potential moderators, age-based subgroup analyses did not reach statistical significance; however, meta-regression indicated that age may be associated with the COD training effect (β = −0.163, p = 0.048), suggesting that training responses may differ across age groups. With respect to training duration, no significant differences were observed between subgroups, although meta-regression revealed a borderline trend (β = −0.282, p = 0.050). In terms of the total number of jumps, the current evidence does not support achieving greater improvements in COD performance simply by increasing the total number of jumps.
Study limitations
4.4
Several limitations of this study should be considered when interpreting the results. The risk of bias assessment revealed that most included studies were assessed to have “some concerns” or a “high risk” of bias, primarily in the “randomization process” and “deviation from the intended interventions”, as it is challenging to blind participants and assessors in sports training. Furthermore, the GRADE quality of evidence indicated that the quality of evidence for the outcome indicators was mainly low to very low. These limitations may bias estimates of the impact of PT on the physical fitness of adolescent team athletes. Only five of the included studies focused on female adolescents, limiting the applicability of the findings to female adolescent sports teams. Therefore, more research on female adolescents is needed in the future. The information on biological maturity was insufficient and inconsistent (8 articles for PHV, seven articles for Tanner, and 16 articles did not report), and the types of maturity indicators were not uniform, which limited the further examination of the differences in the maturity stages. Although this study used the WHO age-based developmental stages for age grouping, this grouping does not represent the directly measured biological maturity and may mask the impact of true maturity differences on training adaptation. Finally, the information on ground contact time was insufficiently reported: most studies did not provide quantifiable ground contact time data or unified monitoring methods, and some only made qualitative descriptions such as “quick landing”. Safety reporting was a major limitation of the evidence base. As adverse events were rarely reported, safety outcomes could not be synthesized, and PT safety remains uncertain in this population.
Practical applications
4.5
PT is a feasible and effective training method for enhancing the jumping, sprinting and COD abilities of youth team sports athletes. A training program conducted twice a week for a duration of ≥8 weeks to <10 weeks can lead to more stable improvements in multiple physical performance indicators. In practical training, the focus of the training should not merely be on achieving a high total number of jumps, but should be adjusted individually based on the athlete’s developmental stage, training experience, recovery status and season workload.
Conclusion
5
Plyometric training improves jumping, linear sprint, and change-of-direction performance in adolescent team-sport athletes. Age may moderate the training response, with athletes aged 16–18.99 years showing larger improvements in CMJ, ≤10-m linear sprint, 20-m linear sprint and COD. Interventions lasting ≥8 to <10 weeks were associated with more consistent gains, particularly for CMJ, ≤10-m linear sprint, and 20-m linear sprint. The available evidence does not indicate that simply increasing total number of jumps is consistently associated with greater performance gains.
The reference list from the paper itself. Each links out to its DOI / PubMed record.
- 1Abdelkrim N. B. Castagna C. Jabri I. Battikh T. El Fazaa S. El Ati J. (2010). Activity profile and physiological requirements of junior elite basketball players in relation to aerobic-anaerobic fitness. J. Strength and Cond. Res. 24 (9), 2330–2342. 10.1519/JSC.0b 013e 3181 e 381c 1 20802281 · doi ↗ · pubmed ↗
- 2Asadi A. Ramirez-Campillo R. Arazi H. Sáez de Villarreal E. (2018). The effects of maturation on jumping ability and sprint adaptations to plyometric training in youth soccer players. J. Sports Sciences 36 (21), 2405–2411. 10.1080/02640414.2018.1459151 29611771 · doi ↗ · pubmed ↗
- 3Attene G. Iuliano E. Di Cagno A. Calcagno G. Moalla W. Aquino G. (2015). Improving neuromuscular performance in young basketball players: plyometric vs. technique training. J. Sports Med. Phys. Fit. 55 (1-2), 1–8. 24921611 · pubmed ↗
- 4Aztarain-Cardiel K. Garatachea N. Pareja-Blanco F. (2024). Effects of plyometric training volume on physical performance in youth basketball players. J. Strength and Cond. Res. 38 (7), 1275–1279. 10.1519/JSC.0000000000004779 38900173 · doi ↗ · pubmed ↗
- 5Behm D. G. Young J. D. Whitten J. H. Reid J. C. Quigley P. J. Low J. (2017). Effectiveness of traditional strength vs. power training on muscle strength, power and speed with youth: a systematic review and meta-analysis. Front. Physiology 8, 423. 10.3389/fphys.2017.00423 28713281 PMC 5491841 · doi ↗ · pubmed ↗
- 6Bogiatzidis E. Ispyrlidis I. Gourgoulis V. Bogiatzidis A. Smilios I. (2024). Effects of vertical versus horizontal plyometric training on adolescent soccer players' physical performance. Trends Sport Sci. 31 (2). 10.23829/TSS.2024.31.2-3 · doi ↗
- 7Borenstein M. Hedges L. V. Higgins J. P. Rothstein H. R. (2021). Introduction to meta-analysis. Chichester, United Kingdom: John Wiley & Sons.
- 8Burgess D. J. Naughton G. A. (2010). Talent development in adolescent team sports: a review. Int. Journal Sports Physiology Performance 5 (1), 103–116. 10.1123/ijspp.5.1.103 20308701 · doi ↗ · pubmed ↗