Physiological and transcriptomic insights into the molecular mechanisms of salt stress adaptation in Gardenia jasminoides
Wenhui Li, Ziyang Zhang, Dexing Chen, Xin He, Ye Huang, Xuewei Zhao, Weihong Sun, Zhong-Jian Liu, Shuang-Quan Zou

TL;DR
This study explores how Gardenia jasminoides adapts to salt stress through physiological and molecular mechanisms, identifying key genes and pathways involved in salt tolerance.
Contribution
The study reveals a hierarchical regulatory network in Gardenia jasminoides under salt stress, highlighting novel regulators for improving salt tolerance in plants.
Findings
3,883 differentially expressed genes were identified, linked to calcium signaling, antioxidant defense, and phytohormone regulation.
Salt stress caused photosynthetic damage and altered enzyme activities, with proline and soluble proteins aiding osmotic adjustment.
Key regulators like WRKY transcription factors and GST family members coordinate stress signaling and ROS homeostasis.
Abstract
Salt stress is a major environmental factor limiting plant growth and productivity. Plants have developed diverse physiological and molecular strategies to adapt to saline conditions. Gardenia jasminoides, a dual-purpose plant with significant economic value in medicine and landscaping, exhibits notable salt tolerance, but the underlying molecular mechanisms remain largely unexplored. Our study aims to elucidate the physiological and molecular adaptive strategies of this plant to salt stress by integrating physiological measurements and transcriptomic analysis. RNA-seq profiling of G. jasminoides leaves, which were subjected to four NaCl concentrations (0, 50, 100, and 200 mmol·L⁻¹) for 15 days, identified 3,883 differentially expressed genes (DEGs). These DEGs were mainly associated with calcium signaling, MAPK–WRKY cascades, antioxidant defense, and phytohormone regulation.…
Genes, proteins, chemicals, diseases, species, mutations and cell lines named across the full text — each resolved to its canonical identifier and authoritative record.
Click any figure to enlarge with its caption.
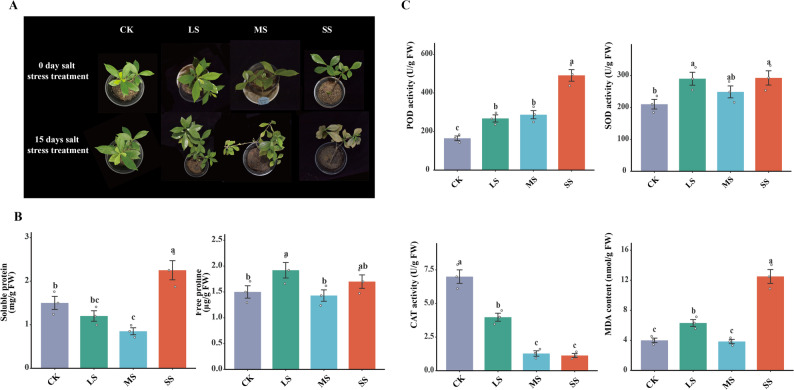 Figure 1
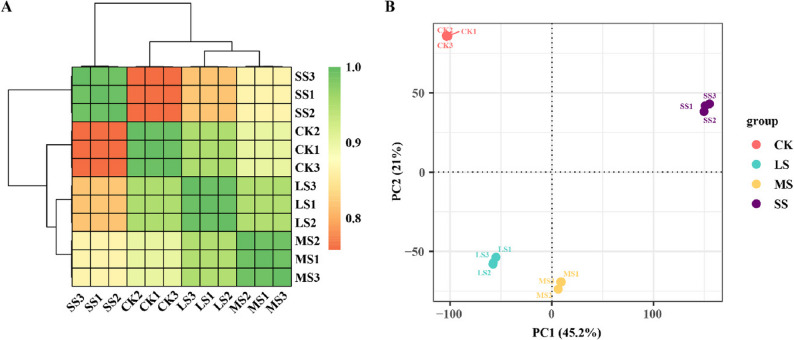 Figure 2
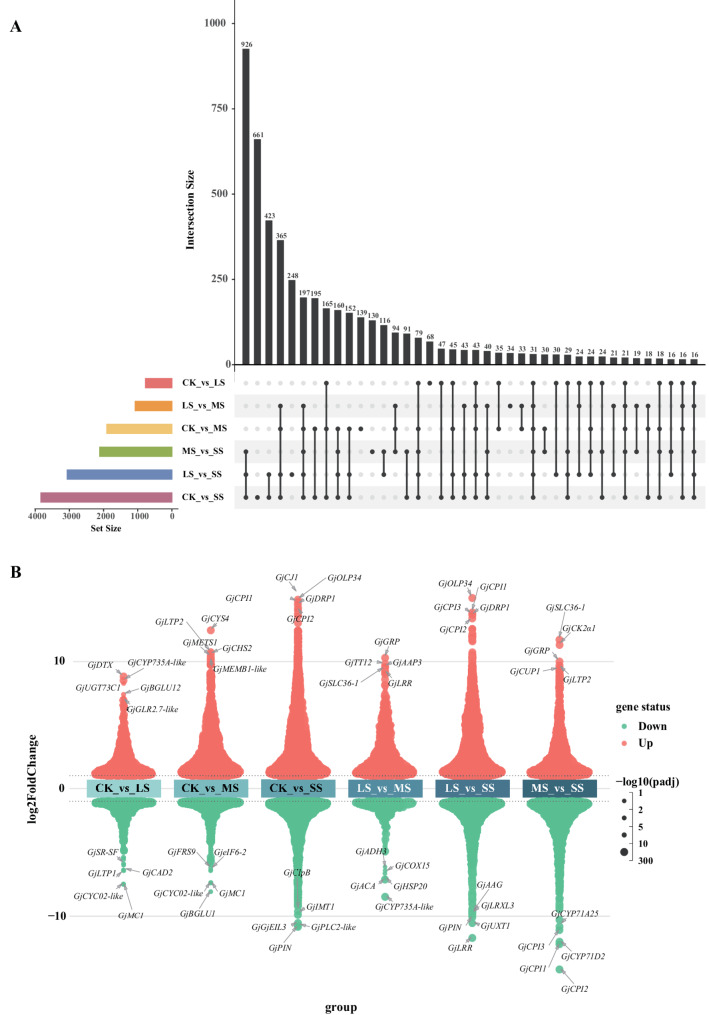 Figure 3
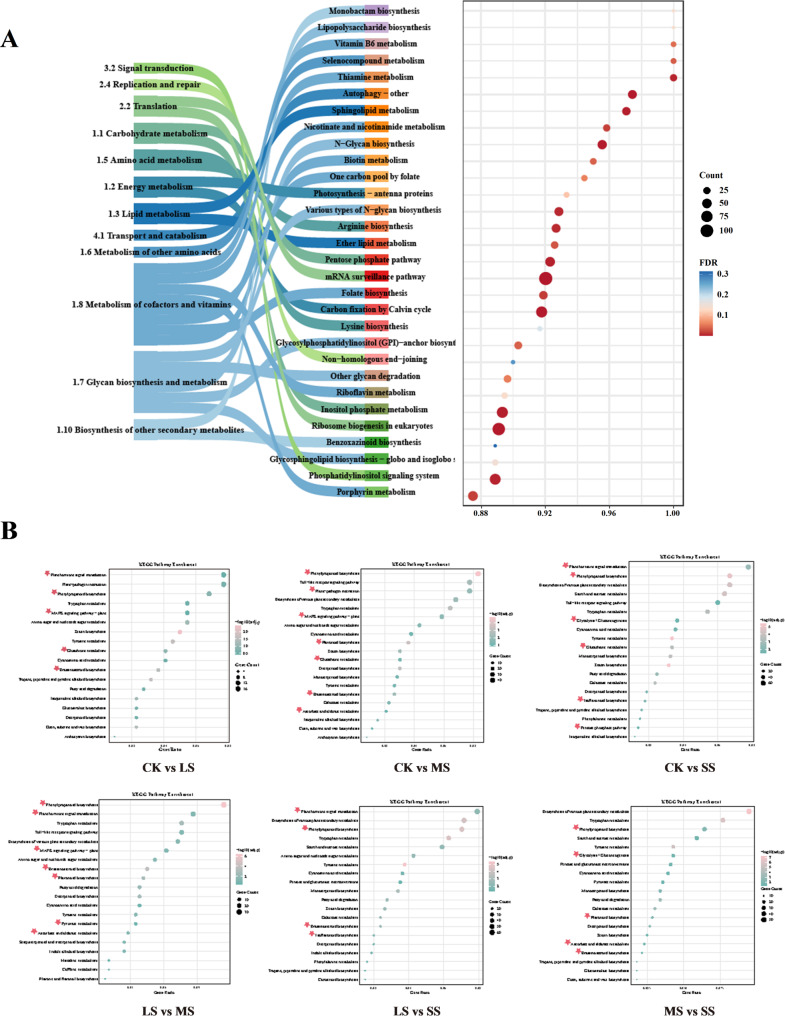 Figure 4
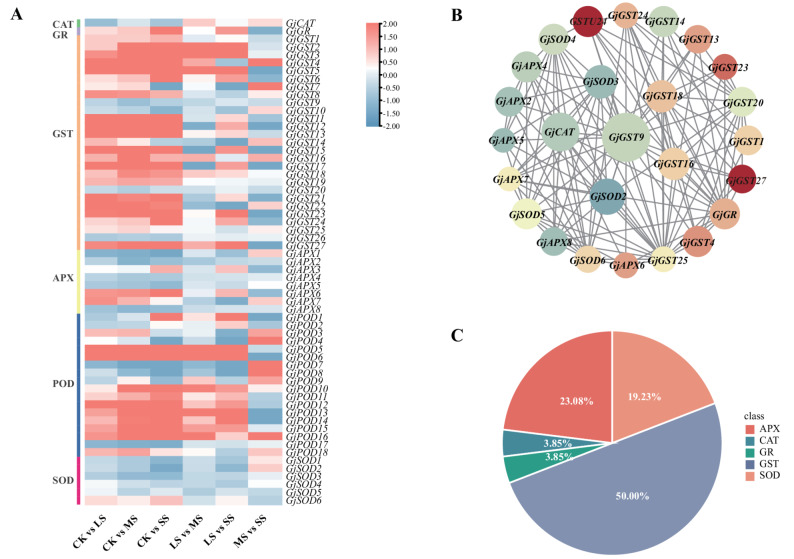 Figure 5
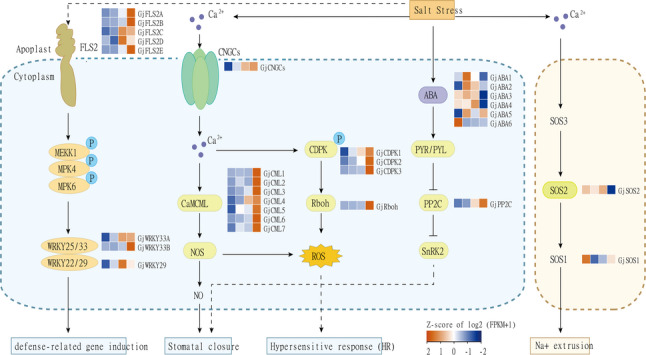 Figure 6
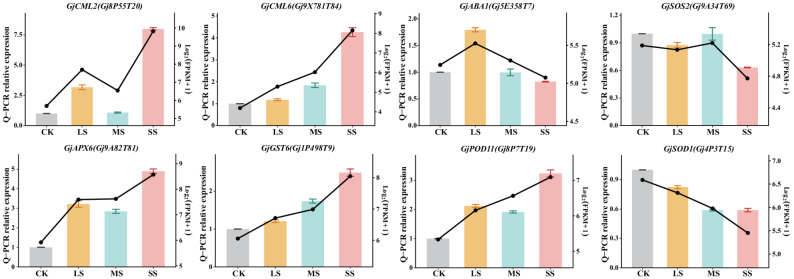 Figure 7
- —Fuzhou Forestry Science and Technology Project
- —the Central-funded Forestry Science and Technology Promotion and Demonstration Project
- —the Fujian Provincial Department of Science and Technology–University–Industry Cooperation Project
Peer Reviews
No public reviews on file for this paper yet. If you reviewed it on a platform where reviews are public (OpenReview, ICLR, NeurIPS, ICML), you can paste yours below so the community can read it here.
Videos
No videos yet. Explain this paper in a talk, walkthrough, or lecture? Add one.
Taxonomy
TopicsPlant Stress Responses and Tolerance · Plant Gene Expression Analysis · Saffron Plant Research Studies
Background
Salt stress profoundly impairs plant growth and development by disrupting multiple physiological and biochemical processes [1, 2]. Globally, the area of saline-affected soils continues to expand due to climatic anomalies and anthropogenic activities [3]. Excess Na^+^ accumulation induces osmotic stress, ion toxicity, and elevated reactive oxygen species (ROS) production, ultimately causing cellular dysfunction or plant death [4–6]. Plants counteract these stresses through mechanisms including ion homeostasis regulation, osmotic adjustment, antioxidant activation, and phytohormone modulation [7, 8]. Gardenia jasminoides is an economically and ecologically important woody plant widely cultivated in subtropical regions [9, 10]. Unlike common ornamental species, G. jasminoides serves a distinct dual purpose. In traditional medicine, its fruit has been utilized for millennia to treat inflammation, hepatic disorders, and hypertension [9, 11]. Modern pharmacology confirms that its fruits are a primary source of geniposide and crocin, which are valuable natural pigments and medicinal compounds with hepatoprotective and antioxidant properties [9, 12]. Simultaneously, it is highly valued in the horticultural industry for its fragrant flowers and evergreen foliage [9, 13]. However, G. jasminoides is sensitive to salt stress, and soil salinization restricts its geographical distribution and cultivation. Salt stress not only inhibits vegetative growth, compromising its landscaping value, but also significantly reduces fruit yield and the accumulation of these bioactive secondary metabolites [14]. Therefore, elucidating the molecular mechanisms of salt tolerance in G. jasminoides is critical for breeding cultivars that can thrive in saline environments, thereby securing both its ecological function and economic productivity [11, 15]. However, the development of such stress-resilient cultivars is currently hindered by a knowledge gap. Despite extensive physiological studies on its salt tolerance, the molecular mechanisms underlying this capacity remain insufficiently understood [16]. Integration of physiological responses with transcriptomic profiling under salt stress is therefore essential to elucidate tolerance mechanisms and construct genomic networks that regulate adaptation, particularly through functional characterization of differentially expressed genes (DEGs) [17]. Physiological responses, such as alterations in antioxidant enzyme activities and osmolyte accumulation, suggest that G. jasminoides employs complex strategies under salt stress 01. Antioxidant enzymes including peroxidase (POD), superoxide dismutase (SOD), and catalase (CAT) are critical for detoxifying ROS [18, 19]. POD activity typically increases with stress intensity, whereas SOD activity fluctuates across stress stages, reflecting its regulatory complexity. POD participates in H₂O₂ scavenging and lignin biosynthesis, SOD catalyzes the dismutation of superoxide radicals to H₂O₂, and CAT decomposes H₂O₂ into water and oxygen [20, 21]. Malondialdehyde (MDA), a lipid peroxidation product, is a reliable indicator of oxidative membrane damage [22]. Osmolytes such as soluble proteins and proline also contribute to osmotic balance, protein stabilization, and ROS detoxification during stress [23, 24]. Soluble protein levels initially decline but recover, peaking under severe stress (SS), whereas proline accumulation follows a triphasic response before stabilization [25, 26]. These physiological features highlight the complexity of G. jasminoides adaptation to salinity, yet the molecular regulation underlying these processes remains unresolved.
To address this gap, we investigated salt tolerance in G. jasminoides through an integrative approach combining physiological and transcriptomic analyses. We specifically focused on leaf tissues, as they serve as the primary sites for photosynthesis and are highly susceptible to ionic toxicity and oxidative damage under salt stress [27, 28]. By linking antioxidant enzyme dynamics, osmolyte accumulation, and gene enrichment in stress-associated pathways, we sought to elucidate how calcium signaling, MAPK cascades, and hormone interactions coordinate adaptive responses [29–31]. This study advances the mechanistic understanding of salt adaptation in G. jasminoides and provides a basis for enhancing salt tolerance in woody plants.
Materials and methods
Plant materials
Clonal seedlings of G. jasminoides derived from cuttings were obtained from the Quanzhou Urban Forest Park Development Center (Quanzhou, China), and the species identity was authenticated by Prof. Shuang-Quan Zou (Fujian Agriculture and Forestry University). Six-month-old seedlings with uniform growth and no visible signs of disease or pests were transplanted into plastic pots (0.08 m height, 0.1 m diameter), with one plant per pot. Each pot was filled with 250 g of air-dried soil and placed on a tray. The soil was watered slowly to saturation. A total of 36 plants were prepared for the experiment. Plants were maintained under standard greenhouse conditions at Fujian Agriculture and Forestry University: 25 ± 2 °C/20 ± 2 °C (day/night), 60–70% relative humidity, and a 14 h light/10 h dark photoperiod with a light intensity of ~ 300 µmol·m⁻²·s⁻¹. Healthy seedlings showing consistent growth were selected for salt stress treatments. These cultivated materials did not require specific collection permits, and no voucher specimens were deposited. All experiments complied with institutional, national, and international guidelines for plant research.
NaCl treatment and sampling
Four NaCl treatments were established: control (CK, 0 NaCl), low salt stress (LS, 50 mmol·L⁻¹ NaCl), moderate salt stress (MS, 100 mmol·L⁻¹ NaCl), and severe salt stress (SS, 200 mmol·L⁻¹ NaCl) (Tab. S1). The experiment followed a randomized block design. Each treatment contained three biological replicates, and each replicate consisted of three individual plants, resulting in a total of 36 plants (4 treatments × 3 replicates × 3 plants). Beginning daily at 23:00, 50 mL of the corresponding NaCl solution was applied to each pot, with care taken to minimize salt loss. The treatments lasted for 15 days. Plant growth was photographed and recorded before and after treatment (Fig. 1A).
Fig. 1. Effects of salt stress on the growth and physiological responses of G. jasminoides. A Phenotypic changes under different salt stress levels (CK: control; LS: low salt; MS: moderate salt; SS: severe salt) at 0 and 15 days. B Soluble protein and free proline contents in leaves. Error bars represent the standard error (SE) of the mean from three biological replicates. C Activities of antioxidant enzymes (POD, SOD, CAT) and MDA content after 15 days of salt treatment. Error bars represent the standard error (SE) of the mean from three biological replicates
For physiological and biochemical assays, leaves from each biological replicate were measured in triplicate (technical replicates). For RNA-seq analysis, to ensure sample representativeness and minimize individual variation, leaf tissues were harvested from all three plants within each biological replicate and pooled to form one composite sample. Consequently, three independent pooled biological replicates were sequenced for each treatment. The second fully expanded leaves from the shoot apex were harvested at the same time of day to reduce circadian effects, immediately frozen in liquid nitrogen, and stored at − 80 °C until analysis.
Determination of antioxidant defense and osmotic adjustment
To ensure consistency, three plants were selected for each treatment, and the second fully expanded leaves from the shoot apex were tagged before stress induction. At each sampling time, tagged leaves were excised, gently cleaned with a moist soft cloth, and placed into pre-chilled cryovials. Samples were flash-frozen in liquid nitrogen and stored at − 80 °C until analysis. The following assays were conducted using standard protocols: CAT (EC 1.11.1.6) activity was determined by hydrogen peroxide consumption [32]; POD (EC 1.11.1.7) activity was measured using the guaiacol oxidation method [33]; SOD (EC 1.15.1.1) activity was evaluated by the nitroblue tetrazolium (NBT) photoreduction assay [33]; MDA content was assessed via thiobarbituric acid reactive substances (TBARS) assay [34]; soluble protein content was measured by Coomassie Brilliant Blue G-250 staining [35]; and proline concentration was determined using the acidic ninhydrin method [36].
Measurement of chlorophyll fluorescence parameters
Chlorophyll fluorescence parameters were measured using a portable chlorophyll fluorometer (OS-30p^+^, Opti-Sciences, Hudson, NH, USA). To ensure complete dark adaptation of the photosystems, measurements were conducted between 21:00 and 24:00 on the sampling days. For each treatment, three healthy, fully expanded leaves from three distinct plants were tagged and measured. The instrument settings were configured with a saturating pulse intensity of 3000 µmol m^− 2^ s^− 1^ and a pulse duration of 1.5 s. Minimal fluorescence (Fo) was determined using a weak modulated measuring light, followed by a saturating pulse to record maximal fluorescence (Fm). The variable fluorescence (Fv), maximum quantum yield of PSII (Fv/Fm), and potential photochemical activity (Fv/Fo) were calculated based on the following equations: Fv = Fm – Fo, Fv/Fm = (Fm – Fo)/Fm, and Fv/Fo = (Fm – Fo)/Fo.
Transcriptome sequencing and annotation
Total RNA was extracted from leaves using the FastPure Plant Total RNA Isolation Kit (Vazyme Biotech Co., Ltd., Nanjing, China). To ensure the reliability of the sequencing data, RNA quality was rigorously assessed. RNA degradation and contamination were monitored on 1% agarose gels, and purity was checked using a NanoDrop spectrophotometer (IMPLEN, CA, USA). RNA integrity and concentration were precisely quantified using an Agilent 2100 Bioanalyzer (Agilent Technologies, CA, USA) with the Agilent RNA 6000 Nano Kit. Key parameters, including the RNA Integrity Number (RIN), 28 S/18S ratio, and total concentration, were evaluated. Only RNA samples meeting the library construction requirements of the sequencing provider were selected for downstream analysis. Short-read RNA-seq was conducted on frozen leaf tissue by the Beijing Genomics Institution (BGI, China) using the DNBSEQ-T7 platform. Purified PCR products were subjected to paired-end sequencing according to standard protocols [37]. Quality control was performed with fastp, and reads were further screened using FaQCs when necessary [38]. Clean reads were aligned with HISAT2 v2.1.1 against the published G. jasminoides genome (Accession: GCA_013103745.1) [39, 40]. Transcripts were reconstructed using StringTie [41].
Statistical analyses
For physiological and biochemical assays, data are presented as mean ± SE (n = 3 biological replicates per treatment). Normality and homoscedasticity were verified before analysis. Group means were compared using one-way analysis of variance (ANOVA) followed by Fisher’s Least Significant Difference (LSD) test (P < 0.05). Different lowercase letters above the bars or points indicate statistically significant differences between treatments. Statistical analyses and data visualization were performed using R software, utilizing the agricolae package [42] for LSD tests and the ggplot2 package for figure generation. Transcript abundance was quantified as fragments per kilobase of transcript per million mapped reads (FPKM) using RSEM [43]. Differential expression analysis was conducted with DESeq [44], applying the Benjamini–Hochberg method [45]to control false discovery rate (FDR). Genes with FDR < 0.05 and |log_2_FC| > 1 were considered significantly differentially expressed. Functional annotation was performed using Blast2GO [46] (E-value ≤ 1e⁻⁵) and KOBAS 3.0 [47] (hypergeometric test) to obtain Gene Ontology (GO) and Kyoto Encyclopedia of Genes and Genomes (KEGG) annotations.
Real-Time PCR (qRT-PCR) validation for DEGs
Eight key DEGs were selected for validation. Primers for target genes and the reference gene were designed using Primer Premier 5, with specificity confirmed by Primer-BLAST (NCBI; accessed 20 May 2024). Primer details are listed in Table S2. Amplification efficiency, determined from standard curves, ranged from 90% to 110%. Specificity was further verified by melting curve analysis to confirm single peaks. The RPS25-1 gene (GenBank accession number: GU797554.1) was used as the reference gene. Total RNA was reverse transcribed using HiScript^®^ III RT SuperMix (Vazyme R212) in a 20 µL reaction (50 °C for 15 min; 85 °C for 2 min). qRT-PCR was conducted with Hieff UNICON^®^ Universal Blue qPCR SYBR Green Master Mix (Yeasen Biotech Co., Ltd., Shanghai, China). Relative expression was calculated using the 2^⁻ΔΔCt^ method, with CK as the calibrator. For each gene, three independent biological replicates and three technical replicates were analyzed. Data are presented as mean ± SE (n = 3) of biological replicates.
Results
Antioxidant, osmotic, and photosynthetic responses to salt stress
Phenotypic observations revealed that salt stress induced visible damage to G. jasminoides leaves. After 15 days of treatment, leaves in the SS group exhibited distinct chlorosis and wilting compared to the green and healthy leaves in the CK group, indicating that the stress treatment was effective. Consistent with these phenotypic changes, the antioxidant defense system of G. jasminoides leaves exhibited pronounced and dynamic changes under salt stress. Activities of POD, SOD, and CAT, together with MDA accumulation, highlighted their central roles in oxidative stress regulation. POD activity increased steadily with stress intensity, with LS, MS, and SS treatments showing significant increases of 62.28%, 74.02%, and 197.51%, respectively, compared with CK. In contrast, SOD activity displayed a fluctuating pattern: LS and SS treatments showed significant increases of 38.04% and 39.26%, whereas MS treatment resulted in only an 18.40% increase. CAT activity decreased progressively, with reductions of 43.09%, 81.71%, and 83.85% in LS, MS, and SS, respectively. MDA accumulation partially mirrored SOD activity trends. Under SS treatment, MDA increased dramatically by 212.71%, indicating severe membrane lipid peroxidation, whereas LS showed a 57.65% increase and MS exhibited a slight 4.02% reduction (Fig. 1C). These results suggest that POD and SOD are major contributors to antioxidant defense. However, the persistent decline in CAT activity likely impaired H_2_O_2_ detoxification, leading to elevated MDA accumulation under SS. The transient reduction in MDA at MS may indicate a temporary balance between ROS production and scavenging, although prolonged stress could disrupt this equilibrium [31, 32].
Chlorophyll fluorescence parameters also displayed distinct temporal patterns in response to salt stress. In the early stages (1–5 days), Fv/Fm and Fv/Fo showed no consistent significant differences compared to the control, indicating a relatively stable photosynthetic apparatus. However, at 15 days, salt stress significantly inhibited photosynthetic efficiency. Compared with CK, SS treatment caused a significant decrease in Fv/Fm (4.30%) and Fv/Fo (17.14%), accompanied by a significant increase in Fo of 12.86% (P < 0.05). This significant rise in Fo and decline in Fv/Fm at Day 15 indicated the occurrence of photoinhibition and structural damage to PSII reaction centers, contrasting with the phenotype observed in early stages (Fig. S1) [48, 49].
Osmotic adjustment also exhibited differential responses. Soluble protein content decreased initially under LS but gradually recovered and peaked under SS. Free proline displayed a triphasic response, peaking significantly during MS before declining and rising again (Fig. 1B). Together, these patterns suggest complementary roles in osmotic adjustment, with proline acting as an early stress indicator and soluble proteins contributing to sustained tolerance [50].
Quality assessment of sequencing
Transcriptome sequencing was conducted on 12 samples, including CK and the three salt stress treatments (LS, MS, SS). Sequencing quality was high, with Q20 values exceeding 95%, Q30 values above 92%, and genome mapping rates greater than 82.80% for all samples (Tab. S3). Pearson correlation coefficient (PCC) analysis indicated higher correlation within biological replicates than between treatments (Fig. 2A). Principal component analysis (PCA) further confirmed the reliability of sample grouping, with PC1 and PC2 explaining 81% and 15% of total variance, respectively (Fig. 2B). Across all samples, 25,951 expressed genes were detected, including 24,784 annotated genes and 1,167 novel predictions. A total of 30,383 new transcripts were identified, comprising 29,201 novel splice variants of known protein-coding genes and 1,182 transcripts corresponding to predicted new protein-coding genes. These statistics confirm that the sequencing data are of high quality and suitable for downstream analyses.
Fig. 2. Transcriptome sequencing quality assessment. A Correlation studies among all treatments, including control group (CK), low salt (LS), medium salt (MS), severe salt (SS). B PCA
Identification of DEGs
Six pairwise comparisons were conducted: CK vs. LS, CK vs. MS, CK vs. SS, LS vs. MS, LS vs. SS, and MS vs. SS. In total, 165 DEGs were shared across all comparisons. The most extensive transcriptional reprogramming was observed in CK vs. SS, which yielded 3,883 DEGs, with 2,452 up-regulated and 1,381 down-regulated genes. Substantial overlap was observed with CK vs. LS (549 shared genes) and CK vs. MS (1,510 shared genes) (Fig. 3A). The number of DEGs increased with stress intensity, reflecting progressive transcriptome reprogramming. Specifically, CK vs. MS yielded 1,902 DEGs (1,614 up-regulated; 288 down-regulated), and CK vs. LS yielded 772 DEGs (557 up-regulated; 215 down-regulated). Additional comparisons identified 1,071 DEGs in LS vs. MS (992 up-regulated; 79 down-regulated), 3,063 in LS vs. SS (1,949 up-regulated; 1,113 down-regulated), and 2,111 in MS vs. SS (1,126 up-regulated; 985 down-regulated). The top five most significantly up- and down-regulated genes were identified **(**Fig. 3B, Tab. S4).
Fig. 3. Differentially expressed genes (DEGs) in control, low salt, medium salt and severe salt. A Analysis of upset plot of DEGs in each treatment comparison. B The up-regulated and down-regulated DEGs and the top five significantly upregulated and downregulated genes
Functional annotation of DEGs
GO functional enrichment analysis of DEGs from all six pairwise comparisons revealed that salt-responsive genes were primarily associated with stress response, hormone metabolism, ion transport, secondary metabolism, and cell wall biogenesis. Enriched categories included “response to bacterium,” “hormone metabolic process,” “monoatomic anion transport,” “secondary metabolic process,” and “plant-type secondary cell wall biogenesis” (Fig. S2).
KEGG annotation of DEGs (adjusted P < 0.01) showed enrichment in 12 major subclasses, including “Translation,” “Energy metabolism,” and “Transport and catabolism” (Fig. 4A). KEGG enrichment analysis across the six comparisons identified “Phenylpropanoid biosynthesis” and “Tryptophan metabolism” as consistently enriched pathways (Fig. 4B; Tab. S5). The phenylpropanoid pathway produces flavonoid antioxidants that mitigate ROS accumulation, highlighting its importance in oxidative stress tolerance. Tryptophan metabolism, a precursor of indoleacetic acid (auxin), contributes to growth, development, and stress responses, and produces antioxidant metabolites that further enhance stress defense. Pathway-specific enrichment patterns were also observed. For example, “Glutathione metabolism” was significantly enriched in CK vs. LS and CK vs. SS but less so in other comparisons, suggesting stress-intensity-dependent regulation of this pathway. Fig. 4KEGG enrichment analysis of differentially expressed genes (DEGs). A KEGG enrichment analysis of all DEGs (res < 0.01). B KEGG enrichment analysis of differential genes between groups
Candidate genes in salt stress
Based on antioxidant and osmotic adjustment responses and functional enrichment analyses of DEGs, we identified 61 DEGs associated with antioxidant defense system, including isoforms of SOD, POD, CAT, glutathione reductase (GR), and glutathione S-transferase (GST) (Tab. S6). These families exhibited distinct expression trends. As salinity increased, POD genes were predominantly upregulated in a concentration-dependent manner. In particular, GjPOD5, GjPOD6, and GjPOD13 showed progressively higher expression with increasing salt stress, peaking under SS, supporting a central role of POD-mediated H₂O₂ detoxification. SOD isoforms displayed divergent responses: GjSOD6 increased steadily with salt concentration, whereas GjSOD2 and GjSOD3 declined, suggesting functional specialization among paralogs. The GjCAT gene was consistently suppressed, with expression further reduced at higher salinity, indicating diminished CAT-mediated ROS detoxification. Ascorbate peroxidase (APX) genes also showed contrasting responses: GjAPX2,* GjAPX5*, and GjAPX8 were downregulated, whereas GjAPX6 was markedly induced (log_2_FC = 2.69 under SS). GSTs represented the largest and most responsive group, with several strongly upregulated members. For example, GjGST5 (log_2_FC = 13.89) and GjGST27 (log_2_FC = 5.57) highlight their importance in glutathione-dependent ROS detoxification (Fig. 5A). These patterns align with measured enzymatic activities and suggest coordinated regulation of antioxidant defenses under salt stress. The results indicate that G. jasminoides preferentially activates POD-mediated antioxidant pathways at higher stress intensities.
Fig. 5. Protein-protein interaction (PPI) network of antioxidant-related genes in G. jasminoides. A Heatmap of up- and down-regulation of antioxidant enzyme genes. B PPI network of 26 antioxidant-related protein under salt stress. C Functional classification of 26 genes shown in panel (B)
To further explore the regulatory mechanisms of antioxidant-related genes, we subjected the 61 DEGs to protein–protein interaction (PPI) and co-expression analyses (Fig. 5B). The PPI network was constructed using Arabidopsis thaliana orthologs as references in the STRING database, yielding 26 genes with potential interactions. GSTs were the most abundant group (50.00%), followed by SODs (23.08%), APXs (19.23%), and CAT and GR (3.85% each), highlighting the importance of GSTs in salt stress responses (Fig. 5C). Several highly connected genes were significantly upregulated, such as GjGST4 (Gj11A415T159, log_2_FC = 3.09), GjGST23 (Gj9A71T113, log_2_FC = 4.61), and GjGST27 (Gj9X778T41, log_2_FC = 5.57), suggesting strong responsiveness and central regulatory roles (Tab. S7). In contrast, some highly connected but downregulated genes, such as GjSOD2 and GjAPX8, may contribute to negative feedback regulation of ROS homeostasis.
Calcium signaling and ROS production are central regulators of salt stress response
Drawing on relevant literature and the expression patterns of DEGs detected in this study, we constructed a network diagram of the calcium signaling pathway and its associated gene expression changes in G. jasminoides leaves under salt stress (Fig. 6). In total, 29 DEGs were identified, including genes associated with calcium signaling, ROS production, mitogen-activated protein kinase (MAPK) cascades, phytohormone signaling, and ionic homeostasis. These comprised six abscisic acid (ABA) biosynthesis and signaling genes (GjABA1–6), ten calcium-dependent protein kinase and calmodulin-like protein genes (GjCDPK1–3,* GjCML1–7*), one cyclic nucleotide-gated channels (GjCNGCs), five flavonol synthase genes (GjFLS2A–E), one protein phosphatase 2 C (GjPP2C), one respiratory burst oxidase homolog (GjRboh), two salt overly sensitive (SOS) pathway genes (GjSOS1 and GjSOS2), and three WRKY transcription factors (GjWRKY29,* GjWRKY33A*, and GjWRKY33B) (Tab. S7). Salt stress is perceived as excessive sodium ion (Na^+^) accumulation, which rapidly elevates cytosolic calcium ion (Ca²^+^) levels and activates downstream signaling cascades [51]. Calcium signaling emerged as a central regulatory mechanism, supported by marked upregulation of CNGC, calmodulin/calmodulin-like (CaM/CML), calcium-dependent protein kinase (CDPK), and Rboh families [52]. CNGCs genes, encoding plasma membrane Ca²+-permeable channels, showed sustained upregulation, suggesting a key role in mediating Ca²^+^ influx and initiating intracellular signaling during salt stress. The concurrent upregulation of CaM/CML, CDPK, and Rboh indicates that elevated cytosolic Ca²^+^ activates ROS and nitric oxide (NO) production, driving cell wall remodeling and stomatal closure **(**Fig. 6; Tab. S8). The induction of GjCNGCs together with GjRboh suggests the existence of a “Ca²^+^ influx–Rboh activation–ROS burst” signaling cascade, consistent with findings in Arabidopsis and other plant species [53].
Fig. 6. Schematic diagram of salt stress signaling pathway in the leaves of G. jasminoides, with overlaid gene expression profiles. Heatmaps represent the Z-score of log₂(FPKM + 1) expression values across four treatments: CK, LS, MS, SS. The color scale bar indicates the Z-score range from − 2 (blue, low expression) to + 2 (red, high expression)
In parallel, flagellin-sensitive 2 (FLS2) receptor activates MAPK cascades [54]. These pathways mediate defense responses through modules such as MEKK1–MPK4/MPK6–WRKY25/33 and WRKY22/29. In our study, two WRKY25/33-related genes and one WRKY22/29 gene showed differential expression, suggesting the activation of distinct MAPK sub-pathways during salt stress (Tab. S7; Fig. S3).
Phytohormone signaling also contributes to salt adaptation [55]. ABA signaling plays a critical role in osmotic adjustment, ion balance, and ROS regulation [56, 57]. Salt-induced ABA accumulation is perceived by PYR/PYL receptors, which suppress PP2C, thereby activating sucrose non-fermenting 1-related protein kinase 2 (SnRK2). This cascade phosphorylates ion channels and induces stomatal closure. Interestingly, the specific upregulation of GjPP2C under salt stress may dampen SnRK2 activity, potentially delaying stomatal closure to balance water loss with photosynthetic activity. For ion homeostasis, we analyzed genes in the SOS pathway. Although GjSOS1 and GjSOS2 did not show strong induction, their stable expression under high salinity suggests regulation at the post-translational level [58, 59]. Beyond the SOS pathway, vacuolar H^+^-ATPase (V-ATPase) genes were significantly upregulated, implying that vacuolar Na^+^ sequestration is a crucial tolerance mechanism in G. jasminoides. Additionally, the high expression of annexin (ANN) genes under low to moderate stress (MS) suggests that annexins may mediate Ca²^+^signaling and coordinate ion transport [60] (Tab. S9).
Collectively, these results support a comprehensive model in which Ca²^+^-mediated signaling integrates ROS production, MAPK activation, ABA signaling, and ion transport to orchestrate adaptive responses of G. jasminoides under salt stress (Fig. 6).
QRT-PCR validation of RNA-seq data
To validate RNA-seq results, eight DEGs were examined by qRT-PCR, covering three functional categories: antioxidant defense (GjAPX6,* GjGST6*,* GjPOD11*,* GjSOD1*), calcium signaling (GjABA1,* GjCML2*,* GjCML6*), and ion homeostasis (GjSOS2). Antioxidant enzyme-encoding genes GjAPX6,* GjGST6*, and GjPOD11 were up-regulated in a concentration-dependent manner, whereas GjSOD1 was down-regulated. Within the signaling category, GjABA1 peaked under LS, whereas GjCML2 and GjCML6 were strongly induced under SS. GjSOS2 expression was slightly reduced under SS relative to LS and MS. qRT-PCR expression patterns (bar charts) were compared with RNA-seq trends (line charts) across CK, LS, MS, and SS (Fig. 7). Results were consistent between the two approaches, confirming the reliability of RNA-seq data in this study.
Fig. 7qRT-PCR validation of RNA-Seq data. Real-time PCR analysis of eight selected DEGs. These data are expressed as the mean ± SE (n = 3) relative to the control. The left Y-axis represents the relative expression level determined by qRT-PCR, and the right Y-axis represents the transcript abundance from RNA-seq, expressed as Log_2_(FPKM + 1) to allow for better visual comparison of trends
Discussion
Photosynthetic integrity and oxidative balance
Photosynthesis is a primary target of salt stress, and maintaining its functionality is paramount for survival [61, 62]. Extensive research on model plants and woody perennials has established a consensus regarding the physiological cascade triggered by salt injury, particularly concerning photosynthetic damage and antioxidant responses [63–66]. Miller et al. [65] discovered in Oryza sativa and A. thaliana that salt stress disrupts the chloroplast electron transport chain, precipitating ROS accumulation and activating nuclear-encoded antioxidant genes via retrograde signaling pathways. Similar patterns have been reported in ecologically or phylogenetically related woody crops. For instance, Ramalho et al. [67] investigated the stress response of coffee (Coffea spp.), a member of the Rubiaceae family, demonstrating that abiotic stress induces stomatal limitations and impairs C-assimilation, thereby triggering a strong antioxidative response to mitigate oxidative damage. Similarly, Ye et al. [68] observed that Ginkgo biloba counters salinity-induced PSII inhibition by mobilizing synergistic antioxidant mechanisms to preserve cellular integrity. Salt-tolerant varieties mitigated this damage by rapidly upregulating SOD and POD activities. Collectively, these findings underscore that the synergy between photosynthetic integrity and robust enzymatic defenses constitutes a cornerstone of salt tolerance [69].
To elucidate the specific adaptive strategies of G. jasminoides, we simultaneously monitored photosynthetic indicators and ROS-related markers temporally. Results indicated that during the early phase (Days 1–5), the photosynthetic apparatus remained relatively stable. However, a distinct physiological turning point occurred on Day 15, characterized by a precipitous decline in Fv/Fm alongside a sharp rise in Fo (Fig. S1). This shift signifies a transition from short-term acclimation to significant physiological stress [70]. Based on these multi-time-point observations, we selected sampling on day 15 to capture the transcriptomic signature associated with this specific stress state, rather than the transient shock responses characteristic of earlier stages [71].
Consistent with the observed photosystem damage, transcriptomic analysis at Day 15 revealed the significant upregulation of specific GjGST4/27 and GjPOD6/18 genes. This transcriptional response strongly paralleled the marked increase in POD enzyme activity, demonstrating tight coordination between gene expression and enzymatic function (Fig. 1C). However, the CAT pathway exhibited a divergent regulatory pattern: despite the activation of other antioxidants, CAT activity remained suppressed. This likely compromised cellular H₂O₂ scavenging capacity, contributing to the significant accumulation of MDA [72]. In summary, salt adaptation in G. jasminoides involves a trade-off between POD/GST activation and CAT suppression, which directly influences the extent of oxidative damage.
Divergence in osmolyte accumulation and ionic homeostasis
In addition to causing oxidative damage, salt stress significantly reduces extracellular water potential, forcing plants to accumulate osmotic regulators to maintain cell turgor and water uptake [72]. G. jasminoides displayed distinct strategies under varying salinities. Free proline followed a triphasic pattern that peaked at moderate stress before declining, whereas soluble proteins increased progressively to reach a maximum under severe stress. Transcriptomic analysis provides metabolic evidence for this strategic transition. KEGG enrichment results indicated that “glutathione metabolism” was significantly enriched under low-salt stress (CK vs. LS), consistent with early antioxidant defenses (e.g., GST genes). Conversely, under severe stress (CK vs. SS), metabolic fluxes significantly shifted toward “starch and sucrose metabolism” and the “biosynthesis of various plant secondary metabolites.” This suggests that under high-salinity conditions, G. jasminoides mobilizes soluble sugars, secondary compounds, and proteins for coordinated accumulation to preserve osmotic balance and integrity.
Compared to annual crops, the osmotic regulation strategy of G. jasminoides exhibits distinct characteristics. For instance, in wheat (Triticum aestivum) and barley (Hordeum vulgare), proline typically accumulates in a nearly linear fashion with increasing stress intensity to maintain turgor pressure throughout the entire growth cycle [73]. However, in G. jasminoides, the later decline in proline suggests it primarily functions as a transient signaling molecule or a short-term buffer. In contrast, the progressive accumulation of soluble proteins aligns with long-term adaptation patterns observed in woody plants such as Populus euphratica [74]. These perennial species often prioritize the synthesis of stable macromolecules in persistently saline environments to prolong leaf longevity and maintain cellular integrity [5].
Regarding ion homeostasis, Na⁺ efflux is typically mediated by the SOS signaling pathway via plasma membrane Na⁺/H⁺ antiporters [75]. Interestingly, our RNA-seq data revealed that despite the physiological requirement for ion transport, the transcriptional levels of GjSOS1 and GjSOS2 remained unchanged across treatments (Fig. 6). This implies that G. jasminoides may rely more on the rapid activation of pre-existing transporters rather than de novo transcriptional upregulation to increase protein abundance. This observation aligns with the classical salt stress signaling model, wherein calcium-responsive kinase complexescan directly regulate the activity of transporters like SOS1 through phosphorylation without altering their mRNA levels [52]. Consequently, ion homeostasis in G. jasminoides is likely maintained through such post-translational modification mechanisms. The significant upregulation of GjCDPKs in our dataset provides molecular support for this hypothesis, suggesting that G. jasminoides maintains ion balance primarily via post-translational regulation, enabling rapid and reversible modulation of ion transport activity.
Integrating Ca2+–MAPK–hormone signaling
To coordinate the physiological adaptation processes described above, G. jasminoides employs a hierarchical signaling network. Signal perception and transduction constitute the initial steps in activating stress tolerance mechanisms. Established models posit that cytosolic Ca²⁺ signatures act as primary sensors for Na⁺ toxicity, triggering phosphorylation cascades [59]. In this study, this classical pathway was clearly activated, evidenced by the significant upregulation of a suite of calcium sensor genes, particularly calmodulin-like proteins (GjCMLs) and calcium-dependent protein kinases (GjCDPKs) (Fig. 6). Crucially, calcium signaling appears coupled with MAPK cascade activation. KEGG enrichment analysis revealed significant enrichment of the “MAPK signaling pathway” under moderate salt stress (CK vs. MS), suggesting that Ca²⁺ signaling may amplify defense responses via the MAPK module [18].
Downstream of the kinase cascade, transcription factors (TFs) serve as central hubs regulating functional genes. In our study, WRKY family genes exhibited pronounced transcriptional shifts. Tikhomirova et al. [76] highlighted WRKY TFs play a pivotal role in regulating antioxidant systems and enhancing resilience in woody species. Given that the upregulation of GjWRKY33A/B coincides with the expression peaks of GjGSTs and GjPODs, we hypothesize that WRKY33 mediates the link between upstream signaling and ROS scavenging.
Hormonal regulation, particularly via the ABA pathway, is pivotal for balancing survival and growth under stress [56, 57]. Interestingly, we observed that GjPP2C, a key negative regulator of ABA signaling, was significantly upregulated under severe stress (. Combined with the significant decline in GjABA3/4 expression under severe stress, this suggests that G. jasminoides may employ a compensatory negative feedback mechanism by upregulating GjPP2C. This mechanism likely dampens excessive ABA signaling, thereby preventing severe growth arrest. Such a strategy would enable woody plants to maintain basal metabolic and photosynthetic capacities under prolonged salinity, standing in contrast to the rapid, robust stomatal closure mechanism mediated by the CNGC5/6/9/12–OST1/SnRK2.6 axis in Arabidopsis [77].
Breeding potential and integrated stress-responsive network
Based on our integrated physiological and transcriptomic analyses, we propose a mechanistic model for salt adaptation in G. jasminoides**(Fig. 6)**. Upon salt stress perception, cytoplasmic Ca²⁺ sensors (GjCaM/CML, GjCDPK) and the MAPK cascade initiate signaling. These upstream signals converge on GjWRKY, a pivotal integrator coordinating ROS mitigation via GjPOD/GjGST activation, and osmotic adjustment through the ABA–GjPP2C module and the proline-to-protein shift. The synergistic action of this multilayered signaling network enables G. jasminoides to maintain leaf vitality and metabolic integrity under prolonged ionic toxicity, exemplifying a steady-state adaptive mechanism characteristic of woody plants.
The ultimate goal of elucidating salt tolerance mechanisms is to identify elite genetic resources for molecular breeding. This study highlights several candidate genes with high potential for enhancing salt resilience in woody ornamental plants. Yu et al. [78] demonstrated that the overexpression of a WRKY transcription factor (PeWRKY31) from poplar (Populus × euramericana) significantly reduced ROS accumulation and improved membrane integrity in transgenic plants under salt stress. Regarding antioxidant genes, Roxas et al. [79] reported that overexpressing specific GST genes in tobacco enhanced ROS scavenging capacity and significantly improved salt tolerance. Similarly, Ji et al. [80] demonstrated that the heterologous expression of a glutathione S-transferase gene (GsGST) from wild soybean (Glycine soja) effectively enhanced salt tolerance and mitigated oxidative damage in transgenic plants. These cases provide cross-species corroboration for the application potential of the GjGSTs identified in this study. Therefore, developing molecular markers linked to genes associated with long-term salt tolerance in G. jasminoides will lay the foundation for implementing molecular marker-assisted selection (MAS) in woody plant breeding. However, further validation is required to definitively establish the regulatory roles of these candidate genes. Future validation via overexpression, RNAi, or CRISPR/Cas9 in G. jasminoides or model plants is essential to confirm their regulatory roles and breeding value.
Conclusion
This study integrated physiological and transcriptomic analyses to elucidate the responses of G. jasminoides leaves to four levels of salt stress (CK, LS, MS, SS). Antioxidant enzymes and osmolytes exhibited distinct temporal patterns, with POD and GST activation forming the core of ROS detoxification, whereas soluble proteins and proline provided complementary roles in osmotic adjustment and structural stabilization. Transcriptome profiling identified key regulators of Ca²^+^ signaling (CNGCs, CaM/CMLs, CDPKs), MAPK–WRKY cascades, and ABA signaling (PP2C–SnRK2), which together form a coordinated regulatory network for salt adaptation. The reliability of RNA-seq data was confirmed by qRT-PCR validation of eight representative genes spanning antioxidant defense, calcium signaling, and ion homeostasis. We propose a Ca²^+^–ROS–MAPK–ABA model in which converging signals fine-tune ROS homeostasis, ion balance, and stomatal regulation in a stress-intensity-dependent manner. Within this framework, WRKY transcription factors and GST family members emerged as promising salt-responsive candidates for functional validation and molecular breeding. Collectively, these findings establish G. jasminoides as a model for understanding salt adaptation in woody perennials and provide valuable genetic resources for developing salt-tolerant ornamental and crop plants.
Supplementary Information
Supplementary Material 1.
The reference list from the paper itself. Each links out to its DOI / PubMed record.
- 1Ábrahám E, Hourton-Cabassa C, Erdei L, Szabados L. Methods for determination of proline in plants. In: Sunkar R, editor. Plant stress tolerance: Methods and Protocols. Totowa, NJ: Humana Press; 2010. p. 317–31. 10.1007/978-1-60761-702-0_20.10.1007/978-1-60761-702-0_2020387056 · doi ↗ · pubmed ↗
- 2Mendiburu FD, Agricolae. Statistical procedures for agricultural research. R Package Version 1.3–7. 2023. https://CRAN.R-project.org/package=agricolae.
- 3Hameed A, Ahmed MZ, Hussain T, Aziz I, Ahmad N, Gul B, Nielsen BL. Effects of salinity stress on chloroplast structure and function. Cells. 2021;10(8):2023.10.3390/cells 10082023 PMC 839501034440792 · doi ↗ · pubmed ↗