Developmental dopamine loss rewires striatal circuits to promote locomotion
Jie Dong, Breanna T. Sullivan, Victor M. Martinez Smith, Lupeng Wang, Lulu Tian, Justin Kung, Bin Song, Shirong Lin, Andreanna Le, Lixin Sun, Lisa Chang, Jinhui Ding, Weidong Le, Jun Jia, Huaibin Cai

TL;DR
This study shows that early loss of dopamine neurons in mice leads to changes in brain circuits that unexpectedly increase movement, offering new insights into Parkinson's disease.
Contribution
The study reveals a novel circuit-level adaptation in the striatum following developmental dopamine loss, linking it to hyperlocomotion in a mouse model of Parkinson's disease.
Findings
Pitx3-deficient mice show a decreased patch dSPN:patch iSPN ratio and altered projections to brain regions.
Optogenetic stimulation of patch SPNs promotes locomotion in Pitx3-deficient mice, unlike in controls.
The observed circuit rewiring may explain the paradoxical hyperlocomotion in dopamine-deficient mice.
Abstract
Motor symptoms of Parkinson’s disease (PD) primarily result from the degeneration of nigrostriatal dopaminergic neurons (DANs), particularly the Aldehyde Dehydrogenase 1A1-positive (ALDH1A1⁺) subpopulation. Pitx3-deficient mice exhibit selective developmental loss of ALDH1A1⁺ DANs but paradoxically display hyperlocomotion, suggesting compensatory changes in striatal circuitry. The dorsal striatum contains four main types of spiny projection neurons (SPNs): patch (or striosome) and matrix subtypes of both direct-pathway (dSPNs) and indirect-pathway (iSPNs). Activation of patch dSPNs suppresses locomotion by inhibiting ALDH1A1⁺ DANs. We combined RNAscope in situ hybridization with SPN subtype-specific reporter mice to quantify patch and total dSPNs and iSPNs in Pitx3-deficient and control mice. Three patch SPN reporter lines (Kremen12A − Cre, Nr4a1-GFP, and PdynIRES−Cre) were used to map…
Genes, proteins, chemicals, diseases, species, mutations and cell lines named across the full text — each resolved to its canonical identifier and authoritative record.
Click any figure to enlarge with its caption.
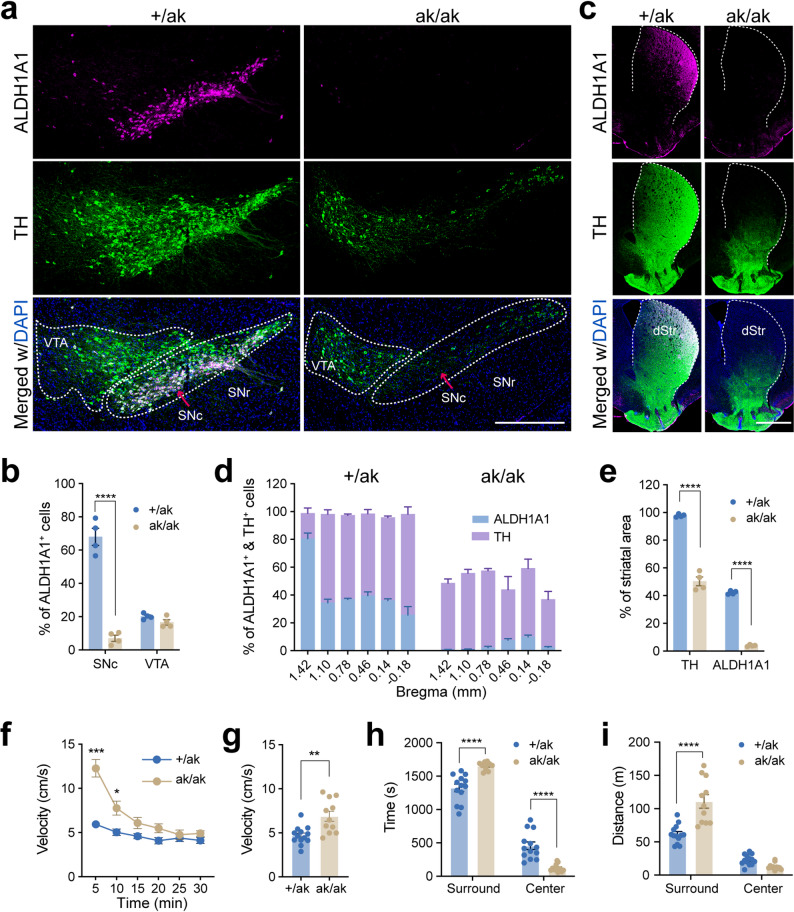 Figure 1
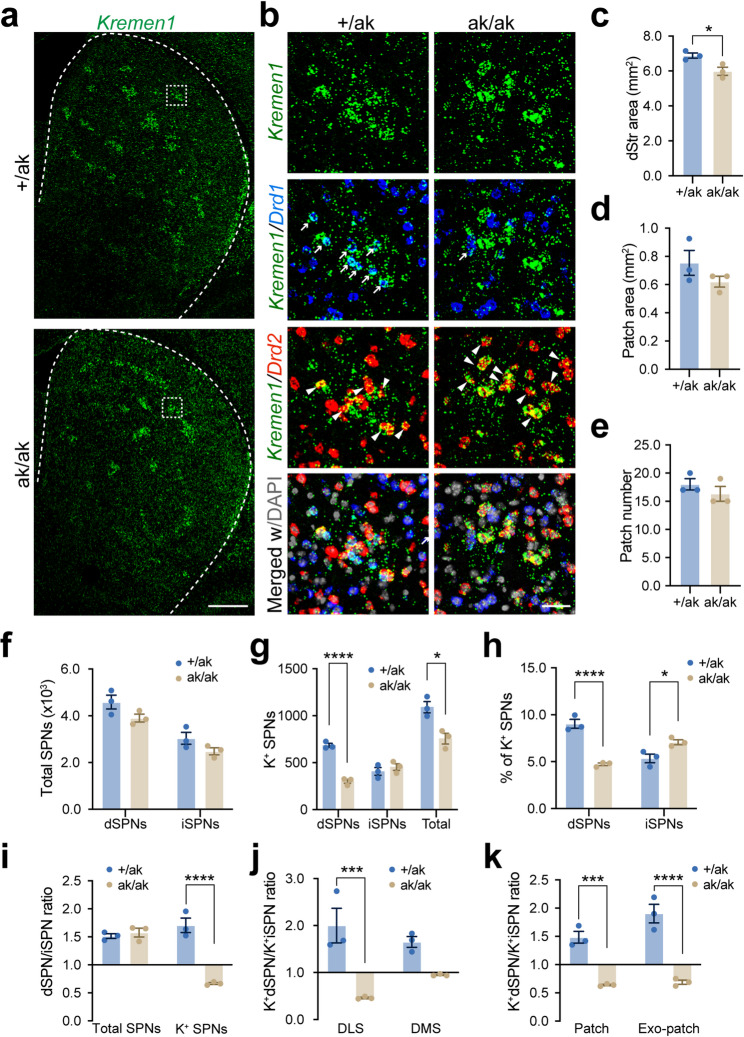 Figure 2
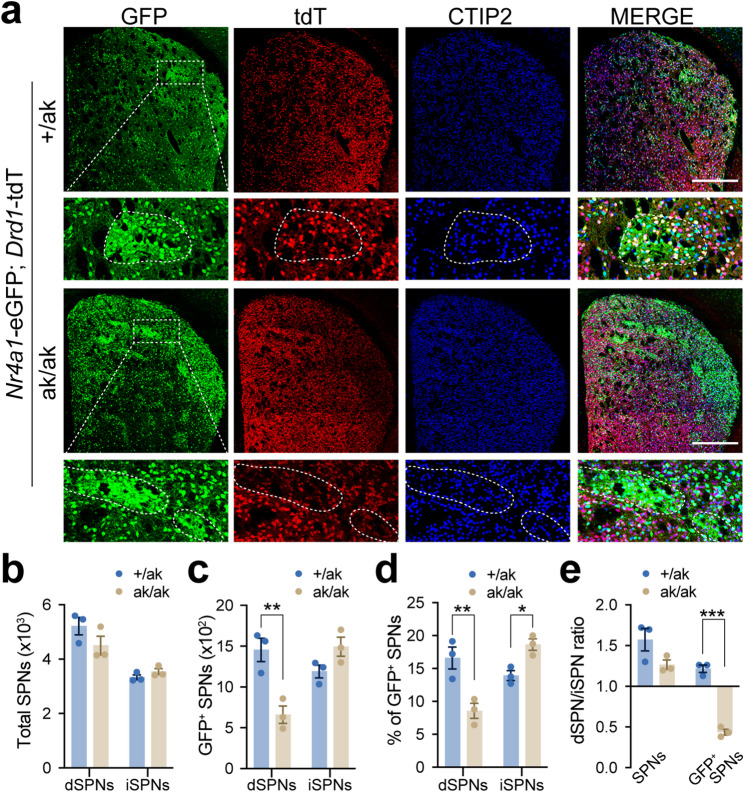 Figure 3
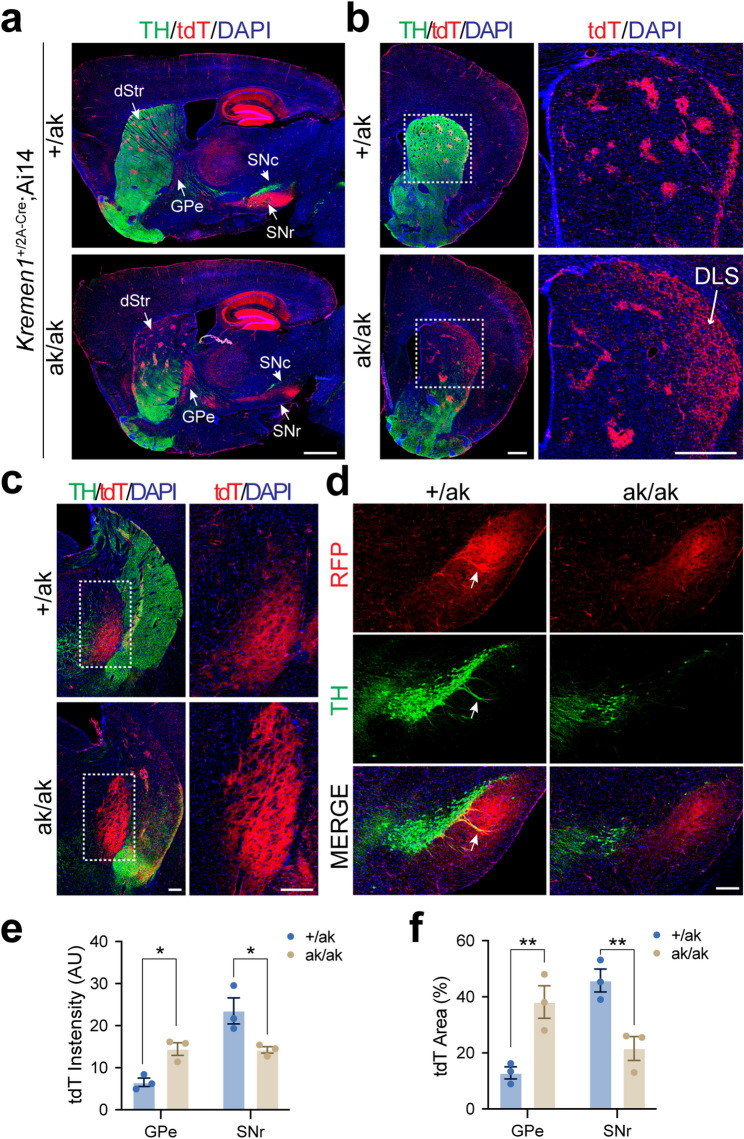 Figure 4
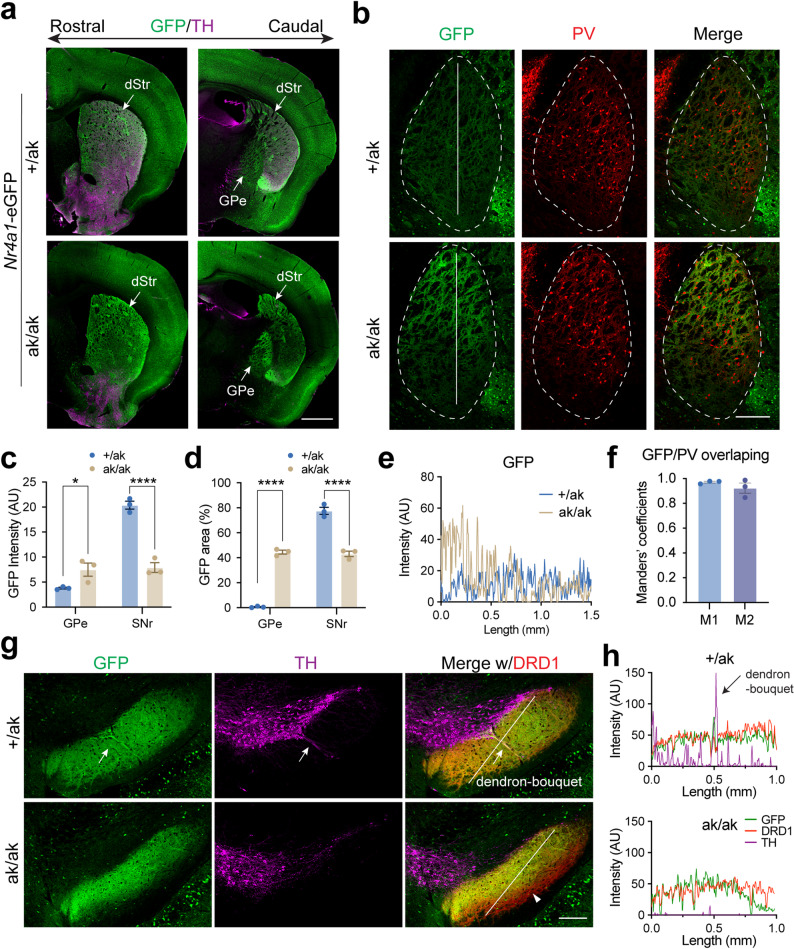 Figure 5
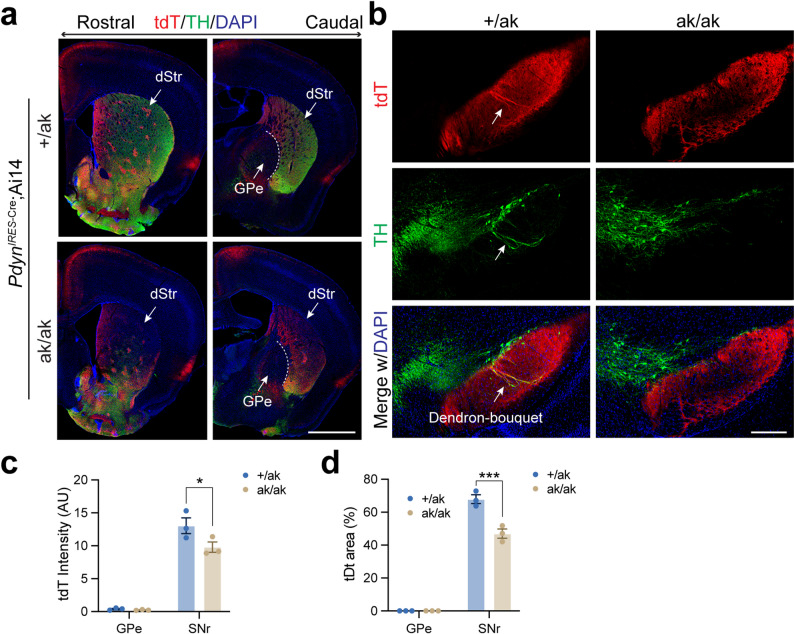 Figure 6
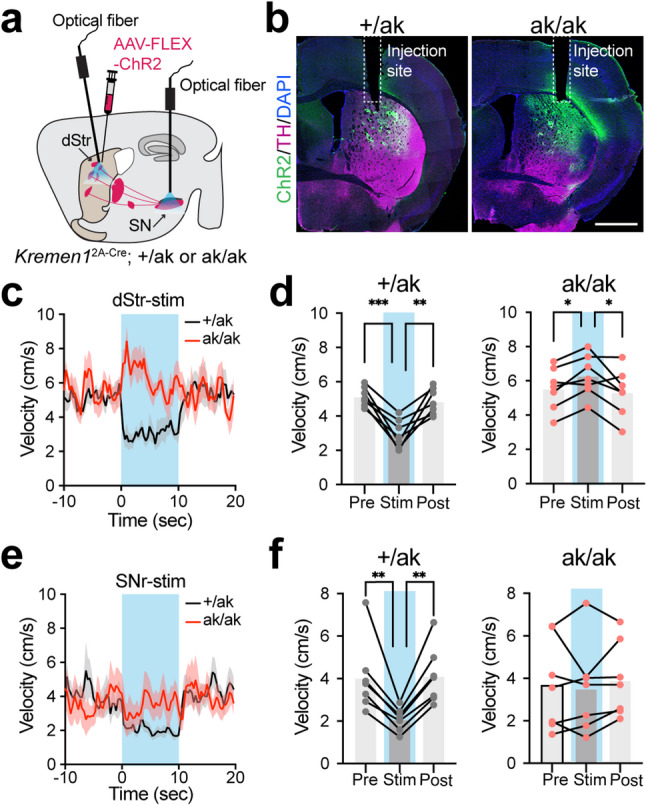 Figure 7
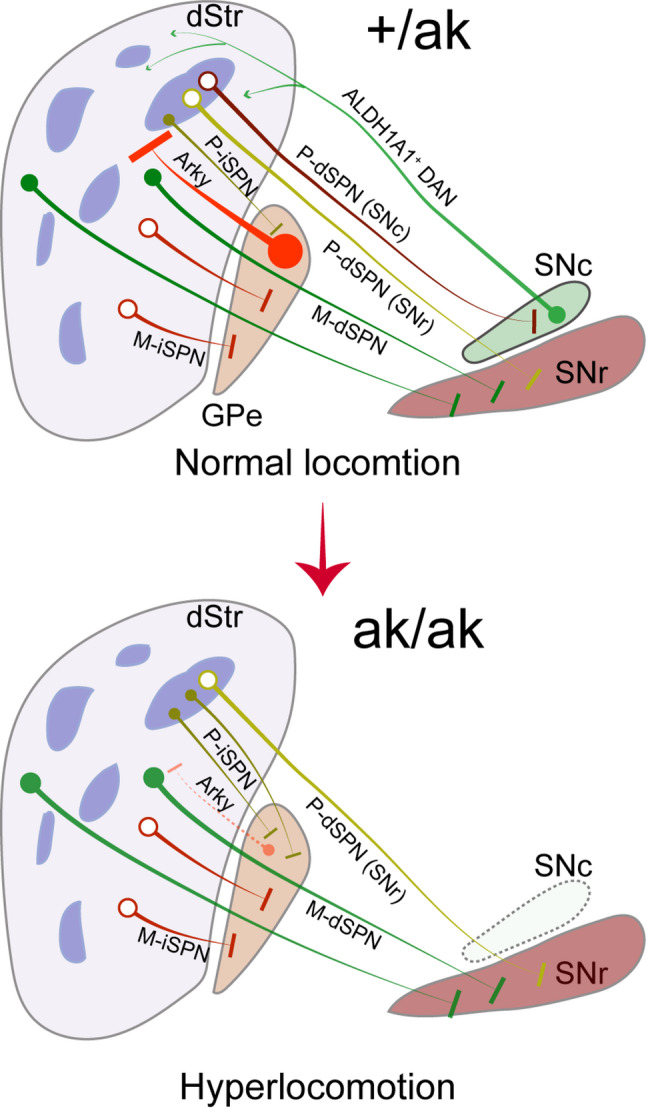 Figure 8
- —National Institute on Aging (NIA)
Peer Reviews
No public reviews on file for this paper yet. If you reviewed it on a platform where reviews are public (OpenReview, ICLR, NeurIPS, ICML), you can paste yours below so the community can read it here.
Videos
No videos yet. Explain this paper in a talk, walkthrough, or lecture? Add one.
Taxonomy
TopicsNuclear Receptors and Signaling · Parkinson's Disease Mechanisms and Treatments · Nerve injury and regeneration
Background
Patients with Parkinson’s disease (PD) experience progressive motor symptoms, including resting tremor, slowed movement, and impaired posture and balance [1]. In addition to these motor issues, they often suffer from non-motor symptoms such as depression and dementia [2]. While medications and surgical interventions can improve motor function, long-term medication can lead to severe side effects, including dyskinesia and impulse control disorders [3, 4]. Therefore, there is a continuing need for new mechanistic insights and therapeutic strategies to improve treatment options for the growing number of PD patients [5].
The motor symptoms of PD are primarily associated with the degeneration of midbrain dopaminergic neurons (DANs) in the substantia nigra compacta (SNc) [6, 7], particularly the Aldehyde Dehydrogenase 1A1-positive (ALDH1A1^+^) subset in its ventral tier [8–11]. The ALDH1A1^+^ SNc DANs accounts for 60–70% DANs in human and rodent SNc and mainly project to the dorsal portion of dorsal striatum [8, 10, 12, 13]. In naturally occurring Pituitary homeobox 3 (Pitx3)-deficient aphakia (or Pitx3^ak/ak^) mice, midbrain DAN differentiation remains unaffected at embryonic day 11.5 (E11.5) [14]. However, a noticeable reduction in tyrosine hydroxylase (TH)-positive cells destined for the SNc emerges by E12.5 [14], leading to a significant loss of SNc DANs by postnatal day 3 [15]. In contrast, DANs in the ventral tegmental area (VTA) remain largely unaffected [14–17]. Notably, the depleted SNc DANs in these mice predominantly belong to the ALDH1A1^+^ DAN subpopulation [18]. Interestingly, while acute genetic ablation of ALDH1A1^+^ DANs in adult mice slows locomotion [12], the developmental loss of these neurons in Pitx3^ak/ak^ mice does not decrease nighttime movement [19]. Instead, it increases daytime activity [19]. This adaptation likely involves striatal projection neurons (SPNs) in the dorsal striatum, which are the primary targets of midbrain DAN input [20, 21]. Investigating these compensatory mechanisms could provide valuable insights into neuromodulatory strategies for addressing PD-related motor deficits.
In the dorsal striatum, SPNs are broadly classified into two major subtypes based on their molecular identity and projection targets: direct-pathway SPNs (dSPNs), which express dopamine receptor D1 (DRD1) and project to the internal globus pallidus (GPi) and substantia nigra pars reticulata (SNr), and indirect-pathway SPNs (iSPNs), which express dopamine receptor D2 (DRD2) and project to the external globus pallidus (GPe) [22–25]. Both dSPNs and iSPNs are distributed across two complementary compartments—the patch (or striosome) and the matrix, which differ in anatomical organization, gene expression profiles, and connectivity patterns [26–30]. Notably, SPNs with molecular characteristics of patch neurons can also be found scattered within the matrix compartment; these are referred to as “exo-patch” SPNs [31]. Since molecularly labeling does not distinguish between canonical patch and exo-patch locations, we use the term “patchy SPNs” to collectively refer to both populations in this study. Among midbrain DANs, ALDH1A1^+^ DANs in the SNc receive the strongest monosynaptic inhibitory input from patchy dSPNs [12, 32]. Recent studies have shown that activation of patchy dSPNs suppresses locomotion via inhibition of ALDH1A1^+^ DANs and reduction of dopamine release [33–35], whereas patchy iSPNs appear to facilitate movement, highlighting compartment- and cell type-specific functional roles [33, 35]. However, it remains unclear how the developmental loss of ALDH1A1^+^ DANs in Pitx3^ak/ak^ mice affects the organization and function of SPNs, particularly patchy SPNs.
In this study, we examine the structural and functional reorganization of SPNs, with a focus on patchy SPNs, in Pitx3^ak/ak^ mice. We analyze the composition and distribution of molecularly defined patchy dSPNs and iSPNs in the dorsal striatum and assess their projection patterns to the GPe and SNr. Additionally, we use optogenetic approaches to selectively activate patchy dSPNs and iSPNs to determine their impact on locomotion.
Methods
Animals
All mouse procedures were approved by the Institutional Animal Care and Use Committee (IACUC) of the Intramural Research Program at the National Institute on Aging (NIA), NIH, and conducted in accordance with institutional and NIH guidelines. All mouse lines were maintained as heterozygotes on a C57BL/6J background. The following strains were obtained from The Jackson Laboratory: Pitx3^ak/ak^ (Stock No: 000942) [17], *Drd1–*tdTomato (Stock No: 016204) [36], Pdyn^IRES−Cre^ (Stock No: 027958) [37], and Ai14 (Stock No: 007908) [38]. The Pitx3^ak/ak^ mice were backcrossed with C57BL/6J for more than five generations. The Kremen1^2A − Cre^ knock-in mice [33] were generated by Shanghai Model Organisms Inc. (Shanghai, China), while the *Nr4a1–*eGFP (Stock No: 036737-UCD) transgenic mice [39] were obtained from the Mutant Mouse Resource & Research Centers (MMRRC).
To examine the projections of patchy dSPNs and iSPNs, three patchy SPN mouse lines (Kremen1^2A − Cre^, Pdyn^IRES−Cre^, and *Nr4a1–*eGFP) were bred into the Pitx3^ak/ak^ background, and their littermates Pitx3^+/ak^ were used as control in the experiments. Both male and female mice were used in all experiments. Mice were group-housed (2–5 per cage) under a 12-hour light/dark cycle with ad libitum access to water and standard chow. Behavioral experiments were conducted during the light phase. Littermates were randomly assigned to experimental groups before study onset. All mice used for behavioral, RNAscope and histological analyses were 3–5 months of age.
RNA in situ hybridization and image analysis
RNA in situ hybridization (RNAscope, ACDBio) was performed to detect Drd1, Drd2, and Kremen1 mRNAs in the dorsal striatum of adult C57BL/6J mice. Mice were euthanized with CO₂ inhalation. Brains were fresh-frozen on dry ice and stored at − 80 °C. Coronal section (12 μm) were cut on a cryostat (Leica Biosystems) and stored at − 80 °C.
RNAscope was performed using the Multiplex Fluorescent Reagent Kit v2 per the manufacturer’s instruction. Probes used included: Drd1 (Cat. No. #401901), Drd2 (Cat. No. #406501), and Kremen1 (Cat. No. #425771). Images were acquired on a Zeiss LSM 780 laser scanning confocal microscope with 20× or 40× objectives. Five sections were analyzed spanning a rostro-caudal range from approximately 1.34 mm to − 0.34 mm relative to Bregma.
Image analysis was conducted using Imaris v10.0 (Bitplane, Belfast, UK). Dorsal and ventral striatal regions were delineated using the Allen Brain Atlas. The dorsal striatum was subdivided into lateral and medial regions along the mediolateral axis. Spatial patches were defined as clusters of at least five Kremen1^+^ SPNs with a minimum density of 200 cells/mm². Channels (Drd1, Drd2, Kremen1, and DAPI) were analyzed with consistent parameters within each batch; minor adjustments across batches ensured optimal quantification. DAPI^+^ cells were classified as Drd1^+^ (dSPNs) or Drd2^+^ (iSPNs) based on mean fluorescence intensity. Overlap with Kremen1 signal was used to quantify patchy dSPNs and iSPNs. Data points represent averages across multiple bilateral striatal sections.
Immunohistochemistry
Mice were anesthetized with pentobarbital and transcardially perfused with PBS followed by 4% paraformaldehyde (PFA). Brains were post-fixed overnight at 4 °C, then cryoprotected in 30% sucrose (PBS-buffered) for ≥ 48 h. Coronal Sect. (40 μm) were cut and stored in PBS with 4% sodium azide at 4 °C.
Sections were blocked for 1 h at room temperature in 10% normal donkey serum, 0.5% BSA, and 0.3% Triton-X-100. They were incubated with primary antibodies overnight or for 48 h at 4 °C, washed (3 × 10 min, PBS), and then incubated with secondary antibodies for 1 h. Some sections were counterstained with DAPI (0.5 mg/mL, 1 min, Invitrogen, D1306) and mounted using ProLong Gold Antifade Mountant (Life Technologies). Images were captured using a Zeiss LSM 780 or LSM 980 confocal microscope.
Primary antibodies used: polyclonal rabbit anti-PITX3 (1:500) [40], rabbit anti-TH (Pel-Freez Biologicals, P40101; 1:1000), goat anti-ALDH1A1 (R&D system; 1:1000), guinea pig anti-PV (Swant, GP72; dilution 1:1000), goat anti-ChAT (AB144P, Millipore; dilution 1:500) and rat anti-CTIP2 (abcam, ab18465, 1:500). Secondary antibodies (Life Technologies) were selected for appropriate fluorophore spectra.
Quantification of TH+ and ALDH1A1+ neurons
Midbrain Sect. (40 μm) spanning Bregma − 2.70 mm to − 3.80 mm (seven sections per mouse) were stained for TH, ALDH1A1 and DAPI. Z-stack confocal images were captured at 20× magnification. Neurons in the SNc and VTA were quantified using the “Detect Cells*”* functions in NeuroInfo (MBF Bioscience). Regions were manually delineated using previously established anatomical landmarks. Total neuron numbers were estimated using “Area Under the Curve” analysis in GraphPad Prism 10.
Quantification of TH+ and ALDH1A1+ axon terminal in the striatum
Five to six striatal sections across a rostro-caudal series (approximately 1.42 mm to -0.2 mm relative to Bregma) were co-stained for TH and ALDH1A1. Images were acquired with 10 × objective on the Zeiss LSM780. ALDH1A1^+^ areas in the dorsal striatum were outlined using intensity threshold in ImageJ. For each section, the percentage of ALDH1A1^+^ area relative to total striatal area was calculated.
Quantification of Nr4a1-eGFP+ cells in the dorsal striatum
In Nr4a1-eGFP; Drd1-tdTomato mice on either Pitx3^+/ak^ or Pitx3^ak/ak^ backgrounds, striatal sections spanning from Bregma 1.34 mm to -0.34 mm (5 sections per each mouse) were stained for CTIP2 and imaged using a Zeiss LSM 780 laser scanning confocal microscope with a 10× objective. Dorsal striatal regions were delineated according to the Allen Brain Atlas. Cell quantification was performed using Imaris v10.0 (Bitplane, Belfast, UK). CTIP2^+^ cells were identified as SPNs and further classified as tdT^+^ (dSPNs) and tdT-negative (iSPNs) based on median fluorescence intensity. Overlap with GFP^+^ signal was used to quantify Nr4a1-eGFP^+^ dSPNs and iSPNs. Minor threshold adjustments were applied across batches to ensure optimal quantification.
Quantification of fluorescence intensity and cell density
Fluorescence intensity and cell density were quantified using ImageJ. For each mouse, 3–8 striatal or midbrain sections at different Bregma levels were analyzed. For SNr and GPe regions, RFP or GFP integrated fluorescence density was calculated by delineating the regions of interest based on anatomical landmarks in the Allen Brain Atlas.
To assess fluorescence distribution, “Plot Profile” function was used to generate intensity plots along the drawn line. Colocalization analysis between GFP^+^ and PV^+^ signals was performed using the “Coloc2” function in ImageJ to calculate Manders’ coefficients M1 and M2, indicating the proportion of GFP signal overlapping with PV and vice versa.
For cell density analysis, PV^+^ and ChAT^+^ cells were automatically counted in the dorsal striatum by setting the particle diameter. The counting area was measured, and cell density was calculated as the number of positive cells per mm².
Stereotaxic viral injection and optic fiber implantation
Stereotaxic surgeries were performed under aseptic conditions. Mice (2–4 months old) were anesthetized with 1–2% isoflurane and placed in a stereotaxic frame (Kopf Instruments). A total of 700 nL of AAV was bilaterally injected into the dorsal striatum (AP: +0.9 mm; ML: ±2.2 mm; DV: −2.5 mm) at 75 nL/min using a microinjector (Stoelting). Vectors included AAV1-EF1a-double floxed-hChR2(H134R)-EYFP (#20298) and AAV1-Ef1a-DIO-EYFP (#27056) from Addgene (Watertown, MA, USA). The needle was left in place for 5 min post-injection before withdrawn. Incisions were closed and mice recovered in home cages.
After three weeks, optical fibers (200 μm core, 0.39 NA; Thorlabs) were bilaterally implanted targeting either the dorsal striatum (AP: +1.0 mm; ML: ±1.5 mm; DV: −2.2 mm to − 2.7 mm) or SNr (AP: −3.1 mm; ML: ±1.5 mm; DV: −4.1 mm DV). Fibers were secured with radiopaque adhesive cement (C&B METABOND, Parkell) and incisions were sealed with Vetbond tissue adhesive (3 M). Mice recovered for ≥ 1 week before testing.
Open-field spontaneous locomotion
Freely moving mice were assessed for spontaneous locomotion via video tracking. Prior to testing, mice were habituated for 30 min. The arena (50 × 50 cm, opaque gray) was lit diffusely using an enclosed 20 W lamp. Mice were recorded for 30 min at 30 Hz from above using a digital camera. For analysis, the arena was divided into a center zone (central 25 × 25 cm) and a surrounding zone. Data on velocity, distance, and time traveled were analyzed with EthoVision XT (Noldus).
Optogenetics in the open field test
Light delivery was controlled using an LED source and commutator (PlexBright, Plexon) connected via a patch cable (200 μm, 0.39 NA). Connections were made with ceramic sleeves (Thorlabs). Light power (465 nm) was calibrated to 3 mW at the fiber tip (Thorlabs PM100D). For ChR2 activation, 5-ms light pulses were delivered at varying frequencies and durations controlled via a TTL signal generator (OPTG-4, Doric Lenses).
Mice were habituated for 30 min before testing. The arena (50 × 50 cm, transparent walls) was cleaned between sessions. Mice were recorded from both top and side views (Logitech cameras) at 15 Hz. After a 3-minute baseline, optogenetic stimulation was applied bilaterally in 10 s ON / 1 min OFF cycles. Video and TTL signals were synchronized using Synapse software (TDT). Locomotion metrics were analyzed in EthoVision XT.
Statistical analysis
Statistical analyses were performed in GraphPad Prism 10 and custom MATLAB scripts (MathWorks). Data are presented as mean ± SEM. Specific statistical tests are reported in figure legends. Significance was assessed using two-tailed t-tests, one-way ANOVA, or two-way ANOVA, with thresholds of p < 0.05 (^^), p < 0.01 (^^), p < 0.001 (^^), and p < 0.0001 (^****^).
Results
Pitx3ak/ak mice exhibit hyperlocomotion despite the loss of ALDH1A1⁺ DANs
Consistent with previous findings [14, 16, 17], PITX3 expression was completely absent in midbrain DANs of Pitx3^ak/ak^ mice (Supplementary Fig. S1a). Loss of Pitx3 resulted in a selective depletion of ALDH1A1^+^ DANs in the ventral SNc, whereas ALDH1A1^+^ VTA DANs remained largely intact (Fig. 1a and b). Accordingly, ALDH1A1^+^ axon projections were severely reduced in the dorsal striatum of Pitx3^ak/ak^ mice (Fig. 1c-e). In contrast, the numbers of ALDH1A1– SNc DANs were comparable between control and Pitx3^ak/ak^ mice, whereas ALDH1A1– VTA DANs were markedly reduced in the mutant animals (Supplementary Fig. S1b).
Fig. 1. Preferential loss of ALDH1A1⁺ SNc DANs and hyperlocomotion in Pitx3^ak/ak^ mice. a Representative image showing ALDH1A1 (magenta), TH (green), and DAPI (blue) immunolabeling in the midbrain of Pitx3^+/ak^ and Pitx3^ak/ak^ mice. Dashed lines outline the substantia nigra pars compacta (SNc) and ventral tegmental area (VTA). Scale bar, 500 μm. b Percentage of ALDH1A1⁺ cells among TH⁺ cells in the SNc and VTA. Two-way ANOVA followed by Sidak’s post hoc correction: Genotype, F (1, 6) = 116.6, ^^p < 0.0001; Region, F (1, 6) = 49.49, ^^p = 0.0004; Interaction, F (1, 6) = 116.6, ^^p < 0.0001. Multiple comparisons: SNc, ^^p < 0.0001; VTA, p = 0.6346. N = 4 mice per group (b – e). c Representative images of ALDH1A1 (magenta), TH (green), and DAPI (blue) staining in the dorsal striatum. Dashed lines indicate the boundaries of the dorsal striatum. Scale bar, 1 mm. d Quantification of ALDH1A1⁺ and TH⁺ signal as a percentage of total striatal area across multiple bregma levels (n = 4 mice per genotype). e Group averages of the percentage of ALDH1A1⁺ and TH⁺ areas relative to the total striatum area from (d). Unpaired two-tailed t-test: TH, t (6) = 14.57, ^**^p < 0.0001; ALDH1A1, t (6) = 57.21, ^^p < 0.0001. f Locomotor velocity over time during a 30-min open-field test. Two-way ANOVA followed by Sidak’s post hoc correction: Genotype, F (1, 22) = 13.02, ^^p = 0.0016; Time, F (2.42, 53.27) = 75.72, ^^p < 0.0001; Interaction, F (5, 110) = 28.59, ^^p < 0.0001. Multiple comparisons: 5 min, ^^p = 0.0003; 10 min, ^^p = 0.042. g Average velocity across the 30-min session from (f). Unpaired two-tailed t-test, t (22) = 3.608, ^**^p = 0.0016. h Time spent in surround and center zones of the open field. Two-way ANOVA followed by Sidak’s post hoc correction: Genotype, F (1, 22) = 0.000, p > 0.9999; Area, F (1,22) = 347.8, ^^p < 0.0001; Interaction, F (1, 22) = 26.77, ^**^p < 0.0001. Multiple comparisons: Surround, ^^p < 0.0001; Center, ^^ p < 0.0001. i Distance traveled in the surround and center zones. Two-way ANOVA followed by Sidak’s post hoc correction: Genotype, F (1, 22) = 13.02, ^^p = 0.0016; Area, F (1, 22) = 176.0, ^^p < 0.0001; Interaction, F (1, 22) = 33.20, ^**^p < 0.0001. Multiple comparisons: Surround, ^***^p < 0.0001; Center, p = 0.3426. Sample sizes: Pitx3^+/ak^, n = 7 males, 6 females; Pitx3^ak/ak^, n = 4 males, 7 females (f–i). Data are presented as mean ± SEM
Unexpectedly, Pitx3^ak/ak^ mice displayed hyperactivity in the open-field test compared to littermate controls (Fig. 1f and g). Mutant mice also spent significantly more time and traveled longer distances in the peripheral zone relative to the center (Fig. 1h and i), indicative of elevated anxiety-like behavior. This paradoxical increase in locomotor activity despite the loss of ALDH1A1^+^ DANs suggests a possible developmental compensatory mechanism, potentially involving circuit-level reorganization of SPNs.
Significant reduction in patchy dSPNs and increase in patchy iSPNs in Pitx3ak/ak mice
To assess changes in SPN subtypes, we performed multiplexed RNAscope in situ hybridization using probes for Drd1, Drd2, and Kremen1, which label dSPNs, iSPNs, and a subset of patchy SPNs, respectively [33, 41]. This approach allowed us to map the composition and distribution of SPN subtypes in the dorsal striatum of Pitx3^ak/ak^ and littermate control mice (Fig. 2a and b). Although Pitx3-deficiency led to a significant reduction in the overall surface area of the dorsal striatum (Fig. 2c), it did not alter the size or number of patch-like structures (Fig. 2d and e), nor did it affect the total numbers of dSPNs or iSPNs (Fig. 2f).
Fig. 2. Altered numbers of Kremen1^+^ dSPNs and iSPNs in Pitx3^ak/ak^ mice. a,** b** Representative confocal images showing RNAscope labeling of Kremen1(green), Drd1 (blue), Drd2 (red), and DAPI (gray) in the dorsal striatum (dStr) of Pitx3^+/ak^ and Pitx3^ak/ak^ mice. Right panels show high-magnification views of boxed regions from the left panels. Scale bars: 500 μm (left), 50 μm (right). c Quantification of total dStr area. Unpaired two-tailed t-test: t (4) = 3.239, ^^p = 0.032. d,** e** Quantification of spatial patch area (d) and patch number (e) in Pitx3^+/ak^ and Pitx3^ak/ak^ mice. Unpaired t-test, patch area: t (4) = 1.379, p = 0.24; patch number: t (4) = 1.000, p = 0.37. Spatial patches were defined as clusters of ≥ 5 Kremen1⁺ SPNs with local density ≥ 200 cells/mm². f Total numbers of dSPNs and iSPNs in the dStr. Two-way ANOVA followed by Sidak’s post hoc correction: Genotype, F (1, 4) = 4.000, p = 0.1161; Subtype, F (1, 4) = 269.7, ^^p < 0.0001; Interaction, F (1, 4) = 0.5594, p = 0.4961. Multiple comparisons: dSPN, p = 0.1274; iSPN, p = 0.2355. g Numbers of Kremen1⁺ dSPNs and iSPNs in the dStr. Two-way ANOVA followed by Sidak’s post hoc correction: Genotype, F (1, 4) = 16.35, ^^p = 0.0156; Subtype, F (1, 4) = 20.01, ^^p = 0.0110; Interaction, F (1, 4) = 232.9, ^^p = 0.0001. Multiple comparisons: dSPN, ^^p < 0.0001; iSPN, p = 0.5309. Unpaired two-tailed t-test was used for the analysis of Kremen1⁺ total SPNs: t (4) = 4.044, ^^p = 0.0156. h Proportion of Kremen1⁺ dSPNs among total dSPNs, and Kremen1⁺ iSPNs among total iSPNs. Two-way ANOVA followed by Sidak’s post hoc correction: Genotype, F (1, 4) = 7.755, ^^p = 0.0496; Subtype, F (1, 4) = 8.646, ^^p = 0.0424; Interaction, F (1, 4) = 180.8, ^^p = 0.0002. Multiple comparisons: dSPN, ^^p < 0.0001; iSPN, ^^p = 0.0201. i Ratio of dSPNs to iSPNs and of Kremen1⁺ dSPNs to Kremen1⁺ iSPNs. Two-way ANOVA followed by Sidak’s post hoc correction: Genotype, F (1, 4) = 29.59, ^^p = 0.0055; Subtype, F (1, 4) = 29.77, ^^p = 0.0055; Interaction, F (1, 4) = 69.92, ^^p = 0.0011. Multiple comparisons: Total SPN, p = 0.8421; K^+^ SPN, ^^p < 0.0001. j Ratio of Kremen1⁺ dSPNs to Kremen1⁺ iSPNs in the dorsal lateral striatum (DLS) and dorsal medial striatum (DMS). Two-way ANOVA followed by Sidak’s post hoc correction: Genotype, F (1, 4) = 23.38, ^^p = 0.0084; Region, F (1, 4) = 0.2594, p = 0.6374; Interaction, F (1, 4) = 8.837, ^^p = 0.0410. Multiple comparisons: DLS, ^^p = 0.0009; DMS, p = 0.0630. k Ratio of Kremen1⁺ dSPNs to Kremen1⁺ iSPNs in the patch and exo-patch region. Two-way ANOVA followed by Sidak’s post hoc correction: Genotype, F (1, 4) = 65.34, ^^p = 0.0013; Compartment, F (1, 4) = 14.89, ^^p = 0.0182; Interaction, F (1, 4) = 9.326, ^^p = 0.0379. Multiple comparisons: Patch, ^**^p = 0.0006; Exo-patch, ^****^p < 0.0001. Data are presented as mean ± SEM. N = 3 mice per group
Notably, the total number of Kremen1^+^ SPNs was reduced in the dorsal striatum of Pitx3^ak/ak^ mice, in which the number of Kremen1^+^ patchy dSPNs was substantially reduced in Pitx3^ak/ak^ mice, whereas the number of patchy iSPNs showed a slight increase (Fig. 2g). Quantification of the proportion of Kremen1^+^ cells within the total dSPN and iSPN populations revealed opposite trends: the fraction of patchy dSPNs was significantly decreased, while that of patchy iSPNs was increased (Fig. 2h). As a result, the ratios of patchy dSPNs to patchy iSPNs was reversed, shifting from 1.7 in control mice to 0.7 in Pitx3^ak/ak^ mice (Fig. 2i). The shift was more pronounced in the dorsolateral striatum (DLS) compared to dorsomedial striatum (DMS) (Fig. 2j) and was observed in both patch and exo-patch regions (Fig. 2k).
These findings were corroborated in an independent patchy SPN reporter model, Nr4a1-eGFP; Drd1-tdTomato; Pitx3^ak/ak^ mice, in which patchy SPNs were labeled by GFP [39], dSPNs by tdTomato (tdT) [36], and iSPNs identified as CTIP2-positive but tdT-negative (CTIP2^+^ /tdT^–^) cells (Fig. 3a-e). CTIP2 is a general marker for SPNs [42]. By contrast, we observed no apparent changes in PV^+^ and ChAT^+^ interneurons in the dorsal striatum of Pitx3^ak/ak^ mice (Supplementary Fig. S2).
Fig. 3. Altered numbers of Nr4a1-eGFP^+^ dSPNs and iSPNs in Pitx3^ak/ak^ mice. a Representative coronal sections of the dorsal striatum from Nr4a1-eGFP; Drd1-tdT mice on Pitx3^+/ak^ and Pitx3^ak/ak^ backgrounds, stained for GFP (green), tdT (red) and CTIP2 (blue). Row 2 and 4 show magnified views of the dotted rectangles in row 1 and 3, respectively. Patch regions are outlined in row 2 and 4. Scale bars: 500 μm. b Quantification of average numbers of dSPNs and iSPNs in the hemi-dorsal striatum of Pitx3^+/ak^ and Pitx3^ak/ak^ mice. Two-way ANOVA followed by Sidak’s post hoc correction: Genotype, F (1, 4) = 0.9691, p = 0.3806; Subtype, F (1, 4) = 35.92, ^^p = 0.0039; Interaction, F (1, 4) = 3.788, p = 0.1235. Multiple comparisons: dSPN, p = 0.1445; iSPN, p = 0.8103. c Quantification of average numbers of Nr4a1-eGFP^+^ dSPNs and iSPNs in the hemi-dorsal striatum. Two-way ANOVA followed by Sidak’s post hoc correction: Genotype, F (1, 4) = 2.438, p = 0.1934; Subtype, F (1, 4) = 74.90, ^^p = 0.0010; Interaction, F (1, 4) = 277.6, ^^p < 0.0001. Multiple comparisons: dSPN, ^^p = 0.0022; iSPN, p = 0.1784. d Percentage of Nr4a1-eGFP^+^ SPNs among total SPNs in the dorsal striatum. Two-way ANOVA followed by Sidak’s post hoc correction: Genotype, F (1, 4) = 1.264, p = 0.3238; Subtype, F (1, 4) = 32.56, ^^p = 0.0047; Interaction, F (1, 4) = 96.43, ^^p = 0.0006. Multiple comparisons: dSPN, ^^p = 0.0024; iSPN, ^*^p = 0.0439. e Ratio of dSPNs to iSPNs and Nr4a1-eGFP^+^ dSPNs to Nr4a1-eGFP^+^ iSPNs in the dorsal striatum. Two-way ANOVA followed by Sidak’s post hoc correction: Genotype, F (1, 4) = 29.05, ^^p = 0.0057; Subtype, F (1, 4) = 149.1, ^^p = 0.0003; Interaction, F (1, 4) = 23.72, ^^p = 0.0082. Multiple comparisons: Total SPN, p = 0.0502; GFP^+^ SPN, ^**^p = 0.0002. Data are presented as mean ± SEM. N = 3 mice per group
Together, these findings from two independent models demonstrate that PITX3 loss selectively alters patchy SPN composition, characterized by a decrease in patchy dSPNs and a relative increase in patchy iSPNs.
Reduced SNr projections from patchy dSPNs and increased GPe projections from patchy iSPNs in Pitx3ak/ak mice
To assess the output pathways of patchy SPNs, we generated Kremen1^2A − Cre^; Ai14 bigenic mice on Pitx3^+/ak^ or Pitx3^ak/ak^ backgrounds, enabling selective labeling of Kremen1^+^ patchy SPNs with tdT. In Pitx3^ak/ak^ mice, axonal projections to the GPe were increased, whereas projections to the SNr were markedly reduced compared to controls (Fig. 4a). Moreover, patchy SPNs in these mice appeared more dispersed and lacked the characteristic clustered organization within the superficial DLS (arrow, Fig. 4b). The increase in projection was localized primarily to the dorsal GPe (Fig. 4c); while dendron-bouquet structures, formed by the dendrites of DANs and axons of patchy dSPN [43], were entirely absent in the SNr (Fig. 4d). Quantitative analyses of serial GPe and SNr sections confirmed these projection changes (Fig. 4e, f).
Fig. 4. Altered distribution and projection patterns of Kremen1⁺ SPNs in the dorsal striatum of Pitx3^ak/ak^ mice. a Representative sagittal brain sections from Kremen1^2A − Cre^; Ai14 mice on Pitx3^+/ak^ and Pitx3^ak/ak^ backgrounds, stained for TH (green), tdT (red), and DAPI (blue). Scale bar, 1 mm. Abbreviations: dStr, dorsal striatum; GPe, globus pallidus externus; SNc, substantia nigra pars compacta; SNr, substantia nigra pars reticulata; tdT, tdTomato. b Coronal sections showing altered tdT signal distribution in the dorsal striatum of Pitx3^ak/ak^ mice. Right panel shows a magnified view of the dashed region in the left panel. Arrow points to the dispersed tdT^+^ neurons in DLS. Scale bar, 500 μm. Abbreviations: DLS, dorsolateral striatum. c Representative coronal sections showing increased tdT signal in the dorsal GPe of Pitx3^ak/ak^ mice. Right panel shows a magnified view of the dashed area. Scale bar, 200 μm. d Reduced tdT signal in the SNr of Pitx3^ak/ak^ mice. Arrows indicate dendron-bouquet structures. Scale bar, 200 μm. e Quantification of tdT integrated signal density in the GPe and SNr. Two-way ANOVA followed by Sidak’s post hoc correction: Genotype, F (1, 4) = 0.1004, p = 0.7672; Projection, F (1, 4) = 32.26, ^^p = 0.0047; Interaction, F (1, 4) = 33.81, ^^p = 0.0044. Multiple comparisons: GPe, ^^p = 0.0319; SNr, ^^p = 0.0147. f Percentage of tdT-positive area in the GPe and SNr. Two-way ANOVA followed by Sidak’s post hoc correction: Genotype, F (1, 4) = 0.005926, p = 0.9423; Projection, F (1, 4) = 19.23, ^^p = 0.0118; Interaction, F (1, 4) = 33.69, ^^p = 0.0004. Multiple comparisons: GPe, ^^p = 0.0062; SNr, ^**^p = 0.0076. Data are presented as mean ± SEM. N = 3 mice per group
Similar alterations in both somatic distribution in the DLS and projection patterns in GPe and SNr were observed in Nr4a1-eGFP; Pitx3^ak/ak^ mice (Fig. 5a-h). Given that dSPNs can send axonal collaterals to the GPe [44], we next examined whether increased dSPN collateralization might account for the enhanced GPe projections. To test this, we analyzed Pdyn ^IRES−Cre^; Ai14 mice, in which tdT preferentially labels patchy dSPNs [45, 46]. In these mice, PITX3 loss did not affect GPe projections but still led to a reduction in SNr projections (Fig. 6a-d). To further investigate the contribution of dSPN collaterals, we examined Nr4a1-eGFP; Drd1-tdT mice and found no difference in tdT signal intensity in the GPe of Pitx3^ak/ak^ and control mice (Supplementary Fig. S3).
Fig. 5. Altered distribution and projection patterns of patchy SPNs in Nr4a1-eGFP mice on a Pix3^ak/ak^ background. a Representative coronal sections from rostral to caudal levels of Nr4a1-eGFP mice on Pitx3^+/ak^ and Pitx3^ak/ak^ backgrounds, stained for TH (magenta). Note the altered GFP signal distribution in the dorsal striatum and dorsal GPe of Pitx3^ak/ak^ mice. Scale bar, 1 mm. Abbreviations: dStr, dorsal striatum; GPe, globus pallidus externus. b GFP signal distribution in the GPe of Pitx3^ak/ak^ mice merged with PV (red) expression in the GPe. Dotted lines outline the GPe. Solid lines indicate the regions used for intensity analysis in e. Scale bar, 250 μm. c Quantification of integrated GFP signal density in the GPe and SNr of Pitx3^+/ak^ and Pitx3^ak/ak^ mice (n = 3 mice per genotype). Two-way ANOVA followed by Sidak’s post hoc correction: Genotype, F (1, 4) = 17.13, ^^p = 0.0144; Projection, F (1, 4) = 133.1, ^^p = 0.0003; Interaction, F (1, 4) = 120.7, ^^p = 0.0004. Multiple comparisons: GPe, ^^p = 0.00408; SNr, ^^p < 0.0001. d Percentage of high GFP-expressing area within the GPe and SNr (Drd1^+^ area) in Pitx3^+/ak^ and Pitx3^ak/ak^ mice (n = 3 mice per each genotype). Two-way ANOVA followed by Sidak’s post hoc correction: Genotype, F (1, 4) = 6.848, p = 0.0590; Projection, F (1, 4) = 315.0, ^^p < 0.0001; Interaction, F (1, 4) = 338.8, ^^p < 0.0001. Multiple comparisons: GPe, ^^p < 0.0001; SNr, ^****^p < 0.0001. e Intensity profile analysis of GFP signals along the solid lines in b. GFP signal intensity is higher in the dorsal GPe of Pitx3^ak/ak^ mice (brown) compared to the controls (blue). f Colocalization analysis of GFP and PV expression in the GPe of Pitx3^ak/ak^ mice (n = 3 mice). M1 = 0.97 ± 0.0007; M2 = 0.92 ± 0.04. M1: the proportion of PV signal overlapping with GFP. M2: the proportion of GFP signal overlapping with PV. g Representative coronal SNr sections from Nr4a1-eGFP mice on Pitx3^+/ak^ and Pitx3^ak/ak^ backgrounds, stained for TH (magenta) and DRD1 (red). DRD1 was used to outline the SNr. Arrows indicate dendron-bouquet structure in Pitx3^+/ak^ mice; arrowhead indicates reduced GFP signal in the ventral SNr. Solid lines indicate the regions used for intensity analysis in h. h Intensity profile analysis of GFP signals along the solid lines in the SNr from Pitx3^+/ak^ (top panel) and Pitx3^ak/ak^ (bottom panel) mice in g. Data are presented as mean ± SEM. N = 3 mice per group
Fig. 6. Altered distribution and projection patterns of patchy SPNs in the dorsal striatum of Pdyn^IRES−Cre^; Ai14 mice on a Pix3^ak/ak^ background. a Representative coronal sections from rostral to caudal levels of Pdyn ^IRES**−Cre^; Ai14 mice on Pitx3^+/ak^ and Pitx3^ak/ak^ backgrounds, stained for TH (green) and DAPI (blue). Scale bar, 1 mm. Abbreviations: dStr, dorsal striatum; GPe, globus pallidus externus. b Representative coronal SNr sections from Pdyn ^IRES−Cre^; Ai14 mice on Pitx3^+/ak^ and Pitx3^ak/ak^ backgrounds, stained for TH (magenta) and DAPI (blue). Arrows indicate dendron-bouquet structures in Pitx3^+/ak^ mice. Scale bar, 200 μm. c Quantification of integrated tdT signal density in the GPe and SNr of Pitx3^+/ak^ and Pitx3^ak/ak^ mice. Two-way ANOVA followed by Sidak’s post hoc correction: Genotype, F (1, 4) = 4.816, p = 0.0932; Projection, F (1, 4) = 280.9, ^^p < 0.0001; interaction, F (1, 4) = 5.445, p = 0.0799. Multiple comparisons: GPe, p = 0.9870; SNr, ^^p = 0.0256. d Percentage of tdT-expressing area within the GPe and SNr in Pitx3^+/ak^ and Pitx3^ak/ak^ mice. Two-way ANOVA followed by Sidak’s post hoc correction: Genotype, F (1, 4) = 29.24, ^^p = 0.0057; Projection, F (1, 4) = 880.1, ^^p < 0.0001; interaction, F (1, 4) = 29.22, ^^p = 0.0057. Multiple comparisons: GPe, p > 0.9999; SNr, ^*^p = 0.0001. Data are presented as mean ± SEM. N = 3 mice per genotype
Taken together, these complementary datasets suggest that PITX3 deficiency disrupts the balance of patchy SPN output pathways by reducing SNr projections due to a loss of patchy dSPNs and increasing GPe projections through an expansion of patchy iSPNs.
Optogenetic stimulation of patchy SPNs reveals reversed motor effects in Pitx3ak/ak mice
Recent studies have shown that patchy dSPNs suppress locomotion via inhibition of ALDH1A1^+^ DANs [33, 34], whereas patchy indirect pathway SPNs (iSPNs) exert a weaker locomotion-promoting effect [33, 47]. Under normal conditions, the net outcome of patchy SPN activation is locomotion inhibition [33]. To examine the functional consequences of patchy SPN reorganization in Pitx3^ak/ak^ mice, we performed optogenetic stimulation to activate either both patchy dSPNs and iSPNs or dSPNs alone (Fig. 7a and b). In control mice, stimulation of both patchy SPN subtypes significantly reduced locomotor velocity (Fig. 7c and d), consistent with the dominant inhibitory role of patchy dSPNs [33]. In contrast, the same stimulation paradigm in Pitx3^ak/ak^ mice resulted in a marked increase in locomotor speed (Fig. 7c and d), indicating a reversal of functional output. Notably, direct stimulation of patchy dSPN axon terminals in SN alone failed to suppress locomotion in Pitx3^ak/ak^ mice, whereas it reliably reduced movement in controls (Fig. 7e and f). These findings suggest that the loss of ALDH1A1⁺ SNc DANs in Pitx3^ak/ak^ mice abolishes the suppressive function of patchy dSPNs and instead enhances the locomotion-promoting influence of patchy iSPNs, leading to a paradoxical locomotor enhancement upon patchy SPN activation. This functional reversal likely contributes to the hyperactivity phenotype observed in Pitx3^ak/ak^ mice.
Fig. 7. Optogenetic activation of Kremen1^+^ SPNs in the dorsal striatum promote locomotion in Pitx3^ak/ak^ mice. a Schematic illustrating AAV-FLEX-ChR2 vector injection and optical fiber implantation for selective activation of Kremen1^+^ SPNs in the dorsal striatum or the SN in Pitx3^+/ak^ and Pitx3^ak/ak^ mice. b Representative coronal images showing ChR2 (green), TH (magenta) and DAPI (blue) expression in the dStr. Fiber implant locations in the dStr are marked. Scale bars: 1 mm. c Instantaneous velocity aligned to optogenetics stimulations (10s, blue shaded area) of Kremen1^+^ SPNs in the dorsal striatum. d Average velocity during pre-stimulation (Pre), stimulation (Stim, blue shaded area), and post-stimulation (Post) in Pitx3^+/ak^ mice (left) and Pitx3^ak/ak^ mice (right) from panel c. For Pitx3^+/ak^ mice: Pre = 5.14 ± 0.21 cm/s, Stim = 2.96 ± 0.31 cm/s, Post = 4.86 ± 0.29 cm/s, n = 7 mice; one-way ANOVA with multiple comparisons, Pre vs. Stim, ^^p = 0.0009, Stim vs. Post, ^^p = 0.0038. For Pitx3^ak/ak^ mice: Pre = 5.54 ± 0.47 cm/s, Stim = 6.29 ± 0.46 cm/s, Post = 5.33 ± 0.53 cm/s, n = 7 mice; one-way ANOVA with multiple comparisons, Pre vs. Stim, ^^p = 0.0169, Stim vs. Post, ^*^p = 0.0365. Error bars represent mean ± SEM. e Instantaneous velocity aligned to optogenetics stimulations (10s, blue shaded area) of Kremen1^+^ dSPN axon terminals in the SN. f Average velocity during pre-stimulation (Pre), stimulation (Stim, blue shaded area), and post-stimulation (Post) in Pitx3^+/ak^ mice (left) and Pitx3^ak/ak^ mice (right) from panel e. For Pitx3^+/ak^ mice: Pre = 4.04 ± 0.64 cm/s, Stim = 2.09 ± 0.20 cm/s, Post = 4.12 ± 0.51 cm/s, n = 7 mice; one-way ANOVA with multiple comparisons, Pre vs. Stim, ^^p = 0.0065, Stim vs. Post, ^^p = 0.0017. For Pitx3^ak/ak^ mice: Pre = 3.69 ± 0.80 cm/s, Stim = 3.51 ± 0.80 cm/s, Post = 3.92 ± 0.67 cm/s, n = 7 mice; one-way ANOVA with multiple comparisons, Pre vs. Stim, p = 0.70, Stim vs. Post, p = 0.44. Error bars represent mean ± SEM
Discussion
By integrating molecular mapping, anatomical tracing, and optogenetic manipulation, we reveal a previously unrecognized form of developmental circuit plasticity in the dorsal striatum of Pitx3^ak/ak^ mice triggered by the selective loss of ALDH1A1⁺ SNc DANs, a subpopulation preferentially vulnerable in PD [8, 13]. Our findings demonstrate a selective reorganization of patchy SPNs, marked by a pronounced reduction in the ratio of patchy dSPNs to patchy iSPNs and a reversal of their net influence on motor output. These results suggest that early dopaminergic depletion drives enduring structural and functional adaptations in basal ganglia circuits, which may contribute to altered motor behaviors.
Pitx3^ak/ak^ mice exhibit a profound loss of ALDH1A1⁺ SNc DANs during development [18, 48]; paradoxically, however, they display hyperlocomotion [19, 49], in stark contrast to the bradykinesia observed following ablation or inhibition ALDH1A1⁺ SNc DAN in adult animals [12, 50]. This discrepancy suggests that developmental dopamine loss may engage compensatory mechanisms within the striatum. While prior studies have primarily focused on morphological and electrophysiological alterations in SPNs [49, 51–53], the specific reorganization of patchy SPNs has not been well characterized. Given that patchy dSPNs form reciprocal connections with ALDH1A1⁺ SNc DANs, the developmental loss of this DAN subtype likely leads to a reduction in patchy dSPNs due to diminished trophic support. Consistent with this notion, we observed a marked decrease in the number of patchy dSPNs in the dorsal striatum and a corresponding loss of their projections to the SNr. Unexpectedly, we also detected a selective increase in patchy iSPNs, resulting in a reversal of the patchy dSPN: iSPN ratio from greater than 1 in controls to less than 1 in Pitx3^ak/ak^ mutants. This shift likely reflects dopamine-dependent regulation of SPN subtype differentiation, survival, or connectivity during early striatal circuit assembly [51, 54, 55]. The molecular mechanisms underlying the altered SPN composition remain to be elucidated. Whether these changes arise from fate specification or differential survival is unclear. Single-cell transcriptomic profiling of SPNs in Pitx3^ak/ak^ mice may help define subtype-specific gene expression changes in response to developmental dopamine loss.
Anatomical tracing in multiple reporter lines confirmed that the shift in patchy SPN subtype ratio is accompanied by altered projection patterns. In Kremen1^2A − Cre^; Ai14 mice, Pitx3^ak/ak^ mutants exhibited enhanced projections from patchy SPNs to the GPe and reduced projections to the SNr. These findings were replicated in the Nr4a1-eGFP reporter line, supporting the conclusion that the patchy iSPN population is selectively expanded and disproportionately contributes to GPe innervation. Further analyses using Pdyn^IRES−Cre^; Ai14 and Nr4a1-eGFP; Drd1-tdT mice confirmed that patchy dSPNs selectively lost their projections to SNr, with no significant collateralization to GPe. These projection alterations support a model (Fig. 8), in which early developmental dopamine loss leads to a reorganization of SPN connectivity that favors indirect pathway output from patch compartments.
Fig. 8. Model of patchy SPN reorganization in Pitx3^ak/ak^ mice. This schematic illustrates a selective reorganization of patchy SPNs in Pitx3^ak/ak^ mice, characterized by a marked reduction in the ratio of patchy dSPNs to patchy iSPNs, and a reversal of their net effect on motor output due to early dopaminergic depletion. The loss of SNc-projecting patchy dSPNs may abolish their locomotor-suppressing effect, whereas the increased projections of patchy iSPNs to the GPe may enhance inhibition of Arky neurons, thereby weakening their inhibitory feedback to striatal SPNs, including matrix dSPNs. This resulting disinhibition of matrix dSPNs likely contribute to the hyperlocomotion observed in Pitx3^ak/ak^ mice, particularly under conditions of heightened patchy iSPN activity. dStr: dorsal striatum, SNc: Substantia nigra pars compacta, SNr: Substantia nigra pars reticulata, GPe: Globus pallidus externa, SPN: Striatal projection neuron, dSPN: Direct-pathway striatal projection neuron, iSPN: Indirect-pathway striatal projection neuron, P-dSPN: patch dSPN, P-iSPN: patch iSPN, M-dSPN: matrix dSPN, M-iSPN: matrix iSPN, Arky: arkypallidal neuron
Optogenetic stimulation provided strong functional validation of the anatomical findings in Pitx3^ak/ak^ mice. In control mice, activation of patchy SPNs, especially dSPNs, suppressed locomotor activity, consistent with their net inhibitory role on ALDH1A1⁺ DANs and downstream motor circuits [33, 34, 47]. However, in Pitx3^ak/ak^ mice, the same stimulation paradigm increased locomotor speed, suggesting a functional reversal of patchy SPN output. Moreover, selective activation of patchy dSPNs alone failed to suppress movement in Pitx3^ak/ak^ mice, reinforcing the idea that these cells are either functionally silenced, reduced in number, or have lost effective downstream connectivity. Meanwhile, the enhanced locomotion observed during activation of patchy iSPNs aligns with their increased proportion and GPe innervation. Together, these findings indicate that the hyperactivity observed in Pitx3^ak/ak^ mice likely stems from an imbalance in patchy SPN circuitry, skewed toward indirect pathway dominance.
Most prior studies have attributed the locomotor effects of patchy SPNs to their modulation of DAN activity, particularly ALDH1A1^+^ SNc DANs [33, 34, 47]. In the absence of these DANs, as in Pitx3^ak/ak^ mice, how might reorganized patchy SPNs regulate locomotion? An early study using an independent reporter line demonstrated that patchy iSPNs preferentially target a central subregion of the GPe [47], which corresponds to a distinct subpopulation of GPe neurons associated with arkypallidal (Arky) cells, commonly marked by Npas1 or FoxP2 [56–58]. Unlike prototypical GPe neurons that engage the indirect pathway via the subthalamus nuclei, Arky neurons project back to the striatum, where they provide potent inhibition to SPNs [59–61]. The observed increase in patchy iSPN projections to the GPe in Pitx3^ak/ak^ mice may result in enhanced inhibition of Arky neurons, thereby reducing their inhibitory feedback to striatal SPNs, including matrix dSPNs (Fig. 8). This disinhibition of matrix dSPNs may contribute to the hyperlocomotion observed in Pitx3^ak/ak^ mice, particularly under conditions of increased patchy iSPN activity. Future studies employing electrophysiological recordings and circuit-mapping approaches will be essential to delineate how patchy iSPNs modulate Arky neuron activity in the GPe of Pitx3^ak/ak^ mice.
Our findings that Pitx3^ak/ak^ mice spent less time in the central region compared to the periphery suggest that the patch iSPN–arkypallidal GPe–striatal circuit may contribute not only to motor control but also to the regulation of non-motor functions such as anxiety. Patch iSPNs are thought to convey aversive or punishment signals that can influence affective state independent of motor suppression [62]. Through inhibitory projections to the GPe, these neurons may modulate Arky neurons, which send powerful GABAergic feedback to the striatum [63]. Enhanced arkypallidal output could globally dampen striatal activity and suppress ensembles associated with anxious or avoidant states. In parallel, patch dSPNs to dopaminergic dendrites in SNc can reduce dopaminergic tone [33, 34, 47, 64], further biasing behavior toward negative valence. Stress-related inputs, including corticotropin-releasing factor projections from hypothalamic and extended amygdala regions, also target GPe neurons [65], providing a potential mechanism by which external stressors recruit this loop. Consistent with this model, Hawes and Cai et al. recently demonstrated that patchy SPNs (Sepw1-Cre line) modulate locomotor vigor in a context-dependent manner, with ablation increasing movement speed in safe (dark) zones and activation suppressing speed, particularly under anxiogenic conditions [66]. Although most of these patchy SPNs belonged to the direct pathway, their activation reduced locomotor vigor, supporting the idea that patchy dSPN activity can impose low-vigor, avoidant behavioral states. This valence-sensitive modulation aligns with our proposed model in which patchy iSPNs engage arkypallidal feedback and dopaminergic suppression to regulate striatal excitability and reinforce negative affect. Together, these findings suggest that limbic–pallidal–striatal circuitry plays a critical role in integrating emotional context with action selection, and its dysregulation may underlie the affective and motivational disturbances characteristic of neurodegenerative diseases such as PD and Huntington’s disease.
Although PD is defined by progressive dopaminergic degeneration, compensatory remodeling of downstream circuits may occur, particularly in early or preclinical stages. The observed increase in patchy iSPN activity may reflect an adaptive mechanism aimed at sustaining motor output in the context of dopamine loss. Despite these important insights, several limitations should be noted. First, the loss of ALDH1A1⁺ SNc DAN in Pitx3^ak/ak^ mice occurs during early postnatal development. Thus, the circuit adaptations observed in this model likely reflect developmental plasticity, which may differ fundamentally from the compensatory changes that emerge in adult-onset models or in human PD. Our findings therefore are not intended to model PD per se, but rather to reveal how early dopamine deficiency shapes striatal circuit assembly. Nevertheless, the altered patch–matrix organization observed here may predispose the striatum to maladaptive dynamics also seen in adult-onset DA loss models. Whether similar circuit remodeling occurs in progressive PD models or in patients remains to be determined.
Second, although Pitx3^ak/ak^ mice display hyperactivity in open-field tests, they exhibit deficits in motor skill learning [53, 67], suggesting that compensatory changes in the striatum are insufficient to fully restore complex motor functions. Previous work has linked hyperactivity in developmental dopamine-deficient models to basal ganglia oscillatory dysfunction and altered circadian rhythmicity [68, 69]. While our study focused on the structural and functional remodeling of patchy SPNs, we recognize that these broader network mechanisms may also influence locomotor behavior, particularly given that the hyperlocomotion observed in Pitx3^ak/ak^ mice occurs predominantly during the light phase but not the dark phase [19].
Third, our analysis was limited to anatomical projections, optogenetics manipulation and behavioral output. Beyond dopamine, developmental loss of GABA co-release from ALDH1A1^+^ DANs might also contribute to the altered striatal circuitry. However, although ALDH1A1 participates in GABA synthesis in ALDH1A1⁺ DANs [70], genetic deletion of Aldh1a1 in these neurons does not affect locomotor behavior [70, 71]. Additionally, as the primary synthase of retinoic acid (RA), loss of Aldh1a1 in DANs has been shown to disrupt RA–mediated trans-synaptic induction of µ-opioid receptor expression in patch SPNs, potentially influence reward-related behaviors [70, 71]. Future studies incorporating electrophysiological and neurochemical approaches will be critical to elucidate the functional consequences of these circuit alterations in the dorsal striatum and GPe.
Conclusion
We identify a novel form of striatal circuit remodeling following the developmental loss of ALDH1A1⁺ SNc DANs in mice. This reorganization selectively alters the balance of patchy SPNs, resulting in a shift toward indirect pathway dominance and functional reversal in their motor output. These findings provide mechanistic insight into how early dopamine depletion can reshape basal ganglia circuitry and highlight patchy iSPNs as potential targets for therapeutic intervention in PD.
Supplementary Information
Below is the link to the electronic supplementary material.
Supplementary Material 1
The reference list from the paper itself. Each links out to its DOI / PubMed record.
- 1Carmichael K, Sullivan B, Lopez E, Sun L, Cai H. Diverse midbrain dopaminergic neuron subtypes and implications for complex clinical symptoms of Parkinson’s disease. Ageing Neurodegener Dis 2021;1.10.20517/and.2021.07PMC 844262634532720 · doi ↗ · pubmed ↗
- 2Okunomiya T, Watanabe D, Banno H, Kondo T, Imamura K, Takahashi R, Inoue H. Striosome circuitry stimulation inhibits striatal dopamine release and locomotion. J Neurosci 2025;45.10.1523/JNEUROSCI.0457-24.2024 PMC 1175662839622644 · doi ↗ · pubmed ↗
- 3Davis MI, Puhl HL. 3rd: Nr 4a 1-e GFP is a marker of striosome-matrix architecture, development and activity in the extended striatum. P Lo S ONE. 2011;6:e 16619.10.1371/journal.pone.0016619 PMC 303060421305052 · doi ↗ · pubmed ↗
- 4Lazaridis I, Crittenden JR, Ahn G, Hirokane K, Yoshida T, Mahar A, Skara V, Meletis K, Parvataneni K, Ting JT, et al. Striosomes target nigral dopamine-containing neurons via direct-D 1 and indirect-D 2 pathways paralleling classic direct-indirect basal ganglia systems. bio Rxiv. 2024.
- 5Habib A, Riccobono G, Tian L, Basu D, Sun L, Chang L, Martinez Smith VM, Wang L, Le W, Cai H. Subtype-specific roles of nigrostriatal dopaminergic neurons in motor and associative learning. bio Rxiv. 2025.10.20517/and.2025.26PMC 1280114741541494 · doi ↗ · pubmed ↗
- 6Hawes S, Liang B, Oldham B, Sullivan BT, Wang L, Song B, Chang L, Lin DT, Cai H. Patchy striatonigral neurons modulate locomotor vigor in response to environmental valence. Elife. 2025;14.10.7554/e Life.106403 PMC 1248818741032042 · doi ↗ · pubmed ↗