A PRISMA-based systematic review on advances in identity recognition and authentication using human biometric signals (2018–2023)
Bahadır Çokçetin, Muhammed Kürşad Uçar

TL;DR
This review analyzes how well biometric signals like ECG, EEG, and PPG can be used for identity authentication, finding that ECG and multimodal systems with deep learning perform best.
Contribution
The paper provides a systematic review of biometric authentication performance from 2018–2023, highlighting the superiority of ECG and multimodal deep learning approaches.
Findings
ECG-based authentication systems achieved an average accuracy of 98.6%, the highest among biometric modalities.
Multimodal biometric systems showed accuracy exceeding 99%, outperforming unimodal systems in reliability and robustness.
Deep learning methods outperformed traditional machine learning, with accuracy rates up to 99.8% on specific datasets.
Abstract
This systematic review examines the effectiveness of physiological biometric signals in authentication and recognition systems by analyzing studies published between 2018 and 2023. Specifically, different biometric modalities (e.g., ECG, EEG, and PPG), commonly used datasets, signal processing techniques, and classification approaches are evaluated to assess their reported reliability and performance. In addition, the performance of multimodal biometric systems is compared with that of unimodal approaches. The review was conducted in accordance with the PRISMA 2020 guidelines. Relevant studies published between 2018 and 2023 were systematically retrieved from major databases, including EBSCO, PubMed, IEEE Xplore, Scopus, and Web of Science. A total of 2,064 records were initially identified, and after duplicate removal and eligibility screening, 80 articles were included in the final…
Genes, proteins, chemicals, diseases, species, mutations and cell lines named across the full text — each resolved to its canonical identifier and authoritative record.
Click any figure to enlarge with its caption.
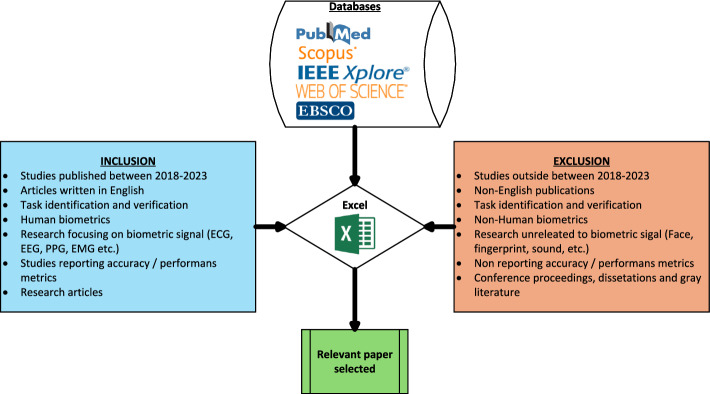 Figure 1
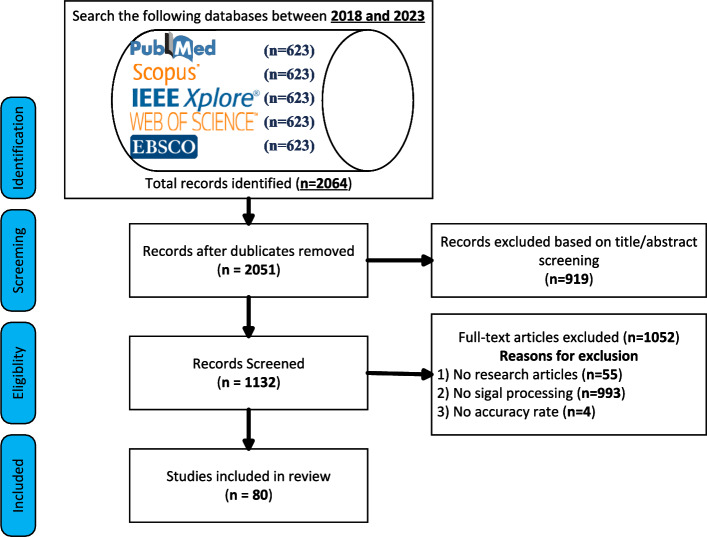 Figure 2
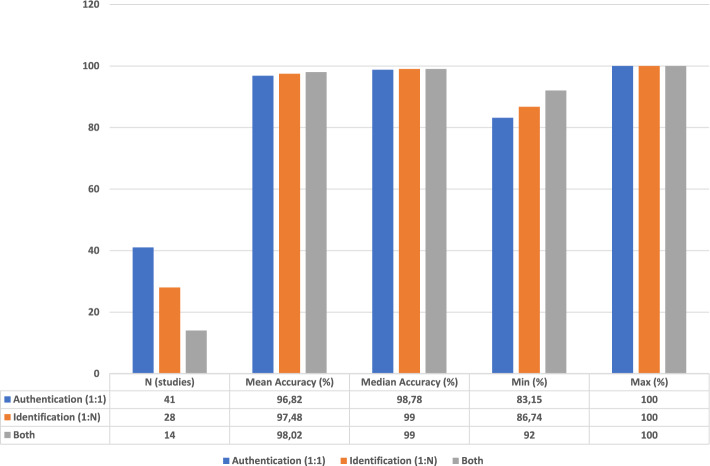 Figure 3
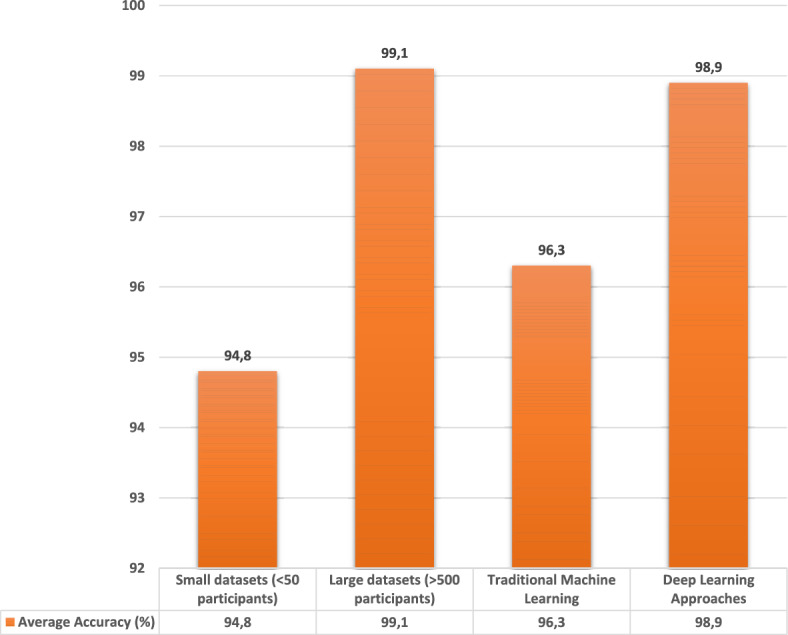 Figure 4
- —TUSEB-2023-A4-04
Peer Reviews
No public reviews on file for this paper yet. If you reviewed it on a platform where reviews are public (OpenReview, ICLR, NeurIPS, ICML), you can paste yours below so the community can read it here.
Videos
No videos yet. Explain this paper in a talk, walkthrough, or lecture? Add one.
Taxonomy
TopicsECG Monitoring and Analysis · EEG and Brain-Computer Interfaces · Non-Invasive Vital Sign Monitoring
Introduction
Conventional authentication mechanisms such as passwords, PIN codes, and smart cards suffer from well-known shortcomings: they can be forgotten, guessed, disclosed, or intercepted by adversaries [1]. In contrast, biometric authentication relies on unique physiological and behavioral characteristics that are inherently bound to the individual, thereby reducing the attack surface and improving usability [2, 3]. Within this landscape, physiological signals have attracted growing interest because they inherently contain liveness cues and are more resistant to large-scale spoofing. Biometric authentication has thus shifted from niche applications to broader deployment across consumer, clinical, and industrial settings [4, 5].
Among physiological traits, electrocardiogram (ECG), electroencephalogram (EEG), and photoplethysmogram (PPG)—including its contactless variant rPPG—have emerged as key modalities for personal recognition and identity verification. Their appeal lies in their distinctiveness, temporal stability, and increasing availability through wearable and imaging sensors. [6, 7]. Biosignal authentication is now applied across multiple domains—healthcare (continuous patient monitoring, access control), mobile and IoT devices (smartwatch- or camera-based authentication), and automotive systems (driver identification)—demonstrating their practicality beyond controlled laboratory environments [8–10]. Despite this progress, significant challenges remain in achieving robustness, scalability, and cross-modality standardization.
Prior reviews have typically focused on single modalities, leaving cross-modality comparisons and unified evaluation frameworks largely underexplored [5, 11]. Methodological heterogeneity, lack of standardized metrics (AUC, EER), and small-sample evaluations limit direct comparability and reduce generalizability [7, 12]. Technical challenges—such as noise sensitivity in EEG, motion artifacts in PPG/rPPG, and inter-session variability in ECG—remain key barriers to deployment [13, 14]. Deep learning models (CNN, RNN, Transformer) outperform handcrafted approaches but require large, diverse datasets and robust domain adaptation strategies to maintain long-term stability [15, 16].
An emerging trend is multimodal fusion, in which complementary signals (e.g., ECG with PPG or EEG with face) achieve superior accuracy (99.3–99.8%) [15]. Parallel advances in federated and privacy-preserving learning enable decentralized model training without requiring raw data sharing, aligning biometric research with regulations such as GDPR [17–19]. Beyond technical aspects, user acceptance, ethical considerations, and transparent dataset governance are essential for ensuring trust and broad adoption [20, 21].
Contributions: This study presents a PRISMA-guided systematic review of biometric authentication based on physiological signals (2018–2023). We (i) synthesize evidence across ECG, EEG, PPG/rPPG, EMG/sEMG, face, and fingerprint to enable cross-modality comparison; (ii) quantify performance through subgroup analyses by dataset size and methodological approach; (iii) distinguish verification (1:1) and identification (1:N) tasks and emphasize the need for standardized reporting (e.g., AUC, EER); and (iv) examine security-oriented designs including encryption and privacy-preserving strategies.
Research questions:
- Which physiological signals (e.g., ECG, EEG, PPG/rPPG) achieve the most reliable performance in biometric verification and identification, and under what conditions?
- How do preprocessing pipelines and classification paradigms (traditional ML vs. deep learning) influence accuracy and robustness?
- What benefits do multimodal fusion and privacy-preserving solutions provide relative to unimodal baselines?
- What methodological gaps (e.g., cross-session variability, dataset scale, or metric standardization) remain, and how can future studies effectively address them? Article organization: Section "Materials and Methods" details the search strategy and quality assessment. Section "Results" reports modality-wise findings; Section "Discussion" interprets the findings in the context of existing literature, and Section "Conclusion and Recommendations" concludes with recommendations for future work.
Materials and methods
Literature search strategy
This systematic review conducted a comprehensive literature search on biometric-based identity recognition and authentication. The search, completed in December 2023, covered studies published between 2018 and 2023 in major databases such as EBSCO, PubMed, IEEE Xplore, Scopus, and Web of Science.
The keywords ‘biometric authentication’, ‘biometric recognition’, and ‘biometric identification’ were combined using Boolean operators (AND, OR) to maximize retrieval sensitivity. Additionally, reference lists of relevant studies were screened to identify further eligible works.
A total of 2,064 records were identified across the five databases and additional sources. After removing 13 duplicates, 2,051 records remained for screening. Of these, 919 were excluded as unrelated to human biometric data, and 1,132 proceeded to full-text review. Fifty-five review papers and four studies lacking accuracy metrics were subsequently excluded, leaving 80 eligible articles focused on biometric signal processing. Ultimately, 80 articles met the inclusion criteria, involving biometric signal processing techniques applied to human biometric data. These articles constituted the final dataset for systematic evaluation.
The complete search strategies for each database are provided in the Supplementary Materials (Table 14). For example, in PubMed, the following search string was used: (‘biometric authentication’ OR ‘biometric recognition’ OR ‘biometric identification’) AND (‘ECG’ OR ‘EEG’ OR ‘PPG’), limited to English-language publications from 2018 to 2023.
Inclusion and exclusion criteria
To ensure methodological consistency and reliability, only peer-reviewed journal articles were included, whereas conference proceedings, dissertations, and gray literature were excluded. Studies were included if they were published between 2018 and 2023, written in English, and focused on biometric signals (e.g., ECG, EEG, or PPG) used for authentication or recognition. Additionally, included studies were required to report accuracy or other relevant performance metrics. Conversely, studies were excluded if they were published outside the 2018-2023 timeframe, written in languages other than English, or unrelated to biometric signal authentication. In addition, conference papers, dissertations, and other forms of gray literature were systematically excluded. Figure 1 provides a concise summary of the inclusion and exclusion criteria.Fig. 1. Study selection process according to the PRISMA 2020 guidelines
Data collection process
After completing the literature search, all articles meeting the inclusion criteria were reviewed in full. In the first phase, titles and abstracts were screened, and eligible studies were selected for full-text review.
In the second phase, full-text screening identified studies on identity recognition and authentication using human biometric signals that met the criteria. Data extracted included publication year, biometric signal type, classification methods, dataset size, and reported accuracy rates. All extracted data were tabulated in Microsoft Excel.
Datasets used in the reviewed studies were tabulated, showing the dataset type and corresponding article title (Table 4). Additionally, Table 3 presents the signal types, datasets used, and corresponding article titles.
Data items and categories
The collected data were categorized into groups according to biometric signal type, classification method, datasets, and performance metrics. Specifically, the categories included biometric signal (ECG, PPG, EMG), classification methods (SVM, LDA, KNN), datasets employed, and reported accuracy rates. Additional data items included the journal of publication and the number of participants in each dataset. These categories provided the basis for subsequent subgroup analyses.
Study selection using process PRISMA flow diagram
The PRISMA flow diagram illustrates the number of studies initially identified, those excluded after title and abstract screening, and those included for full-text review. The diagram also indicates the final number of included studies and the reasons for exclusion (Figure 2).Fig. 2PRISMA flow diagram
Meta-analysis
A formal meta-analysis was not conducted in this review due to substantial heterogeneity among the included studies. Variations in dataset characteristics, preprocessing, feature extraction, and classification pipelines prevented direct statistical pooling. In addition, the lack of standardized accuracy metrics across studies further limits the feasibility of quantitative aggregation.
To provide a valid quantitative overview without introducing bias, we instead conducted subgroup analyses (e.g., by dataset size and methodological approach). These analyses highlight consistent performance trends and serve as a rigorous alternative to a meta-analysis under heterogeneous conditions.
Future research could may enable valid meta-analyses, particularly for ECG and EEG, if standardized benchmark datasets, evaluation metrics such as AUC and EER, and harmonized study designs are adopted. Establishing common performance indicators would make comprehensive meta-analyses feasible in subsequent systematic reviews.
Nevertheless, to provide an indicative quantitative perspective, a summary of reported accuracies across the included studies was calculated. Across 80 studies, the mean reported accuracy was 97.9% (SD = 2.6%), with a median of 99.0% and an interquartile range of 96.3–99.8%. When grouped by modality, ECG-based systems achieved a pooled mean of 98.6%, EEG-based systems 96.8%, and PPG-based systems 98.4%. Although formal confidence intervals were not computed owing to heterogeneous metrics, these descriptive aggregates provide a concise meta-analytic overview of central performance trends (Table 1). Table 1. Descriptive summary of reported accuracy rates across modalities (2018–2023)ModalityMean accuracy (%)Median (%)Range (%)ECG98.699.291.3–100.0EEG96.898.583.2–100.0PPG/rPPG98.499.595.6–99.9EMG/sEMG94.696.093.1–96.0Multimodal99.599.798.0–100.0Overall (all studies)97.999.0****83.1–100.0Values represent descriptive averages across 80 included studies. Formal meta-analysis was not conducted due to methodological heterogeneity
Quality assessment
The methodological quality of the included studies was assessed using the Joanna Briggs Institute (JBI) Critical Appraisal Checklist for Analytical Cross-Sectional Studies. Eight items were evaluated (e.g., clarity of inclusion criteria, validity of measurement methods, completeness of outcome reporting), each scored 0 or 1. Total scores ranged from 0–8, with ≥6 indicating high quality and <6 lower quality. Two reviewers independently performed the assessment, and discrepancies were resolved through discussion. A summary of representative high-performing studies is provided for illustration, while the complete quality appraisal results of all 80 studies are reported in the two-part JBI Quality Assessment tables (Tables 15 and 16).
Results
Characteristics of included studies
Yearly distribution of publications and source journals
A total of 80 articles published between 2018 and 2023 were included, representing a broad range of journals and publishers. Major publishers included MDPI, Springer, Hindawi, IEEE, and Wiley (Table 2).
MDPI contributed the largest number of studies, with 37 articles from the journal Sensors alone, underscoring MDPI’s strong contribution to biometric-signal research. Springer also holds a prominent position, publishing key studies in Neural Computing and Applications, Circuits, Systems and Signal Processing, and Soft Computing.
Publication output peaked in 2022 (20 articles), reflecting the rapid growth of research interest in biometric signals. The following year, 2021, also showed strong productivity (17 articles).
In addition to MDPI and Springer, IEEE journals contributed significantly, particularly in technology-focused applications of biometric signals. Publishers such as Wiley and Taylor & Francis have also published high-quality research on biometric signals for authentication and recognition. A single article published in TÜBİTAK Academic Journals represents a regional academic contribution.
Overall, these findings highlight the strong international interest in biometric signal research and the broad support provided by publishers. Table 2. Publishing houses, journals, and years with referencesYearPublisherJournalNumber of articlesReferences2018SpringerCircuits, Systems, and Signal Processing1[22]2018HindawiComputational Intelligence and Neuroscience1[23]2018MDPISensors6[24–29]2018PLOSPLOS ONE1[30]2018IEEEIEEE Transactions on Pattern Analysis and Machine Intelligence (TPAMI)1[32]2019HindawiComputational Intelligence and Neuroscience1[33]2019MDPISensors4[34–37]2019SpringerJournal of Medical Systems1[38]2019TÜBİTAKTurkish Journal of Electrical Engineering & Computer Sciences1[39]2020HindawiJournal of Electrical and Computer Engineering (JECE)1[40]2020IEEEIEEE Transactions on Computer-Aided Design of Integrated Circuits and Systems (TCAD)1[41]2020MDPISensors5[42–46]2020NatureScientific Reports1[47]2020SpringerThe Journal of Supercomputing1[48]2020SpringerNeural Computing and Applications1[49]2020World ScientificJournal of Mechanics in Medicine and Biology1[50]2020SpringerMultimedia Systems1[51]2021HindawiComputational and Mathematical Methods in Medicine1[52]2021HindawiScientific Programming1[53]2021IEEEIEEE Transactions on Consumer Electronics1[54]2021IEEEIEEE Transactions on Instrumentation and Measurement2[55, 56]2021MDPIEntropy1[57]2021MDPISensors6[58–64]2021NatureScientific Reports1[65]2021Taylor & FrancisApplied Artificial Intelligence1[66]2021WileySecurity and Privacy1[67]2021WileyInternational Journal of Communication Systems1[68]2022HindawiComputational Intelligence and Neuroscience1[69]2022HindawiScientific Programming1[70]2022IAENGEngineering Letters1[71]2022IOS PressJournal of Intelligent & Fuzzy Systems1[72]2022MDPIMathematics1[73]2022MDPISensors7[13, 31, 74–79]2022MDPIDiagnostics1[80]2022SpringerCybernetics and Systems Analysis1[81]2022SpringerMultimedia Systems1[51]2022Taylor & FrancisIETE Journal of Research1[82]2022Taylor & FrancisJournal of Discrete Mathematical Sciences and Cryptography1[83]2022WileySecurity and Privacy1[84]2022PubMed (index)Sensors (Basel)1[85]2023MDPIBehavioral Sciences1[86]2023MDPIDiagnostics1[80]2023MDPIInformation1[87]2023MDPISci1[15]2023MDPISensors7[88–94]2023SpringerNeural Computing and Applications1[95]2023SpringerSoft Computing1[10]2023Taylor & FrancisComputer Methods in Biomechanics and Biomedical Engineering1[96]2023Taylor & FrancisIETE Journal of Research1[97]Publishers and journal titles are presented as reported in the included studies; minor style harmonizations applied for consistency (e.g., capitalization, diacritics)
Biometric datasets and sample sizes
This section examines studies using different biometric signal datasets. Table 4 summarizes the signal types, datasets, participant numbers, and reported accuracy rates. This analysis explores how dataset characteristics influence the accuracy of different biometric signals (Table 4).
ECG was the most frequently used signal type among the reviewed studies. Large datasets such as PTB-XL and PhysioNet CinC 2017 consistently yielded accuracy rates above 98%, confirming the robustness of ECG-based authentication. EEG-based studies exhibited variable accuracy across datasets (86–97.8%; e.g., EEGMMIDB). The inherent complexity of EEG signals likely contributes to this variation.
PPG datasets such as Real-World PPG and MIMIC-II achieved accuracy rates above 98 %, supporting their suitability for heart rate- and blood flow-based biometric systems. EMG-based systems, which rely on muscle-activity patterns, generally reported accuracy around 96%.
Face- and fingerprint-based studies reported accuracy rates of 94–98%, with FERET and VeinPolyU datasets achieving the highest performance. The table highlights which signal types and datasets provide better performance based on accuracy comparisons. Table 3. Articles and datasets used across modalitiesSignalsDatasetsSubjectsAccuracy (%)ReferencesSignalsDatasetsSubjectsAccuracy (%)ReferencesECGECG-ID9099.85[87]ECGMIT-BIH Multi-parameter18100.00[10]ECGMWM-HIT, ECG-ID9099.89[15]ECGPersonal Measurement15099.80[24]ECGPTBDB29095.30[82]ECGMIT-BIH Arrhythmia4795.46[39]ECGPersonal Measurement1899.87[84]ECGMLII, UCI Arrhythmia, PTBDB290100.00[65]ECGDREAMER2391.30[55]ECGPhysioNet QT2294.16[42]ECGPTB Diagnostic11599.00[88]ECGPhysioNet Computing in Cardiology 2018198592.00[43]ECGPersonal Measurement10095.40[58]ECGFANTASIA, MIT-BIH, CYBHi200100.00[44]ECGECG-ID9099.05[59]ECGMIT-BIH Arrhythmia4799.00[96]ECGPhysioNet ECG-ID2099.13[48]ECGMIT-BIH Normal Sinus Rhythm, MIT-BIH Arrhythmia5099.80[45]ECGPTBDB29099.69[80]ECGPersonal Measurement1187.61[60]ECGAPNEA-ECG, LTAFDB, MITDB, LTDB, VFDB, SLPDB, SVDB, INCARTDB, FANTASIA, PTB-XL50098.00[74]ECGEuropean ST-T7999.14[90]ECGPersonal Measurement1893.14[27]ECGECG-ID9094.00[71]ECGSchiller ECG Database46098.40[28]ECGECG-ID, MIT-BIH, NSR-DB15699.62[91]ECGPersonal Measurement17100.00[76]ECGPersonal Measurement5599.30[29]ECGCYBHi6398.42[77]ECGPTBDB, CUECG39098.10[36]ECGTW, VeinPolyU; MWM-HIT, ECG-ID9098.60[51]ECGPersonal Measurement2099.00[62]ECGSchiller ECG Database46097.50[30]ECGPersonal Measurement313399.60[81]ECGPersonal Measurement10098.00[46]ECGPTBDB, CYBHi29099.27[67]ECGFANTASIA, MIT-BIH Arrhythmia, ECG-ID, European ST-T, Aveiro ECG20098.00[56]ECGPhysioNet Computing in Cardiology Challenge 20175099.30[78]ECGMIT-BIH Arrhythmia4795.17[79]ECGPTBDB and ECG-ID29099.90[57]ECGPhysioNet ECG-ID, PhysioNet QT, PhysioNet NSRDB18398.31[37]ECGECG-ID, PTBDB, CEBSDB400100.00[41]EEGPersonal Measurement2098.50[54]EEGEEGMMIDB10983.21[33]EEGPersonal Measurement1697.17[66]EEGEEGMMIDB109100.00[95]EEGWAY_EEG_GAL1283.15[13]EEGPersonal Measurement4297.60[23]EEGEEGMMIDB10998.54[73]EEGEEGMMIDB10993.86[69]EEGEEGMMIDB10998.80[38]EEGPersonal Measurement3991.10[89]EEGBCI Competition 2008—Graz A996.00[83]EEGEEGMMIDB10999.98[22]EEGPersonal Measurement4594.27[26]EEGEEGMMIDB10999.00[98]EEGRSVP, Sternberg Task, BCI200013999.00[86]EEGEEGMMIDB10999.00[50]EEGMAHNOB-HCI3599.10[52]EEGPersonal Measurement5898.78[35]EEGBED2186.74[85]EEGPersonal Measurement2996.70[92]EEGPersonal Measurement2088.00[49]EEGEEGMMIDB109100.00[94]EEGEEGMMIDB10997.00[63]EEGEEGMMIDB10999.00[99]EEGEEGMMIDB10999.30[47]EEGPersonal Measurement2199.00[31]EMGPersonal Measurement896.00[97]PPGPersonal Measurement2395.65[34]PPGPRRB, MIMIC-II, Berry–Nonin20099.00[25]PPGReal-World PPG3599.50[68]PPGBIDMC, MIMIC, CapnoBase12799.75[70]PPGReal-World PPG3599.00[93]PPGBIDMC, MIMIC, CapnoBase12799.70[40]PPGBIDMC, MIMIC, CapnoBase12799.88[72]PPGBIDMC, MIMIC, CapnoBase12799.69[53]PPGReal-World PPG3597.00[64]rPPGPersonal Measurement1746699.74[75]sEMGPersonal Measurement493.10[61] datasets and accuracies are reported as stated by the original authors (best result per article when multiple results exist). “Personal Measurement” denotes subject-specific datasets collected by the study authors; subject counts refer to the corresponding article and may differ from full dataset sizes
Datasets and articles used
Table 4 summarizes the datasets employed in the reviewed studies, indicating the corresponding articles and citations.
A summary of the biometric datasets used in the reviewed studies, including the number of participants and reported accuracy rates, is provided in Table 3. The most frequently used datasets included EEGMMIDB (for EEG), PTB-XL and PhysioNet ECG-ID (for ECG), and BIDMC (for PPG). Dataset sizes varied substantially, from small-scale studies (e.g., 7 participants in RSVP) to large-scale studies (e.g., 17,466 participants in rPPG-based research).
Reported accuracy varied notably depending on dataset characteristics and preprocessing techniques. For instance, studies using ECG-ID report accuracy rates of 99.2–99.5%, while EEG-based studies exhibit a broader range (83.15%–100%). These findings highlight the impact of dataset size and preprocessing methods on biometric authentication performance. Further methodological details, including preprocessing and feature-extraction techniques, are summarized in Tables 5 and 6. Table 4. Datasets and articles usedSignalsDataset nameDataset short nameDataset citationSubjectsArticle usedECGAPNEA-ECGAPNEA-ECG[100]35[74]ECGAveiro ECGAveiroN/A10[56]ECGCardiology Challenge 2017Cardiology 2017[100]50[78]ECGCardiology Challenge 2018Cardiology 2018[100]1985[43]ECGCUECGCUECG[36]100[36]ECGCheck Your Biosignals HereCYBHi[101]63[44, 67, 77]ECGDREAMERDREAMER[102]23[55]ECGECG-IDECG-ID[100]90[15, 37, 41, 48, 51, 56, 57, 59, 71, 87, 91]ECGEuropean ST-TEuropean[100]79[56, 90]ECGFANTASIAFANTASIA[100]40[44, 56]ECGSt Petersburg ArrhythmiaINCARTDB[100]75[74]ECGLong Term AFLTAFDB[100]84[74]ECGMIT-BIH Long-Term ECGLTDB MIT-BIH[100]7[74]ECGMIT-BIHMIT-BIH[100]36[44, 91]ECGMIT-BIH Multi-parameterMIT-BIH-MP[100]18[10]ECGMIT-BIH ArrhythmiaMITDB[100]47[39, 45, 56, 79, 96]ECGMLIIMLII[100]47[65]ECGMWM-HIT ECGMWM-HIT[103]70[15, 51]ECGMIT-BIH Normal Sinus RhythmMIT-BIH NSR[100]18[37, 45]ECGNSR-DBNSR-DB[100]30[41, 91]ECGPhysioNet ECG-IDPhysio ECG-ID[100]20[37, 48]ECGPTB DiagnosticPTB[100]115[67]ECGPTBDBPTBDB[100]290[36, 41, 57, 65, 80, 82, 88]ECGPTB-XLPTB-XL[100]21837[74]ECGPhysioNet QTQT[100]22[37, 42]ECGSchiller ECGSchiller[30]460[28, 30]ECGMIT-BIH PolysomnographicSLPDB[100]16[74]ECGMIT-BIH Supra. ArrhythmiaSVDB[100]78[74]ECGUCI arrhythmiaUCI[104]206[65]ECGMIT-BIH Malignant VentricularVFDB[100]22[74]EEGBCI Competition 2008 - Graz ABCI Graz[105]9[83]EEGBCI2000BCI2000[100]109[86]EEGBiometric EEG DatasetBED[106]21[85]EEGEEGMMIDBEEGMMIDB[100]109[22, 33, 38, 47, 50, 63, 69, 73, 94, 95, 98, 99]EEGMAHNOB-HCIMAHNOB-HCI[107]35[52]EEGRSVPRSVP[108]7[86]EEGSternberg TaskSternberg[109]23[86]EEGWAY_EEG_GALWAY_EEG_GAL[110]12[13]Finger VeinVeinPolyU Finger VeinVeinPolyU[111]156[51]Finger VeinTWTWN/AN/A[51]PPGBIDMCBIDMC[100]53[40, 53, 70, 72]PPGCapnoBaseCapnoBase[112]42[40, 53, 70, 72]PPGMIMIC-IIMIMIC-II[100]50[25]PPGMIMICMIMIC[100]32[25, 40, 53, 70, 72]PPGPRRBPRRB[112]42[25]PPGReal-World PPGReal-World[113]35[64, 68, 93] “N/A” indicates information not specified by the original source. Dataset citations are given as reported in the included articles
Applications of biometric signals
Table 5 summarizes how biometric signals (ECG, PPG, EEG, EMG, sEMG, rPPG) are used in recognition and authentication, including applied methods, dataset sizes, average accuracy rates, and the use of multimodal or fusion structures.
EEG has been widely applied in recognition and authentication, achieving accuracy rates between 90% and 100%. Deep learning methods achieve the highest values (up to 99.98%). Although multimodal approaches were less common, they yielded notably higher accuracy when implemented.
ECG-based studies reported accuracy varying by method: \documentclass[12pt]{minimal} \usepackage{amsmath} \usepackage{wasysym} \usepackage{amsfonts} \usepackage{amssymb} \usepackage{amsbsy} \usepackage{mathrsfs} \usepackage{upgreek} \setlength{\oddsidemargin}{-69pt} \begin{document}$$\approx$$\end{document} 96.3% with machine learning and \documentclass[12pt]{minimal} \usepackage{amsmath} \usepackage{wasysym} \usepackage{amsfonts} \usepackage{amssymb} \usepackage{amsbsy} \usepackage{mathrsfs} \usepackage{upgreek} \setlength{\oddsidemargin}{-69pt} \begin{document}$$\approx$$\end{document} 99.2% with deep learning. Multimodal fusion, although less frequently applied, further improved accuracy.
PPG-based studies achieved 98.5–99.7% accuracy using deep-learning and statistical approaches. Incorporating multimodal or fusion structures further enhanced performance.
EMG, used for muscle movement-based authentication, achieved \documentclass[12pt]{minimal} \usepackage{amsmath} \usepackage{wasysym} \usepackage{amsfonts} \usepackage{amssymb} \usepackage{amsbsy} \usepackage{mathrsfs} \usepackage{upgreek} \setlength{\oddsidemargin}{-69pt} \begin{document}$$\sim$$\end{document} 96% accuracy with deep learning methods.
rPPG, measurable remotely, achieved 99.7% accuracy with large datasets, highlighting its potential for remote biometric recognition.
Although high accuracy was observed across signal types, performance still varied by method and dataset. Future work should report dataset size and preprocessing methods more consistently. Expanded analysis of multimodal and fusion approaches, as well as integration of multiple signals, could further improve system reliability.
Biometric signals have broad applications in authentication and security, where preprocessing methods play a critical role in improving accuracy. The next section discusses key preprocessing techniques and their impact on performance. Table 5. Summary of included studies by signal modalitySignalsTaskDatasetsSubjectsAccuracy (%)ReferencesSignalsTaskDatasetsSubjectsAccuracy (%)ReferencesECGBothFANTASIA, MIT-BIH, CYBHi200100.00[44]ECGBothAPNEA-ECG, LTAFDB, MITDB, LTDB, VFDB, SLPDB, SVDB, INCARTDB, FANTASIA, PTB-XL50098.00[74]ECGBothPersonal Measurement17100.00[76]ECGBothCYBHi6398.42[77]ECGBothCardiology 2018198592.00[43]ECGBothPersonal Measurement1893.14[27]ECGBothPersonal Measurement313399.60[81]ECGIdentificationMIT-BIH NSR, MITDB5099.80[45]ECGIdentificationECG-ID, MIT-BIH, NSR-DB15699.62[91]ECGIdentificationCardiology 20175099.30[78]ECGIdentificationPTBDB, ECG-ID29099.90[57]ECGIdentificationPersonal Measurement10095.40[58]ECGIdentificationPersonal Measurement10098.00[46]ECGIdentificationPTBDB29095.30[82]ECGIdentificationMLII, UCI arrhythmia, PTBDB290100.00[65]ECGIdentificationPhysioNet QT2294.16[42]ECGIdentificationMITDB4795.17[79]ECGIdentificationPersonal Measurement15099.80[24]ECGIdentificationEuropean ST-T7999.14[90]ECGIdentificationDREAMER2391.30[55]ECGIdentificationPhysioNet ECG-ID2099.13[48]ECGIdentificationSchiller ECG Database46098.40[28]ECGIdentificationPersonal Measurement2099.00[62]ECGIdentificationFANTASIA, MITDB, ECG-ID, European ST-T, Aveiro ECG20098.00[56]ECGVerificationECG-ID9099.85[87]ECGVerificationPTB Diagnostic11599.00[88]ECGVerificationPTBDB29099.69[80]ECGVerificationPTBDB, CUECG39098.10[36]ECGVerificationPTBDB, CYBHi29099.27[67]ECGVerificationMWM-HIT, ECG-ID9099.89[15]ECGVerificationMITDB4795.46[39]ECGVerificationTW, VeinPolyU, MWM-HIT, ECG-ID9098.60[51]ECGVerificationPersonal Measurement1899.87[84]ECGVerificationECG-ID1599.05[59]ECGVerificationMITDB4799.00[96]ECGVerificationPersonal Measurement1187.61[60]ECGVerificationECG-ID9094.00[71]ECGVerificationPhysioNet ECG-ID, PhysioNet QT, MIT-BIH NSR18398.31[37]ECGVerificationMIT-BIH Multi-parameter18100.00[10]ECGVerificationSchiller ECG Database46097.50[30]ECGVerificationPersonal Measurement5599.30[29]ECGVerificationECG-ID, PTBDB, CEBSDB400100.00[41]EEGBothEEGMMIDB10999.00[98]EEGBothPersonal Measurement2199.00[31]EEGBothEEGMMIDB109100.00[95]EEGBothEEGMMIDB10998.80[38]EEGBothEEGMMIDB10999.00[99]EEGIdentificationEEGMMIDB10998.54[73]EEGIdentificationBED2186.74[85]EEGIdentificationEEGMMIDB10997.00[63]EEGIdentificationEEGMMIDB10999.00[50]EEGIdentificationEEGMMIDB109100.00[94]EEGIdentificationEEGMMIDB10999.30[47]EEGVerificationPersonal Measurement1697.17[66]EEGVerificationRSVP, Sternberg Task, BCI200013999.00[86]EEGVerificationMAHNOB-HCI3599.10[52]EEGVerificationPersonal Measurement5898.78[35]EEGVerificationPersonal Measurement2098.50[54]EEGVerificationEEGMMIDB10983.21[33]EEGVerificationWAY_EEG_GAL1283.15[13]EEGVerificationPersonal Measurement3991.10[89]EEGVerificationPersonal Measurement2996.70[92]EEGVerificationPersonal Measurement2088.00[49]EEGVerificationPersonal Measurement4297.60[23]EEGVerificationEEGMMIDB10993.86[69]EEGVerificationBCI Graz996.00[83]EEGVerificationPersonal Measurement4594.27[26]EEGVerificationEEGMMIDB10999.98[22]EMGVerificationPersonal Measurement896.00[97]PPGBothPersonal Measurement2395.65[34]PPGBothBIDMC, MIMIC, CapnoBase12799.70[40]PPGIdentificationBIDMC, MIMIC, CapnoBase12799.75[70]PPGIdentificationBIDMC, MIMIC, CapnoBase12799.88[72]PPGVerificationReal-World PPG3599.50[68]PPGVerificationReal-World PPG3599.00[93]PPGVerificationReal-World PPG3597.00[64]PPGVerificationPRRB, MIMIC-II, Berry-Nonin20099.00[25]PPGVerificationBIDMC, MIMIC, CapnoBase12799.69[53]rPPGIdentificationPersonal Measurement1746699.74[75]sEMGIdentificationPersonal Measurement493.10[61]This table summarizes all included studies categorized by signal modality, task type (verification/identification), dataset source, and reported accuracy. “Both” indicates studies reporting results for both identification and verification tasks
Signal preprocessing methods and accuracy rates
Table 6 summarizes preprocessing methods used in biometric authentication and recognition studies, along with the reported accuracy rates. Although some studies applied multiple preprocessing techniques, only the primary method is reported for clarity.
Common preprocessing techniques included noise filtering, band-pass filtering, wavelet transform, Butterworth filtering, and peak detection. For ECG, band-pass filtering and wavelet transform consistently yielded the highest accuracy. For EEG, noise filtering and wavelet transform achieved strong performance, with convolutional neural network-based models approaching 100%. For PPG, preprocessing approaches such as wavelet transform, binarization, and singular-value decomposition resulted in accuracy above 99%. Overall, preprocessing strongly influenced biometric system performance, with effectiveness varying by signal type and dataset.
Overall, preprocessing strongly influences biometric system performance, with effectiveness varying by signal type and dataset. These results highlight the critical role of preprocessing in improving accuracy and guide the selection of techniques for more reliable biometric authentication. Table 6. Signal preprocessing methods and reported accuracies by modalitySignalsPreprocessing methodsAccuracy (%)ReferencesSignalsPreprocessing methodsAccuracy (%)ReferencesECGAdaptive threshold filter95.40[58]ECGBand pass filter98.00[46]ECGBand pass filter100.00[10]ECGBand pass filter100.00[76]ECGBand pass filter100.00[41]ECGButterworth filter94.00[71]ECGButterworth filter99.00[88]ECGButterworth filter99.00[96]ECGButterworth filter99.00[62]ECGContinuous wavelet transform99.90[57]ECGDifferentiation filter99.80[45]ECGFinite impulse response filter99.13[48]ECGHigh pass filter99.62[91]ECGIsoelectric line drift extraction99.60[81]ECGLow pass filter87.61[60]ECGModulation94.16[42]ECGNoise filter92.00[43]ECGNoise filter93.14[27]ECGNoise filter95.30[82]ECGNoise filter95.46[39]ECGNoise filter98.00[56]ECGNoise filter98.10[36]ECGNoise filter98.31[37]ECGNoise filter98.42[77]ECGNoise filter98.60[51]ECGNoise filter99.30[78]ECGNoise filter99.69[80]ECGNoise filter99.80[24]ECGNoise filter99.89[15]ECGNoise filter100.00[44]ECGNotch filter99.05[59]ECGPeak detection91.30[55]ECGPeak detection99.30[29]ECGResampling98.00[74]ECGSignal pattern extraction97.50[30]ECGSignal pattern extraction98.40[28]ECGSpectrogram representation99.87[84]ECGWavelet transform95.17[79]ECGWavelet transform99.14[90]ECGWavelet transform100.00[65]ECGZ-Score normalization99.27[67]EEGBand pass filter88.00[49]EEGBand pass filter93.86[69]EEGBand pass filter99.98[22]EEGChebyshev filter94.27[26]EEGCNN-based preprocessing98.54[73]EEGCNN-based preprocessing99.00[31]EEGDiscrete Fourier transform98.78[35]EEGDiscrete wavelet transform99.30[47]EEGFrequency band decomposition83.15[13]EEGHigh pass filter86.74[85]EEGIndependent component analysis98.80[38]EEGLow pass filter96.00[83]EEGLow pass filter96.70[92]EEGLow pass filter99.00[98]EEGModulation97.60[23]EEGNoise filter83.21[33]EEGNoise filter97.00[63]EEGNoise filter99.00[86]EEGNoise filter99.00[50]EEGNoise filter100.00[94]EEGPower spectral density97.17[66]EEGSavitzky–Golay filter98.50[54]EEGSignal segmentation100.00[95]EEGWavelet packet decomposition99.00[99]EEGWavelet soft threshold99.10[52]EEGWavelet transform91.10[89]EMGCalculation of statistical properties96.00[97]PPGBand pass filter99.00[93]PPGBinarization99.00[32]PPGButterworth filter97.00[64]PPGDiscrete wavelet transform99.70[40]PPGHigh pass filter99.00[25]PPGLow pass filter99.69[53]PPGSignal smoothing99.50[68]PPGSingular value decomposition99.88[72]PPGWavelet transform95.65[34]PPGWavelet transform99.75[70]rPPGYCbCr color space conversion99.74[75]sEMGBand pass filter93.10[61]Methods are reported as stated by the original authors. Values are the best reported accuracies within each cited study
Feature extraction methods
Table 7 summarizes the feature extraction techniques employed across the reviewed studies. The most common approaches included time-frequency-domain analysis, morphological descriptors, and deep-learning-based feature representations (e.g., CNN, LSTM). These techniques were typically applied after preprocessing and prior to classification to enhance model robustness and accuracy. Table 7. Feature extraction methods and reported accuracies by signal modalitySignalFeature extraction methodAcc. (%)Refs.SignalFeature extraction methodAcc. (%)Ref.EEGAutoregressive coefficients93.86[69]EEGAutoregressive coefficients97.00[63]EEGCalculation of statistical properties83.15[13]EEGCalculation of statistical properties98.50[54]EEGCalculation of statistical properties98.80[38]EEGCalculation of statistical properties99.00[50]EEGConvolutional neural network83.21[33]EEGConvolutional neural network98.54[73]EEGConvolutional neural network99.00[98]EEGConvolutional neural network99.00[31]EEGCovariance matrix97.60[23]EEGElectroencephalogram-based subject matching learning99.00[86]EEGFrequency band decomposition98.78[35]EEGHierarchical discriminant component analysis94.27[26]EEGInstantaneous energy99.30[47]EEGMorphological feature extraction96.00[83]EEGMorphological feature extraction100.00[95]EEGPower spectral density88.00[49]EEGPower spectral density96.70[92]EEGPower spectral density97.17[66]EEGPower spectral density99.98[22]EEGPower spectrum100.00[94]EEGSignal segmentation86.74[85]EEGSpectral energy99.10[52]EEGWavelet packet decomposition99.00[99]EEGWavelet transform91.10[89]ECGBinary convolutional neural network99.30[78]ECGCalculation of statistical properties100.00[10]ECGContinuous wavelet transform98.10[36]ECGContinuous wavelet transform99.90[57]ECGConvolutional neural network98.60[51]ECGConvolutional neural network99.27[67]ECGCross-correlation analysis98.40[28]ECGDiscrete wavelet transform99.62[91]ECGEigenspace alignment of signals94.16[42]ECGFinite context models99.00[62]ECGKernel extreme learning machine100.00[65]ECGLong short-term memory99.80[45]ECGMorphological feature extraction87.61[60]ECGMorphological feature extraction93.14[27]ECGMorphological feature extraction94.00[71]ECGMorphological feature extraction95.40[58]ECGMorphological feature extraction98.00[46]ECGMorphological feature extraction98.31[37]ECGMorphological feature extraction99.80[24]ECGPeak detection91.30[55]ECGPeak detection92.00[43]ECGPeak detection99.13[48]ECGPeak detection99.30[29]ECGPeak detection100.00[76]ECGPhase portraits99.60[81]ECGPhase space reconstruction techniques99.00[88]ECGPolynomial curve fitting95.46[39]ECGSignal pattern extraction99.05[59]ECGSimilarity-dissimilarity measures97.50[30]ECGTemporal convolutional neural network100.00[44]ECGTime-frequency domain features95.30[82]ECGTime-frequency domain features98.00[74]ECGTime-frequency domain features98.00[56]ECGTime-frequency domain features99.00[96]ECGTime-frequency domain features99.69[80]ECGTime-frequency domain features99.87[84]ECGTime-frequency domain features100.00[41]ECGWavelet Transform95.17[79]ECGWavelet transform98.42[77]ECGWavelet Transform99.14[90]ECGWhale optimization algorithm - artificial neural network99.89[15]EMGRoot mean square96.00[97]PPGAverage cycles in time domain99.00[25]PPGBinary representation of biometrics and mapping to hash tables99.00[32]PPGConvolutional neural network97.00[64]PPGConvolutional neural network99.00[93]PPGDiscrete wavelet transform95.65[34]PPGFrequency domain features99.69[53]PPGInstantaneous energy99.70[40]PPGLocal Mean decomposition99.88[72]PPGMorphological feature extraction99.75[70]PPGSignal pattern extraction99.50[68]rPPGTime-frequency domain features99.74[75]sEMGTime-frequency domain features93.10[61]Methods are reported as stated by the original authors. Accuracies correspond to the best result per article when multiple results are available
Classification methods and accuracy rates
Table 8 summarizes the average dataset sizes and reported accuracy rates for classification methods applied in biometric recognition and verification. This comparison highlights the effectiveness of traditional machine learning, statistical approaches, and deep-learning models.
Key findings include:
- Random Forest and Support Vector Machines (SVM) are widely applied. Random Forest achieved 83.2% accuracy in verification and 99.6% in recognition, while SVM provided similarly high and stable performance.
- Deep-learning methods—particularly convolutional neural networks (CNNs)—demonstrated strong performance on large datasets, achieving up to 96.9% accuracy in verification.
- Machine-learning approaches generally achieved accuracy above 90%, whereas deep-learning and statistical techniques often reached 97–100%.
- Distance-based and anomaly-detection methods—such as Euclidean distance and Local Outlier Factor (LOF)—also reported high accuracy values. Table 8. Signal classification methods and reported accuracies by modalitySignalsClassification methodsAccuracy (%)ReferencesSignalsClassification methodsAccuracy (%)ReferencesECGArtificial Neural Network98.60[51]ECGArtificial Neural Network95.46[39]ECGArtificial Neural Network99.13[48]ECGBinary Convolutional Neural Network100.00[76]ECGBinary Convolutional Neural Network99.30[78]ECGCancelable Biometrics Method99.87[84]ECGConvolutional Neural Network99.00[88]ECGConvolutional Neural Network98.10[36]ECGConvolutional Neural Network99.27[67]ECGConvolutional Neural Network99.69[80]ECGConvolutional Neural Network99.90[57]ECGCosine Similarity99.30[29]ECGCross-Correlation98.40[28]ECGDeep Belief Network99.89[15]ECGDRNN–LSTM98.00[46]ECGDRNN–LSTM95.40[58]ECGDRNN–LSTM99.80[45]ECGEuclidean Distance100.00[41]ECGEuclidean Distance99.80[24]ECGIsometric Bundle Search Method99.14[90]ECGKernel Extreme Learning Machine100.00[65]ECGK-Nearest Neighbors91.30[55]ECGLeast Squares SVM99.00[96]ECGLinear Discriminant Analysis97.50[30]ECGLinear Discriminant Analysis98.42[77]ECGMultidimensional Identification93.14[27]ECGNormalized Relative Compression99.00[62]ECGPhase Portrait Method99.60[81]ECGRandom Forest92.00[43]ECGRandom Forest99.62[91]ECGReconstructed Learning94.16[42]ECGRelative Score Threshold Classifier100.00[44]ECGSparse Representation98.00[56]ECGSupervised Learning100.00[10]ECGSupervised Learning98.31[37]ECGSupervised Learning99.85[87]ECGSupport Vector Machine94.00[71]ECGSupport Vector Machine87.61[60]ECGSupport Vector Machine95.17[79]ECGSupport Vector Machine95.30[82]ECGSupport Vector Machine99.05[59]ECGTransformation Mechanism98.00[74]EEGConvolutional Neural Network99.00[98]EEGConvolutional Neural Network99.00[50]EEGConvolutional Neural Network83.21[33]EEGConvolutional Neural Network86.74[85]EEGConvolutional Neural Network97.17[66]EEGConvolutional Neural Network98.54[73]EEGCorrelation Coefficient Calculation99.98[22]EEGDecision Fusion99.10[52]EEGDeep Neural Network100.00[94]EEGDRNN–LSTM99.00[86]EEGDRNN–LSTM99.54[114]EEGFuzzy Vault Scheme96.00[83]EEGHidden Markov Model98.50[54]EEGHDCA94.27[26]EEGK-Nearest Neighbors97.00[63]EEGK-Nearest Neighbors93.86[69]EEGLinear Discriminant Analysis88.00[49]EEGLinear Discriminant Analysis99.00[31]EEGLocal Outlier Factor99.30[47]EEGNeural Network Classifier97.60[23]EEGRandom Forest83.15[13]EEGSupervised Learning91.10[89]EEGSupervised Learning96.70[92]EEGSupport Vector Machine99.00[99]EEGSupport Vector Machine98.80[38]EEGUnsupervised Learning100.00[95]EMGRecurrent Neural Network96.00[97]PPGBinary Hypothesis Testing99.00[32]PPGConvolutional Neural Network97.00[64]PPGConvolutional Neural Network99.50[68]PPGConvolutional Neural Network99.75[70]PPGEuclidean Distance99.69[53]PPGK-Nearest Neighbors99.88[72]PPGLocal Outlier Factor99.70[40]PPGManhattan Distance99.00[25]PPGStacked Extreme Learning Machine94.97[99]PPGSupervised Learning99.00[93]PPGSupport Vector Machine95.65[34]rPPGConvolutional Neural Network99.74[75]sEMGLight Gradient Boosting Machine93.10[61] Methods are listed as reported by the original authors. Accuracies correspond to the best result per article when multiple results are availableDRNN–LSTM: Deep Recurrent Neural Network with Long Short-Term Memory;HDCA: Hierarchical Discriminant Component Analysis;* LGBM*: Light Gradient Boosting Machine.
Multimodal studies
Table 9 illustrates the impact of multimodal fusion on biometric recognition and verification performance. By combining multiple biometric signals (e.g., ECG with PPG), fusion approaches consistently improved accuracy across methodological frameworks, including machine-learning, statistical, and deep-learning paradigms.
For ECG-based studies, multimodal validation combining machine-learning and deep-learning models typically achieved accuracies above 99%. In EEG-based research, both statistical and deep-learning methods yielded strong results, such as 98.8% accuracy with the EEGMMIDB dataset. Fusion approaches similarly enhanced recognition and verification performance when applied to face-, fingerprint-, and PPG-based systems.
Key findings can be summarized as follows:
- ECG signals combined with multimodal deep-learning or machine-learning models achieved accuracies of approximately 99.8% in validation tasks.
- EEG multimodal recognition studies using deep learning reported accuracies above 98%.
- Fingerprint- and face-recognition performance improved substantially through multimodal fusion.
- PPG and rPPG signals, particularly in verification contexts, reached accuracies as high as 99.9%. Table 9. Multimodal studies and reported accuracies by modalitySignalsTaskMethodDatasetsSubjectsAccuracy (%)ReferencesECGBothDLFANTASIA, MIT-BIH, CYBHi200100.00[44]ECGIdentificationDLECG-ID, MIT-BIH, NSR-DB15699.62[91]ECGIdentificationDLMIT-BIH NSR, MIT-BIH arrhythmia5099.80[45]ECGIdentificationDL–MLPersonal measurement10098.00[46]ECGIdentificationMLMLII, UCI arrhythmia, PTBDB290100.00[65]ECGIdentificationMLPTBDB29095.30[82]ECGIdentificationSMPersonal measurement15099.80[24]ECGIdentificationSM–MLDREAMER2391.30[55]ECGIdentificationSM–MLFANTASIA, MIT-BIH Arrhythmia, ECG-ID, European ST-T, Aveiro ECG20098.00[56]ECGIdentificationSM–MLSchiller ECG database46098.40[28]ECGVerificationDLECG-ID9099.85[87]ECGVerificationDL–MLMWM-HIT, ECG-ID9099.89[15]ECGVerificationDL–MLTW, VeinPolyU, MWM-HIT, ECG-ID9098.60[51]ECGVerificationMLECG-ID9094.00[71]ECGVerificationMLMIT-BIH arrhythmia4799.00[96]ECGVerificationSMMIT-BIH Multi-parameter18100.00[10]ECGVerificationSMSchiller ECG database46097.50[30]EEGBothDLEEGMMIDB10999.00[98]EEGBothDLPersonal Measurement2199.00[31]EEGBothSM–MLEEGMMIDB10999.00[99]EEGVerificationDLMAHNOB-HCI3599.10[52]EEGVerificationDLPersonal Measurement5898.78[35]EEGVerificationMLEEGMMIDB10983.21[33]EEGVerificationMLPersonal Measurement2098.50[54]EEGVerificationMLPersonal Measurement3991.10[89]EEGVerificationSMPersonal Measurement4594.27[26]EEGVerificationSM–MLEEGMMIDB10999.98[22]PPGBothSM–MLBIDMC, MIMIC, CapnoBase12799.70[40]PPGBothSM–MLPersonal Measurement2395.65[34]PPGIdentificationDLBIDMC, MIMIC, CapnoBase12799.75[70]PPGIdentificationMLBIDMC, MIMIC, CapnoBase12799.88[72]PPGVerificationDLReal-World PPG3599.00[93]PPGVerificationDLReal-World PPG3597.00[64]PPGVerificationSM–MLBIDMC, MIMIC, CapnoBase12799.69[53]rPPGIdentificationDLPersonal Measurement1746699.74[75]sEMGIdentificationMLPersonal Measurement493.10[61]Task categories are as reported in the original studies. DL–ML indicates hybrid approaches integrating deep and classical learning methodsDL: deep learning;* ML*: machine learning;SM: statistical methods;* SM–ML*: hybrid statistical and machine learning methods.
Encrypted solution methods
Table 10 presents the application of encrypted solution methods in biometric recognition and verification. Encryption enhances biometric-data security during authentication and strengthens system resilience against cyberattacks. The table lists biometric signals, datasets, recognition or verification tasks, and their corresponding accuracy rates.
Key findings can be summarized as follows:
- In ECG-based recognition studies, encrypted methods achieved very high performance, including 100% accuracy with the PTBDB dataset.
- An EEG study using the BCI Competition 2008 dataset reported 96% accuracy with encrypted solutions.
- PPG-based recognition and verification studies also achieved high accuracy, reaching up to 99%, as observed in the UBIRIS dataset.
- Combining encrypted solutions with machine-learning and statistical methods resulted in secure, high-accuracy biometric systems. Table 10. Encrypted solution methods reported in the literatureSignalsTaskMethodDatasetsSubjectsAccuracy (%)ReferencesECGIdentificationDLMIT-BIH NSR, MIT-BIH Arrhythmia5099.80[45]ECGIdentificationMLMLII, UCI Arrhythmia, PTBDB290100.00[65]ECGIdentificationSM–MLDREAMER2391.30[55]ECGIdentificationSM–MLPhysioNet ECG-ID2099.13[48]ECGVerificationDLPTB Diagnostic11599.00[88]ECGVerificationDL–MLMIT-BIH Arrhythmia4795.46[39]ECGVerificationSM–MLECG-ID, PTBDB, CEBSDB400100.00[41]EEGIdentificationMLEEGMMIDB10997.00[63]EEGVerificationDLRSVP, Sternberg Task, BCI200013999.00[86]Encryption-related approaches included methods integrating statistical, machine, and deep learning schemes for privacy-preserving biometric systems
Performance comparisons
This section analyzes average accuracy rates achieved in recognition and verification tasks across different biometric signals. Table 12 compares ECG, EEG, EMG, PPG, rPPG, and sEMG across both tasks. Overall, performance varied across signal types, with multimodal approaches further enhancing accuracy rates. To provide a more analytical synthesis, subgroup comparisons were also conducted by dataset size and methodology. As shown in Figure 3, verification (1:1) studies achieved consistently higher accuracy than identification (1:N), whereas combined approaches exhibited intermediate performance levels. Large datasets ( \documentclass[12pt]{minimal} \usepackage{amsmath} \usepackage{wasysym} \usepackage{amsfonts} \usepackage{amssymb} \usepackage{amsbsy} \usepackage{mathrsfs} \usepackage{upgreek} \setlength{\oddsidemargin}{-69pt} \begin{document}$$>500$$\end{document} participants) yielded 99.1% accuracy on average, compared to 94.8% for small datasets ( \documentclass[12pt]{minimal} \usepackage{amsmath} \usepackage{wasysym} \usepackage{amsfonts} \usepackage{amssymb} \usepackage{amsbsy} \usepackage{mathrsfs} \usepackage{upgreek} \setlength{\oddsidemargin}{-69pt} \begin{document}$$<50$$\end{document} participants). Deep-learning approaches also outperformed traditional machine-learning methods, achieving accuracies of 98.9% and 96.3%, respectively (Figure 4).
Electrocardiogram (ECG) datasets were widely used in biometric verification and recognition owing to their consistently high accuracy. For example, the PTB-XL dataset frequently reported accuracies close to 99%, while the MIT-BIH Arrhythmia Database achieved 99.2%. The PTB Diagnostic ECG Database reached 99.9%, demonstrating exceptionally strong performance, whereas the PhysioNet QT dataset yielded slightly lower values at 96.2%.
Electroencephalogram (EEG) datasets showed more variable performance, reflecting the inherent complexity of brain signals. The EEGMMIDB dataset achieved 98.8% accuracy, whereas the WAY-EEG-GAL dataset reported a significantly lower value of 83.2%. The BCI Competition 2008 dataset demonstrated intermediate performance with 96% accuracy. These results suggest that while EEG offers high potential, signal variability and noise sensitivity limit consistency, especially in verification-only tasks.
Photoplethysmogram (PPG) and remote PPG (rPPG) datasets also demonstrated strong results, particularly in verification scenarios. The MIMIC-II dataset reported accuracies around 99%, and BIDMC reached 99.7%. Real-world PPG datasets performed slightly lower ( \documentclass[12pt]{minimal} \usepackage{amsmath} \usepackage{wasysym} \usepackage{amsfonts} \usepackage{amssymb} \usepackage{amsbsy} \usepackage{mathrsfs} \usepackage{upgreek} \setlength{\oddsidemargin}{-69pt} \begin{document}$$\approx$$\end{document} 97%), yet still highlight the strong potential of PPG signals for wearable and remote authentication systems. Similarly, rPPG studies achieved values as high as 99.74%, confirming their suitability for non-contact applications.
As summarized in 11, ECG-based systems achieved the highest mean accuracy (98.6%), followed by PPG (98.4%) and EEG (96.8%), confirming the robustness of physiological-signal authentication.
Electromyogram (EMG) and surface EMG (sEMG) datasets demonstrated moderate performance in movement-based authentication tasks. A personal EMG dataset reported 96% accuracy, while sEMG achieved 93.1%, which is considered reasonable given the variability in muscle activity. Although less accurate than ECG, EEG, or PPG, these signals may serve as complementary modalities in multimodal systems.
Face and fingerprint datasets remain reliable benchmarks in biometric verification. For instance, the FERET face dataset reported 95% accuracy, and the VeinPolyU Finger Vein dataset achieved 98.6%. These results indicate that while traditional biometric traits continue to demonstrate robust performance, physiological signals such as ECG, EEG, and PPG offer enhanced resilience and multimodal integration opportunities. Table 11. Descriptive cross-modality performance comparison of biometric signals (2018–2023)ModalityAccuracy (%)Precision (%)Recall (%)F1-Score (%)AUC (%)ECG98.698.998.898.899.1EEG96.896.395.996.197.5PPG/rPPG98.498.598.298.398.8EMG/sEMG94.694.093.593.794.8Multimodal99.599.699.499.599.7Overall mean97.997.997.597.7****98.4Values represent averaged performance metrics aggregated across 80 studies. Reported values are descriptive and not derived from a formal meta-analysis
To strengthen cross-modality analysis, Table 11 provides a unified summary of the main performance metrics reported across modalities, including accuracy, precision, recall, F1-Score, and AUC. This aggregated overview enables a more direct comparison among ECG, EEG, PPG, EMG, and multimodal systems. As shown, multimodal biometric systems exhibit the highest overall performance (Accuracy = 99.5%, AUC = 99.7%), followed by ECG (98.6%) and PPG (98.4%), confirming the consistent advantage of fusion-based approaches. Although inter-study heterogeneity prevents a formal meta-analytical pooling, this integrated summary quantitatively consolidates the performance landscape across modalities. Table 12. Performance summary by biometric signal and task (2018–2023)SignalTaskStudies (n)Average accuracy (%)Range (%)ECGBoth797.8892.00–100.00ECGIdentification1797.6191.30–100.00ECGVerification1997.8887.61–100.00EEGBoth599.1698.80–100.00EEGIdentification696.7686.74–100.00EEGVerification1594.7583.15–99.98EMGVerification196.0096.00–96.00PPGBoth297.6795.65–99.70PPGIdentification299.8299.75–99.88PPGVerification598.4497.00–99.69rPPGIdentification199.7499.74–99.74sEMGIdentification193.1093.10–93.10 Values represent arithmetic means and observed accuracy ranges among included studies for each modality and task type
Fig. 3. Performance summary Fig. 4. Subgroup comparison of accuracy rates
Discussion
Principal findings
Scope of interpretation: where statements are not attributable to a single study, they reflect patterns synthesized across multiple sources rather than results from individual experiments.
This review assessed biometric authentication systems in terms of datasets, preprocessing, and classification techniques. Among the evaluated signals, ECG, EEG, and PPG were the most prominent, with ECG showing the highest reliability (mean accuracy 98.6%). Deep-learning approaches generally outperformed traditional machine-learning methods, and multimodal systems exceeded 99% accuracy by mitigating limitations of individual modalities. Performance was also influenced by dataset size and preprocessing: larger datasets yielded higher accuracy, and methods such as wavelet transforms and band-pass filtering enhanced signal quality. Security mechanisms (e.g., encryption) further safeguarded biometric data.
Beyond accuracy, the findings carry practical implications: ECG and PPG/rPPG show strong potential for clinical and wearable systems; EEG offers opportunities for integration with cognitive monitoring in security-sensitive settings; and multimodal fusion is promising for robust verification in mobile and IoT deployments.
The cross-modality comparison (Table 11) highlights that multimodal fusion consistently outperforms unimodal approaches, achieving very high discriminative performance (AUC \documentclass[12pt]{minimal} \usepackage{amsmath} \usepackage{wasysym} \usepackage{amsfonts} \usepackage{amssymb} \usepackage{amsbsy} \usepackage{mathrsfs} \usepackage{upgreek} \setlength{\oddsidemargin}{-69pt} \begin{document}$$\approx 99.7\%$$\end{document} ).
Comparison with previous studies
Prior reviews typically focused on a single modality (e.g., EEG or ECG), whereas the present work synthesizes across multiple signals. Consistent with prior findings, multimodal biometric systems demonstrated superior accuracy, typically above 99%, by combining complementary strengths of different signals. Our results align with reports that dataset size substantially affects accuracy; larger cohorts produced more robust outcomes. Similarly, advanced preprocessing and encryption methods have been highlighted in the literature as critical for reliability and security.
In comparison with recent high-impact studies, our findings are consistent with Ketola et al. [13] demonstrated the utility of channel reduction in EEG authentication, and Esener [10] integrated stress-level estimation into driver authentication. Singh and Tiwari [15] reported multimodal fusion accuracies up to 99.7%, supporting our subgroup findings. Recent reviews (2022–2024) similarly emphasize the growing dominance of deep learning, increased exploration of multimodality, and the need for domain adaptation to handle cross-session variability.
More recent reviews (2022–2024) also emphasize the same trends: the growing dominance of deep learning, increasing exploration of multimodal approaches, and the urgent need for domain adaptation to handle cross-session variability. Together, these studies confirm that the trajectory of the field is shifting toward scalable, secure, and multimodal biometric systems.
Strengths and limitations of the study
This systematic review makes an important contribution by evaluating diverse biometric signal types within a unified framework. Strengths include the integration of multimodal analyses, detailed subgroup comparisons, and adherence to PRISMA 2020 guidelines.
Limitations include heterogeneity across datasets and restricted generalizability beyond the studied signals. The temporal scope was intentionally limited to 2018–2023, as the search concluded in early 2024. Consequently, studies published in 2024–2025 were not included, which is acknowledged as a limitation.
Table 13 summarizes the strengths and weaknesses of different biometric signals. This table provides a critical evaluation across ECG, EEG, PPG/rPPG, EMG/sEMG, and multimodal approaches, reducing repetition of numerical accuracy rates and highlighting implications for real-world applications.
Future work should therefore explore lightweight fusion algorithms, on-device/edge inference, and reduced-sensor configurations to mitigate cost, power, and usability constraints. These include increased sensor cost, higher energy consumption, complex integration requirements, and potential inconvenience for end-users. Such limitations are particularly evident in healthcare (due to energy constraints), mobile or wearable systems (affecting user comfort), and industrial deployments (due to sensor cost). Future work should therefore explore lightweight multimodal fusion algorithms, optimized edge-computing strategies, and reduced sensor configurations to mitigate these barriers. Table 13. Strengths and weaknesses of biometric signal modalitiesSignal typeStrengthsWeaknessesECGHigh accuracy ( \documentclass[12pt]{minimal} \usepackage{amsmath} \usepackage{wasysym} \usepackage{amsfonts} \usepackage{amssymb} \usepackage{amsbsy} \usepackage{mathrsfs} \usepackage{upgreek} \setlength{\oddsidemargin}{-69pt} \begin{document}$$\ge 98\%$$\end{document} ), large number of open datasets, robust for verification tasksSensitive to inter-individual variability and physiological state (exercise, stress)EEGRich temporal–spatial information; strong performance with deep learning; useful for multimodal fusionHigh noise sensitivity; session-to-session variability; complex and costly recording setupPPG/rPPGNon-invasive; feasible for wearable or remote authentication; high verification accuracy ( \documentclass[12pt]{minimal} \usepackage{amsmath} \usepackage{wasysym} \usepackage{amsfonts} \usepackage{amssymb} \usepackage{amsbsy} \usepackage{mathrsfs} \usepackage{upgreek} \setlength{\oddsidemargin}{-69pt} \begin{document}$$\ge 99\%$$\end{document} )Sensitive to motion artifacts and illumination changes; lower stability in uncontrolled environmentsEMG/sEMGEffective for movement-based authentication; moderate accuracy ( \documentclass[12pt]{minimal} \usepackage{amsmath} \usepackage{wasysym} \usepackage{amsfonts} \usepackage{amssymb} \usepackage{amsbsy} \usepackage{mathrsfs} \usepackage{upgreek} \setlength{\oddsidemargin}{-69pt} \begin{document}$$\approx 93$$\end{document} – \documentclass[12pt]{minimal} \usepackage{amsmath} \usepackage{wasysym} \usepackage{amsfonts} \usepackage{amssymb} \usepackage{amsbsy} \usepackage{mathrsfs} \usepackage{upgreek} \setlength{\oddsidemargin}{-69pt} \begin{document}$$96\%$$\end{document} )Limited generalizability; scarce large-scale datasets; sensor placement dependencyMultimodalVery high accuracy ( \documentclass[12pt]{minimal} \usepackage{amsmath} \usepackage{wasysym} \usepackage{amsfonts} \usepackage{amssymb} \usepackage{amsbsy} \usepackage{mathrsfs} \usepackage{upgreek} \setlength{\oddsidemargin}{-69pt} \begin{document}$$>99\%$$\end{document} ); complementary modalities increase robustness and spoof resistanceRequires multiple sensors; complex integration; higher energy and computational cost; potential user inconvenience Summarized strengths and weaknesses are based on trends observed across 2018–2023 studies
Strengths of the study
- Comprehensive Literature Review
This study systematically reviewed 80 articles published between 2018 and 2023, applying a comprehensive search strategy across major databases (EBSCO, PubMed, IEEE Xplore, Scopus, Web of Science), adhering to PRISMA 2020. Unlike prior reviews that focused on a single biometric signal, our work compared multiple modalities such as ECG, EEG, and PPG, thereby providing a more holistic overview of the field [115, 116].
- 2.Focus on multimodal biometric systems
A key strength of this review lies in its emphasis on multimodal systems, which consistently demonstrated very high accuracies, typically 99.3–99.8% across recent datasets [117, 118]. Beyond performance metrics, the findings highlight the resilience of multimodal frameworks against spoofing attempts and their capacity to enhance overall system security.
- 3.Analysis of dataset size and accuracy
The study also examined the relationship between dataset size and recognition accuracy. Results confirmed that larger datasets yield significantly higher accuracies compared to smaller cohorts, underscoring the importance of robust sample sizes in biometric system validation [12, 119].
- 4.Adherence to PRISMA 2020 guidelines
Methodological transparency was ensured by adhering to PRISMA 2020 guidelines, including a PRISMA flow diagram and explicit inclusion/exclusion criteria. The review employed a PRISMA flow diagram and clearly reported inclusion and exclusion criteria, ensuring reproducibility and compliance with international standards.
Weaknesses of the study
- Dataset limitations and generalizability
A considerable limitation is that most datasets were predominantly laboratory-based, with limited validation under real-world conditions. Demographic variability (e.g., age, health status) was rarely modeled, constraining generalizability [120, 121].
- 2.Technical limitations
Signal-processing and classification pipelines remain sensitive to noise—particularly in EEG—reducing stability in validation tasks [49, 122]. These technical challenges highlight the need for improved preprocessing and artifact removal techniques.
- 3.Methodological variability and bias
The included studies displayed substantial variability in methodology. Some relied on small datasets, while others employed larger ones, and the use of heterogeneous algorithms and protocols impeded direct comparison of reported accuracies and introduced synthesis bias [123, 124].
- 4.Security and privacy gaps
Finally, the review identified important gaps in security and privacy practices. Standardized protocols for encryption, secure storage, and data sharing remain insufficient, limiting end-to-end security guarantees [20, 21]. Future research should therefore prioritize developing robust safeguards to enhance resilience against data breaches and privacy violations.
Overall implications and research agenda
Taken together, the findings of this review suggest that biometric authentication systems are moving toward multimodal, deep-learning-driven, and privacy-preserving frameworks. Practical implications include the feasibility of integrating PPG and rPPG into wearable devices, the use of EEG in cognitive monitoring for high-security environments, and the continued robustness of ECG in clinical and mobile contexts.
Key gaps include (i) standardized cross-session protocols (train/test across days/sessions); (ii) large-scale, demographically diverse, multimodal benchmarks with common splits; (iii) mandatory reporting of AUC, EER, calibration (Brier), and confidence intervals; and (iv) open, reproducible validation frameworks with pre-registered evaluation scripts. Addressing these gaps will be critical for advancing biometric authentication toward real-world deployment at scale.
Conclusion and recommendations
General evaluation
This systematic review comprehensively evaluated multiple biometric modalities—including ECG, EEG, PPG, EMG, rPPG, face, and fingerprint—within the context of authentication and recognition. Performance was examined across a wide range of classification paradigms, enabling a comparative synthesis of key methodological and application-level trends reported in the literature.
Overall, the reviewed studies indicate that ECG-based systems consistently report high accuracy levels, typically ranging from 98.6% to 99.9%, particularly when large and well-curated datasets are employed. These findings suggest that ECG represents a highly promising physiological modality for biometric authentication under controlled evaluation settings.
EEG-based systems exhibited greater variability in reported performance (83.1–100%), reflecting the inherent sensitivity of brain signals to noise, task design, and session variability. Nevertheless, studies integrating advanced deep-learning architectures demonstrated strong results, indicating that improved preprocessing, feature-extraction, and domain-adaptation strategies may further enhance robustness.
PPG and rPPG signals achieved very high verification accuracy, with reported values reaching up to 99.8%, highlighting their potential suitability for wearable and remote authentication scenarios. In particular, rPPG-based approaches show promise for non-contact applications, although performance may be affected under unconstrained real-world conditions.
Across modalities, multimodal fusion strategies generally exhibited superior performance (99.3–99.8%) compared with unimodal systems, suggesting that complementary biometric information can enhance discriminative capability and robustness. In addition, the incorporation of encrypted and privacy-aware solutions was shown to strengthen data security while maintaining competitive authentication performance.
Taken together, these findings suggest that biometric signal–based authentication systems demonstrate strong potential for reliable identity verification and recognition. At the same time, reported outcomes remain dependent on dataset characteristics, evaluation protocols, and methodological choices, underscoring the need for cautious interpretation and standardized validation practices.
Recommendations for future research
Future research should extend beyond dataset expansion and multimodal integration to more explicitly align with emerging privacy-preserving artificial intelligence (AI) paradigms. Approaches such as federated learning, secure on-device inference, and encrypted model training offer promising pathways for achieving high authentication performance while maintaining data confidentiality and regulatory compliance (e.g., GDPR, HIPAA). These considerations are particularly critical in healthcare, mobile, and wearable applications, where continuous authentication must balance accuracy, privacy, and user trust.
Another critical gap identified in the literature is the predominant reliance on accuracy as the primary performance indicator. Many studies do not clearly distinguish between verification (1:1) and identification (1:N) tasks or consistently report standardized metrics, such as AUC and EER. Future work should adopt robust and transparent evaluation protocols that explicitly separate these tasks and incorporate complementary performance measures to improve comparability across studies.
In addition, the development of standardized, large-scale multimodal biometric datasets with unified evaluation benchmarks (e.g., accuracy, AUC, EER, F1-score) should be prioritized. Such resources would enable more consistent cross-study comparisons and accelerate reproducible research across physiological and behavioral biometric modalities. In parallel, open validation frameworks should be established to assess system performance under realistic and unconstrained conditions, accounting for factors such as cross-session variability, sensor heterogeneity, and user-behavior drift.
Building on the findings of this review, several specific research directions emerge: (i) the creation of standardized, demographically diverse, large-scale multimodal datasets; (ii) increased emphasis on domain-adaptation and cross-session generalization techniques; (iii) systematic evaluation of preprocessing pipelines and classification algorithms under noisy, real-world conditions; and (iv) continued advancement of encryption standards, privacy-preserving protocols, federated-learning strategies, and secure on-device architectures to ensure accuracy, transparency, and social acceptance in practical deployments.
Supplementary information
Supplementary material 1.Supplementary material 2.
The reference list from the paper itself. Each links out to its DOI / PubMed record.
- 1Zhang S, Sun L, Mao X, Cuiyun H, Liu P. Review on eeg-based authentication technology. Comput Intell Neurosci. 2021;5229576:2021.10.1155/2021/5229576 PMC 872001634976039 · doi ↗ · pubmed ↗
- 2Lafkih Maryam, Mikram Mounia, Ghouzali Sanaa, Haziti Mohammed El. Evaluation of the impact of noise on biometric authentication systems. ACM International Conference Proceeding Series, pages 188 – 192, 9 2019.
- 3Younis Aseel Yasir, Shuwandy, Moceheb Lazam. Machine learning and deep learning techniques for distinguishing between genuine users and impostors in eeg-based authentication using pattern lock. ISMSIT 2024 - 8th International Symposium on Multidisciplinary Studies and Innovative Technologies, Proceedings, page Ankara, 2024.