Long-read sequencing reveals increased isoform diversity in key transcription factor effectors of intercellular signalling at the invertebrate-vertebrate transition
Nuria P. Torres-Aguila, Marika Salonna, Sebastian M. Shimeld, Stefan Hoppler, David E. K. Ferrier

TL;DR
Long-read sequencing shows that vertebrates have more diverse isoforms of key signaling transcription factors compared to invertebrates, possibly aiding vertebrate evolution.
Contribution
Quantifies increased isoform diversity in transcription factors of key signaling pathways at the invertebrate-vertebrate transition.
Findings
Transcript isoform diversity increases significantly in TCF/LEF, GLI, and SMAD proteins during vertebrate evolution.
The increase is specific to main transcription factor effectors of Wnt/β-catenin, Hh, and BMP pathways.
This diversity may have contributed to vertebrate evolutionary complexity.
Abstract
Several intercellular signalling pathways (including wingless (Wnt), hedgehog (Hh), and bone morphogenetic protein (BMP)) are used repeatedly in animals throughout development and evolution and are also frequent targets for disease-associated disruptions. We have previously shown that the major transcriptional effectors of β-catenin-dependent Wnt signalling, the TCF/LEF proteins, in contrast to other pathway components, have a higher gene number and isoform diversity in vertebrates versus invertebrates, but this increased diversity has only been poorly quantified. Considering that isoform diversity correlates with organism complexity, any increase in major signalling effectors is likely to have made a significant contribution to vertebrate evolution. Using de novo long-read transcriptomes, we compared isoform number per gene for the chordates Ciona intestinalis, Lampetra planeri and…
Genes, proteins, chemicals, diseases, species, mutations and cell lines named across the full text — each resolved to its canonical identifier and authoritative record.
Click any figure to enlarge with its caption.
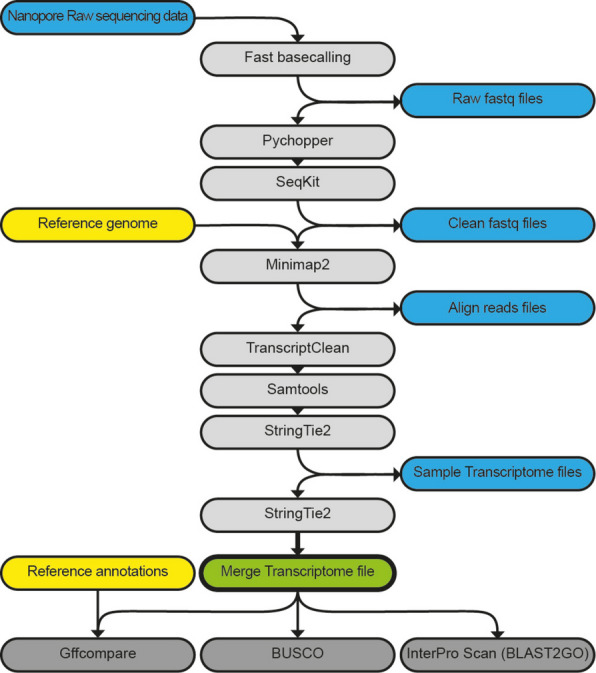 Figure 1
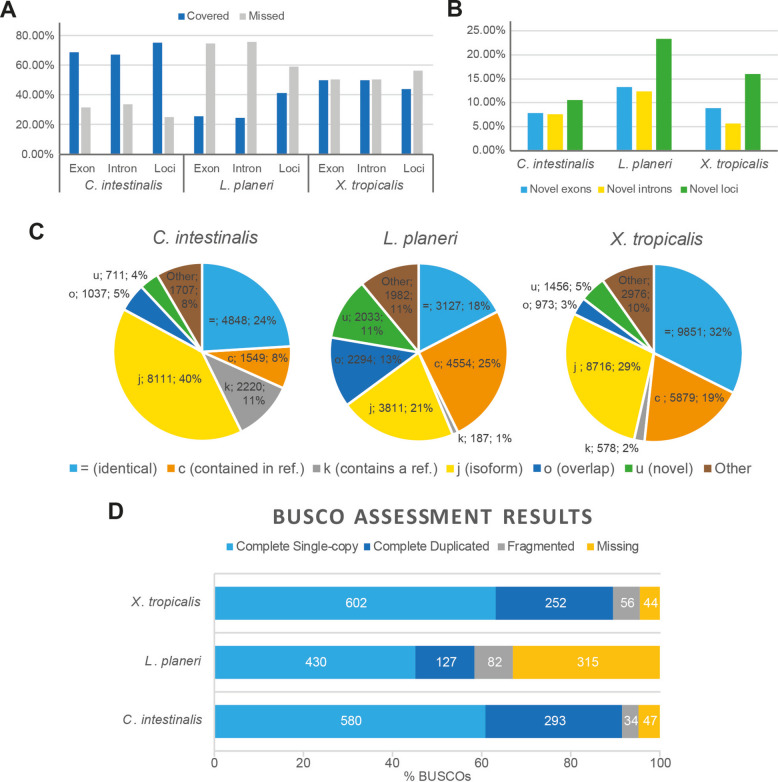 Figure 2
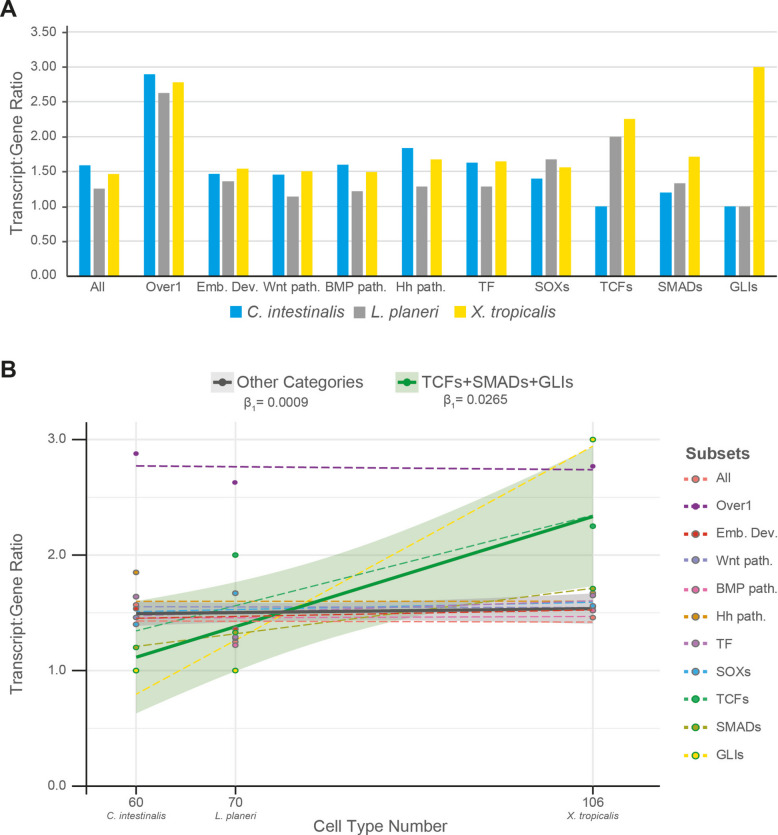 Figure 3
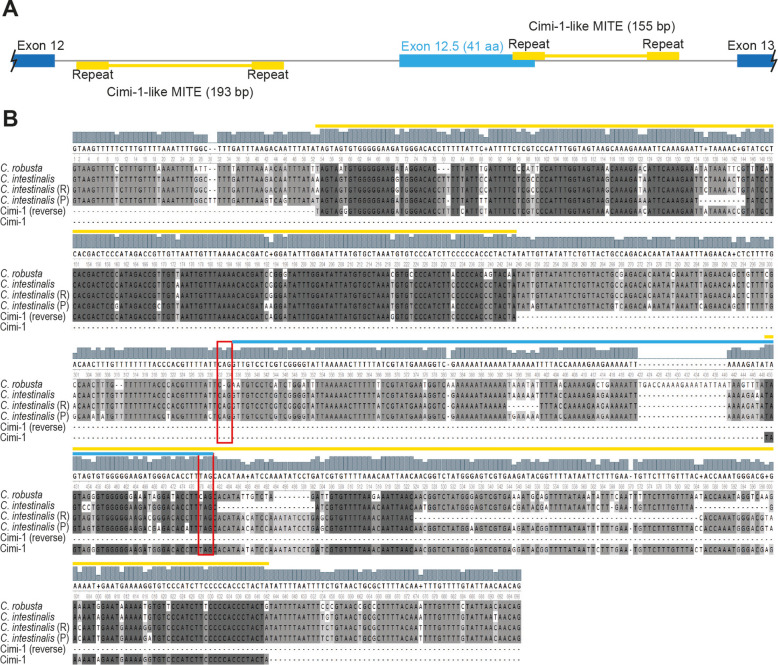 Figure 4
- —https://doi.org/10.13039/501100000268Biotechnology and Biological Sciences Research Council
- —Beatriu de Pinós postdoctoral fellowship programme
- —Marię Sklodowska-Curie European Union Horizon 2020
Peer Reviews
No public reviews on file for this paper yet. If you reviewed it on a platform where reviews are public (OpenReview, ICLR, NeurIPS, ICML), you can paste yours below so the community can read it here.
Videos
No videos yet. Explain this paper in a talk, walkthrough, or lecture? Add one.
Taxonomy
TopicsDevelopmental Biology and Gene Regulation · Wnt/β-catenin signaling in development and cancer · Hedgehog Signaling Pathway Studies
Background
The driving forces for the evolution of organism complexity has been a topic of discussion for decades [1–4]. Despite genome duplications being renowned for the creation of new paralogous gene copies and their subsequent evolution via processes like sub- and neofunctionalisation [5], and specialisation [6], the G-value paradox showed that the number of genes in a genome do not necessarily correlate with organism complexity [2]. One of the proposed alternatives to solve this paradox is the expansion of the organism proteome through alternative splicing, correlating with phenotypic novelty [3]. Previous studies found a strong correlation between number of cell types (as a proxy for organism complexity) and alternative splicing [4, 7], providing evidence of the importance of isoform diversity for organism evolution. However, whether particular types of genes contribute disproportionately to this phenomenon has not been assessed.
Wnt signalling is a cell-to-cell signalling mechanism highly conserved in the animal kingdom and required during development and regeneration [8]. The best described Wnt pathway is the canonical Wnt (cWnt) pathway, also known as the Wnt/β-catenin pathway, which involves the nuclear translocation of β-catenin, triggered by extracellular Wnt ligand-receptor interactions. Nuclear β-catenin functions as a co-regulator for activation of Wnt-target genes, usually via binding the T-cell factor/lymphoid enhancer factor (TCF/LEF) proteins. The cWnt pathway has a variety of roles in animal homeostasis and development, including involvement in development of the anterior–posterior and dorsal–ventral axes [8, 9]. It is also associated with many human diseases such as cancers [10], diabetes [11] and mental disorders [12]. Comparably widespread functions in development, homeostasis and disease are also seen in other major signalling systems such as the hedgehog (Hh) and bone morphogenetic protein (BMP) pathways, whose main transcription factors are the Glioma-Associated Oncogene (GLI) proteins and the small/Mothers Against DPP Homolog (SMAD) proteins, respectively [13–15].
Genome comparisons between vertebrates and invertebrates reveal a remarkable conservation of the cWnt pathway with relatively little expansion of most of its components [16]. Nonetheless, vertebrate TCF/LEF transcription factors, the main transcription factor of the cWnt pathway, show a much greater diversity [17–20]. Multiple copies of TCF/LEF genes have been retained from genome duplications in vertebrates, which typically possess four TCF/LEF family genes with multiple isoforms, while invertebrates typically have one TCF gene with a single isoform [20, 21]. A similar gene expansion might have occurred for SMAD and GLI families of transcription factors mediating BMP/TGFβ and Hh signalling, respectively.
Given these general observations, we aimed to assess transcript isoform diversity of developmentally expressed genes across components of these signalling pathways (cWnt–TCF/LEF, BMP–SMAD, Hh–GLI) and compare them to other categories of genes. We hypothesised that such major developmental control genes may have been a particular target for the evolutionary diversification that occurred with the origin of the vertebrates. We selected three species representing key lineages of the Olfactores chordates; the invertebrate urochordate Ciona intestinalis, the cyclostome (jawless vertebrate) Lampetra planeri, and a gnathostome (jawed vertebrate) Xenopus tropicalis, to analyse in an unbiased way the number of genes and transcripts expressed during embryogenesis and assess if TCF/LEF, SMAD and GLI genes are distinctive in their transcript isoform diversity. Our use of de novo long-read sequencing data was focused specifically on selected developmental stages of the three chosen species to help overcome the difficulty in accurately and reliably determining splice isoforms from short-read sequencing data. Also, our approach allows us to determine which genes and isoforms are specifically deployed during development to improve the comparability of our data between species.
Results
Transcriptome analysis
To analyse the diversity of isoforms of developmentally transcribed genes within chordates, we performed cDNA long-read sequencing of developmental stages of C. intestinalis, L. planeri and X. tropicalis (see Table 1) and processed the data following the pipeline shown in Fig. 1. All selected stages performed similarly in the sequencing protocol (Table 1) producing de novo transcriptomes with loci coverage over 40% (Fig. 2A) and capturing over 60% of metazoan-conserved orthologues (BUSCOs) (Fig. 2D). Notably, the transcriptomes included over 10% of novel loci, with gene models not currently annotated in the respective reference genomes (Fig. 2B), although the highest proportion of transcripts were ones that fully matched reference models (categories ‘ = ’, ‘c’ and ‘k’ of Fig. 2C). Regarding the novel loci, the majority of the identified genes had no GO term associated with them (1110 out of 1359 for C. intestinalis, 3184 out of 3337 for L. planeri, and 2898 out of 3316 for X. tropicalis) (see the ‘Methods’ for GO analysis details). This suggests these novel loci that lack associated GO terms may be taxon-specific or rapidly evolving genes. After performing a GO enrichment analysis on the loci that did have associated GO terms, no GO terms were enriched for C. intestinalis or L. planeri. However, for X. tropicalis we found 209 GO terms significantly enriched (Additional File 1: Table S1), most of them linked to muscle- and heart-related functions, including muscle contraction, structural assembly, and development. Table 1. Long-read sequencing reads. Reads obtained after long-read sequencing and after data processing for each sample used. Ci: Ciona intestinalis; Lp: Lampetra planeri; Xt: Xenopus tropicalis; St: developmental stageStageDev processInput readsClean readsMin. lengthAvg. lengthMax. lengthSum. lengthCi_St04Cleavage1,466,765574,1752005124385293,959,329Xt_St06Cleavage1,615,3861,374,219200897.854741,233,804,871Ci_St12Gastrulation2,807,1912,156,039200891.275271,921,535,475Xt_St10Gastrulation2,876,0702,277,830200626.738511,427,433,920Ci_St15Neurulation860,144610,643200515.43441314,711,689Ci_St16Neurulation1,378,599839,501200668.83560561,488,108Xt_St16Neurulation1,436,0051,258,985200803.840491,011,971,517Xt_St20Neurulation2,435,8882,048,749200704.844831,443,978,930Lp_St22Post-neurulation985,970730,948200680.35565497,288,356Ci_St21Cell Diff3,526,2322,724,082200647.332301,763,334,732Ci_St26Cell Diff2,601,1331,913,539200566.543361,083,927,850Lp_St25Organogenesis7,505,5494,919,531200536.848122,640,918,572Lp_St28Organogenesis5,515,5523,719,539200534.15,2871,986,704,869Xt_St28Organogenesis1,871,4771,424,131200555.64628791,301,969Xt_St35Organogenesis2,506,7331,541,432200440.92996679,623,175Fig. 1Pipeline for long-read data processing. Round boxes: files; square boxes: software programmes. Blue boxes: obtained files; yellow boxes: reference files; green box: final transcriptome file; light-grey boxes: software for processing data; dark-grey boxes: software for evaluating quality of obtained transcriptome fileFig. 2Transcriptome quality assessments. A Covered (blue) and missed (grey) exons/intron/loci for each species data set. B Novel exon (blue), intron (yellow), and loci (green) for each species data set. C Pie plots showing the distribution of transcript-matching types according to gffcompare categories: = (light-blue), identical reference-query match; c (orange), complete query match within reference; k (grey), complete reference match within query; j (yellow), some splice site mismatch (potential new isoform); o (dark-blue), partial overlapping match; u (green), no match of query within reference (novel); Other (brown), other types of query-reference matches including m (all introns retained), n (some introns retained), e (single exon match), s (intron match on opposite strand), x (exon match on opposite strand), i (contained within reference intron), y (reference contained within intron), p (possible polymerase run-on), and r (repeat). D Histogram showing the amount of evolutionary conserved orthologues (BUSCOs) found, as single-copy (light blue), duplicated (dark blue) or fragmented (grey), and missing (yellow)
The transcript:gene ratio (t/g ratio) was calculated for the total number of expressed genes and transcripts obtained for each transcriptome, as well as for subsets of particular gene categories (Table 2). We observed a higher number of different transcripts per expressed gene in the vertebrates relative to the invertebrate Ciona only for TCF/LEF genes (TCFs), SMADs and GLIs (Fig. 3A). Comparisons of the variance of t/g ratio observed on each subset showed that TCFs had a greater variance than most of the other subsets studied (p-value < 0.1, Additional File 1: Tables S2–5), including the subset ‘Wnt signalling pathway’ (GO:0016055) and the SOX genes, which belong to the same HMG-box superfamily as the TCF/LEFs. Moreover, a similar pattern was found for SMAD and GLI genes. However, after multiple-test correction, none of these comparisons remained significant (Additional File 1: Table S2). To further assess whether the increase in transcripts observed for these gene families was different from that observed for the other categories, we performed linear regressions for each subset and calculated the regression coefficient (β1 or slope, Fig. 3B, Additional File 1: Tables S6–8), excluding the t/g ratio of the target gene families from the t/g ratio calculations on the other categories (i.e. All, Over1, Emb. Dev., Wnt path., BMP path., Hh path., and TF, Additional File 1: Table S2). A linear regression model including all individual subsets revealed that the interaction term of GLIs (cell_type_num:SubsetGLIs) and TCFs (cell_type_num:SubsetTCFs) showed significance (p-value < 0.01 and p-value < 0.1, respectively, Additional File 1: Table S6), indicating that the regression coefficient observed for those subsets differed from the reference subset (All). Table 2. Total number of genes and transcripts for each transcriptome and subsets. All: the whole transcriptome; Over 1: only genes with more than one transcript; Emb. Dev.: genes with the GO term ‘Embryo Development’ (GO:0009790); Wnt Path.: genes with the GO term ‘Wnt Pathway’ (GO:0016055); BMP Path.: genes with the GO term ‘BMP signalling pathway’ (GO:0008101 or GO:0030509); Hh Path.: genes with the GO term ‘smoothened signalling pathway’ (GO:0007224); TF: genes with the GO term ‘DNA-binding transcription factor activity’ (GO:0003700); SOXs: SOX genes; TCFs: TCF and TCF/LEF genes; SMADs: SMAD genes; GLIs: GLI genesCiona intestinalisLampetra planeriXenopus tropicalisGenesTranscriptsRatio t/gGenesTranscriptsRatio t/gGenesTranscriptsRatio t/g****All12,71720,1831.5914,31117,9881.2620,77530,4291.46Over 1386811,1712.89223558602.62543115,1052.78Emb. Dev15221.4714191.36691061.54Wnt Path40581.4529331.14891341.51BMP Path54861.5937451.2263941.49Hh Path49901.8443551.2849821.67TF2964811.631301671.2875012351.65SOXs571.40351.679141.56TCFs111.00122.00492.25SMADs561.20341.337121.71GLIs111.00111.00133.00Fig. 3Transcript:gene ratio. A Histogram of the transcript:gene ratios (t/g ratio) for each species (blue: Ciona intestinalis; grey: Lampetra planeri; yellow: Xenopus tropicalis) and category (All: whole transcriptome; Over 1: genes with more than one transcript; Emb. Dev: genes with the GO term ‘Embryo Development’ (GO:0009790); Wnt path.: genes with the GO term ‘Wnt signalling pathway’ (GO:0016055); BMP path.: genes with the GO term ‘BMP signalling pathway’ (GO:0008101 or GO:0030509); Hh path.: genes with the GO term ‘smoothened signalling pathway’ (GO:0007224); SOXs: SOX genes; TF: genes with the GO term ‘DNA-binding transcription factor activity’ (GO:0003700); TCFs: TCF and TCF/LEF genes; SMADs: SMAD genes; GLIs: GLI genes). B Linear regressions of each subset studied (dotted lines) and for the two groups used for the Mann–Whitney U test (solid lines): ‘Other categories’, encompassing All, Emb. Dev., Wnt path., BMP path., Hh path., TF and SOXs (grey line), and ‘TCFs + SMADs + GLIs’, encompassing those three gene families (green line). The t/g ratio is plotted against the cell type number in development for each species, according to Cao et al*.^46^ for Ciona, Pang et al.*^47^ for lamprey, and Liao et al.^48^ for Xenopus. Dots: Transcript:Gene ratio values. Dot outline: belonging to group, ‘TCFs + SMADs + GLIs’ (green) or ‘Other categories’ (grey). β_1_: regression coefficient
Next, we performed separate linear regression models for each gene family (TCFs, SMADs, GLIs and SOXs), grouping the remaining subset to increase statistical power. We excluded the Over1 subset, as its high mean increased the regression error, and the pathways subsets not related with the specific gene family, except for SOXs (i.e. TCFs groups: TCFs and All + Emb.Dev. + Wnt path. + TF + SOXs; SMADs groups: SMADs and All + Emb.Dev. + BMP path. + TF + SOXs; GLIs groups: GLIs and All + Emb.Dev. + Hh path. + TF + SOXs; SOXs groups: SOXs and All + Emb.Dev. + Wnt path. + BMP path. + Hh path. + TF). The interaction terms showed that TCFs, SMADs, and GLIs had a significantly different regression coefficient compared to the grouped subsets (TCFs p < 0.01; SMADs p < 0.1; GLIs p < 0.001, see Additional File 1: Table S7) whereas SOXs showed no significance (p-value > 0.1; Additional File 1: Table S7). This reaffirmed the previously observed pattern for GLIs and TCFs and extended it to SMADs.
Finally, we performed a linear regression model grouping TCFs, SMADs, and GLIs together as target group, and the remaining subsets (i.e. All, Emb. Dev., Wnt path., BMP path., Hh path., TF and SOXs) as comparison group. The regression coefficient observed for the target group was significantly higher than the one observed for the comparison group (Fig. 3B, Shapiro–Wilk test p-values > 0.5; Bartlett test p-value < 0.001; Mann–Whitney U test: p-value < 0.05, Additional File 1: Table S8).
All together, these results indicate that these key developmental transcription factors (TCF/LEFs, SMADs, and GLIs) have a distinctive pattern of a higher number of different transcripts per expressed gene in the vertebrates relative to the invertebrate Ciona: in our analysis (summarised in Table 2), TCF/LEFs have 1 gene and 1 transcript in C. intestinalis compared to 1 gene and 2 transcripts in L. planeri and 4 genes and 9 transcripts in X. tropicalis; SMADs have 5 genes and 6 transcripts in C. intestinalis compared to 3 genes and 4 transcripts in L. planeri and 7 genes and 12 transcripts in X. tropicalis; and GLIs have 1 gene and 1 transcript in C. intestinalis compared to 1 gene and 1 transcript in L. planeri and 1 gene and 3 transcripts in X. tropicalis (DNA and Protein sequences available in Additional Data 1–6). Interestingly, the variance observed in the t/g ratio for these three gene families (TCF/LEFs, SMADs, and GLIs) was not significantly different between each of them (padj = 1, Additional File 1: Table S2), indicating that they show similar distributions of transcript isoforms per expressed gene within the three chordate groups. Alongside the linear regression modelling that demonstrates a significant increase in t/g ratios of the developmentally expressed genes in the TCF/LEF, GLI and SMAD families in the two vertebrates relative to the invertebrate Ciona, this demonstrates a distinct characteristic of these families relative to other genes found in our transcriptome data.
A new splice isoform in Ciona intestinalis
To confirm the transcript sequence and structure of the C. intestinalis TCF/LEF (in what was formerly known as Ciona intestinalis Type B) relative to the commonly studied sister species Ciona robusta (formerly Ciona intestinalis type A), we performed RACE-PCR in different stages of development, selected according to the previously described expression of C. intestinalis TCF (CiTCF) [22]. 5′RACE-PCR was performed in St04 (8-cell; maternal mRNA) and St12 (mid-Gastrula; zygotic mRNA), and 3′RACE-PCR was performed for St04, St12, St16 (late Neurula), and St21 (mid-Tailbud I).
For 5′RACE-PCR, only one fragment was amplified, matching the described gene model. For 3′RACE-PCR two different 3′ ends were found. The first was found in all the assessed stages and matched the previously described gene model. The second, smaller in size, was found in St16 and matched the described gene model but with a different final exon. Further analysis of the genomic region between exon 12 and exon 13 in C. intestinalis (intron 12; Fig. 4A) showed the presence of this new exon flanked by two transposable elements, partially overlapping one at the 3′ end. These transposable elements matched in sequence the previously described miniature inverted-repeat transposable elements (MITE) Cimi-1 [23]. Comparison of intron 12 between C. robusta and C. intestinalis revealed that despite the Cimi-1 insertions being conserved, this was not the case for the splice acceptor site nor the stop codon of exon 12.5 (Fig. 4B), indicating that this newly discovered exon may be specific to C. intestinalis. To confirm this alternative C-terminus, we designed a specific Reverse primer for exon 12.5 and performed RT-PCRs on St12, St15 (mid-Neurula) and St21. This isoform was found only in post-gastrulation stages. C. intestinalis thus produces two isoforms of TCF/LEF, in contrast to the single isoform produced by this gene in C. robusta.Fig. 4. Schematic of CiTCF intron 12. A Schematic of the C. intestinalis genomic region where exon 12.5 is found. B DNA alignment of TCF intron 12 of C. intestinalis and C. robusta. C. intestinalis (R): sequence from Roscoff reference genome (GCA_018327825.1); C. intestinalis (P): sequence from Plymouth reference genome (GCA_018327805.1); dark blue: annotated exons; light blue: new exon (exon 12.5); yellow: Cimi-1-like sequences; red boxes: acceptor site and stop codon of exon 12.5
Discussion
Our transcriptome analyses focused on gene expression during embryo development and organogenesis revealed that TCF/LEF, SMAD and GLI genes exhibit a distinctive pattern of higher numbers of splice isoforms per developmentally expressed gene in vertebrates than the representative from the closest invertebrate sister group, represented here by the urochordate C. intestinalis. This larger number of splice isoforms occurs in addition to the increase in paralogue numbers in these transcription factors at the origin of vertebrates.
Our previous in silico analyses identified an increase in TCF/LEF gene number encoded in the genome at the invertebrate-to-vertebrate transition, likely via the whole genome duplications that occurred early in vertebrate evolution, and in addition suggested there was an increase in isoform diversity in this gene family [21]. However, this diversity remained to be quantified. It also remained to be determined as to when these isoforms are expressed during development and hence are presumably functional. This analysis is provided here. Another important question was whether the evolutionary patterns seen in this major transcriptional effector of the cWnt signalling pathway were unique, or also occurred elsewhere, especially in other major developmental signalling pathways like Hh and BMP/TGFβ.
Invertebrates typically have four SMADs, corresponding to a single-copy of each SMAD subgrouping (common SMAD (Co-SMAD), inhibitory SMAD (I-SMAD), BMP-regulated receptor SMAD (R-SMAD) and TGFβ-regulated R-SMAD). However, Ciona has independently duplicated the TGFβ-regulated R-SMAD [24], giving a total of five SMADs in this tunicate. Meanwhile vertebrates usually possess eight different SMADs (one Co-SMAD, two I-SMADs, three BMP-regulated R-SMADs, and 2 TGFβ-regulated R-SMADs) [25, 26]. In the GLI family, invertebrates have a single GLI gene while vertebrates typically have three paralogues [27]. Thus, the SMAD and GLI families show a similar pattern of increased paralogue numbers encoded by the genome to that seen in the TCF/LEF family. However, the amount of developmentally expressed splice isoform diversity remained to be analysed for both SMAD and GLI families. Our data demonstrate that these families, when analysed by linear regression modelling against numbers of cell types in these chordates, show a similar pattern to the TCF/LEF family, with a significantly higher number of isoforms per developmentally expressed gene in the vertebrates we studied relative to the invertebrate sister group.
It is striking that this invertebrate-to-vertebrate pattern for the TCF/LEF, SMAD and GLI genes is significantly different from other developmentally expressed genes and their transcripts found in our new transcriptomes (‘All’ category in Fig. 3). This is also the case when we focus on genes that demonstrably exhibit alternative splicing (that is, have more than one transcript per gene: the ‘Over 1’ category in Fig. 3), in which the C. intestinalis ratio is indistinguishable from those of the two vertebrates. Thus, there is not simply a general increase in isoform diversity in developmentally expressed genes at the invertebrate-to-vertebrate transition. Since these first two categories encompass genes that span a variety of biological functions, we also focused on genes thought to be more specifically involved in embryo development, in case there is a general increase in complexity of developmental control genes associated with the invertebrate-to-vertebrate transition and the evolution of vertebrate complexity. No distinct pattern was observed between the invertebrate C. intestinalis and the vertebrates. This lack of invertebrate to vertebrate distinction was also observed when the focus was even more specific, onto Wnt pathways as a whole (Fig. 3). Another alternative possibility was explored by comparison to Transcription Factors in general (‘TF’ in Fig. 3) in case the mediators of transcriptional control are the focus of change between invertebrates and vertebrates. No significant distinction was found. As a final test of how distinct the pattern found for the TCF/LEF family was, we analysed the SOX genes, since these are in the same superfamily as the TCF/LEF genes and hence act as the closest comparison possible. The invertebrate-to-vertebrate pattern for the TCF/LEF genes is significantly different to that of the SOX genes. Thus, the TCF/LEF genes stand-out from all of these different categories of genes, implying a specific expansion in the splice isoform diversity focused on these transcription factor mediators of the cWnt pathway. Notably, the only categories of genes that we found with comparable invertebrate-to-vertebrate patterns were those of the transcription factor mediators of other major intercellular signalling pathways (the SMAD and GLI genes).
Amongst all of this vertebrate genetic diversity, it has been shown that vertebrate TCF/LEF paralogues and GLI paralogues have some degree of redundancy at the functional level [17, 28]. Nevertheless, there is also evidence that different TCF/LEF isoforms can target different genes [29], showing both sub- and neo-functionalisation. Similarly, GLI isoforms have been shown to have opposing roles activating or repressing the gene expression of their specific target genes [28]. Therefore, the diversity of vertebrate genes in TCF/LEF, SMAD and GLI families, and the isoforms produced from them, presumably reflects a wide array of functional capabilities downstream of important developmental signalling pathways in vertebrates.
These three gene families are the main transcription factor effectors of major intercellular signalling pathways (cWnt, BMP/TGFβ and Hh, respectively), which are integral to embryo development, organogenesis and homeostasis. Their major roles in development in conjunction with the correlation of isoform diversity with organism complexity [1–4] is consistent with the hypothesis that increased diversity of these transcription factors may be making a disproportionate contribution to the evolution of vertebrate complexity relative to invertebrates. Interestingly, previous studies had observed genes resulting from duplication usually retain lower numbers of isoforms, with duplication and isoform diversity being inversely correlated evolutionary patterns [30, 31]. This makes the pattern observed here in these developmental signalling transcription factor effectors even more striking, as our data shows that TCF/LEF, SMAD and GLI genes are exceptions to this inverse correlation. This could be an indicator of a significant role for isoform diversity of these key transcription factors in the evolutionary origins and diversification of vertebrate complexity.
One caveat to this hypothesis is whether the species selected here are good representatives of the invertebrate-to-vertebrate transition. C. intestinalis, for example, was selected because it is a urochordate and as such is a member of the closest invertebrate clade to the vertebrates, and is also accessible and amenable to gene expression and developmental experimentation. There are, however, aspects of its genome organisation and content that are relatively derived within the chordates [32]. Also, it is known that amphioxus exhibits alternative splicing from its Gli gene, producing two distinct isoforms [33], rather than the single isoform of Ciona GLI that was found here. It is also notable that our analyses are focused on the transcripts found within our new transcriptome data. While this enhances comparability between the different species, we are not necessarily capturing all isoforms produced by each of the three species selected. Rare transcripts expressed at very low levels in embryogenesis, or transcripts expressed only in adult stages, will not be present in our data. These are areas for future further work, to quantify the patterns described here with even greater precision. Nevertheless, there is no indication that the three transcription factor families focused on here are unusual in Ciona relative to invertebrates in general in any major way, but this is also an area for further scrutiny in the future, particularly as additional high-quality genome assemblies and more long-read transcriptome data becomes available.
In addition to these ‘signalling transcription factor’ findings, the long-read transcriptomes provided in this work are also a valuable resource for deeper understanding of gene expression during embryo development of different chordates, including species not previously assessed with long-read transcriptome sequencing, such as Cyclostomata and Urochordata. However, despite all the samples being processed in the same way and our obtaining similar quality values within urochordate and gnathostome data sets, the quality of the cyclostome data set was not as good (Fig. 2). This issue could be due to the GC-richness of cyclostome genomes [34] and/or the fact that L. planeri (the species sampled) and P. marinus (the species used as the lamprey reference genome) are more evolutionarily distant and distinct than the species used for urochordates (samples of C. intestinalis and reference genome of C. robusta) and gnathostomes (samples and reference genome of X. tropicalis).
It is also notable that for C. intestinalis, the transcript type category that had the highest number of transcripts was ‘j’ (40%, Fig. 2C), showing that most of the transcripts had mismatched splicing sites (junctions) against reference annotations. This could be an indicator of potential novel isoforms found in this new C. intestinalis transcriptome data for previously annotated genes in C. robusta. In fact, our finding of an alternative transcript of CiTCF is the first evidence that C. intestinalis has more than one TCF isoform. However, this second transcript of CiTCF was only found by RACE-PCR rather than being in the transcriptome data, which may reflect the RACE-PCR having higher sensitivity than cDNA long-molecule sequencing, since the PCR is gene-specific. In addition, the partial overlap of exon 12.5 with the Cimi-1 MITE sequence provides an example of how transposable elements can alter intronic sequences that then provide material for the evolutionary origin of novel exons, in this case in concert with point mutations that generated a new splice acceptor site as well as a new stop codon.
Conclusions
We have created de novo transcriptomes of embryo development for three different chordates: C. intestinalis (Urochordata), L. planeri (Cyclostomata) and X. tropicalis (Gnathostomata). Our analyses demonstrate distinctive increases in isoform diversity at the invertebrate-to-vertebrate transition specifically among transcription factor effectors of key intercellular signalling pathways that drive cell type diversity. This distinctive change focused on these specific gene families (TCF/LEF, SMAD and GLI) goes beyond the previous observations of a general correlation between increased isoform diversity and evolution of animal complexity. This demonstrates likely disproportionate roles for these specific transcription factor families in the evolution of vertebrate complexity, which needs to be explored with future functional assays of these various isoforms.
Methods
Material fixation and RNA extraction
After in vitro fertilisation, selected embryological stages from C. intestinalis, L. planeri and X. tropicalis were fixed in RNAlater™ (Invitrogen, AM7021) for a minimum of 16 h at 4 °C, taking care that the amount of RNAlater™ was at least 10 times the volume of the sample. Stage numbering was done according to Hotta [35], Tahara [36] and Zahn [37]. RNA extractions were performed with ‘RNAeasy mini kit’ (QIAGEN, 74,104) following the manufacturer’s protocol. The quality and quantity of the total RNA obtained was tested by gel electrophoresis and Nanodrop spectrophotometer.
cDNA long-read sequencing
For each sample analysed, 50 ng of total RNA was processed using the PCR-cDNA Barcoding Kit (Oxford Nanopore Technologies (ONT), SQK-PCB109). The first strand synthesis was performed following the manufacturer’s instructions (Thermo Scientific Maxima H Minus First Strand cDNA Synthesis Kit with dsDNase, K1681). First, a previous DNAse treatment of the total RNA was performed as follows: incubation of 10 min at 37 °C followed by an inactivation of 5 min at 55 °C in the presence of 10 mM of DTT. After, the sample was cooled on ice and VN Primers and dNTPs where added. After mixing, the sample was incubated 5 min at 65 °C and snap cooled on a pre-chilled freezer block. Then, 5xRT buffer, Strand-Switching Primers and Maxima H Minus Enzyme Mix were added and the sample was mixed by pipetting. The reverse transcription (RT) reaction was performed by incubating the sample 10 min at 25 °C followed by 92 min at 42 °C and 5 min at 85 °C.
A single PCR reaction was performed for each RT reaction. The PCR reaction was prepared according to the PCR-cDNA Barcoding Kit protocol with minor modifications in the cycling conditions: initial denaturation at 95 °C for 30 s; 18 cycles of denaturation at 95 °C for 10 s, annealing at 62 °C for 20 s, extension at 65 °C for 2 min 30 s; final extension of 65 °C for 10 min and hold at 4 °C. Each reaction was treated with Exonuclease I (New England Biolabs, M0293) followed by a purification with AMPure XP beads (Beckman Coulter, A63880) as indicated in the PCR-cDNA Barcoding Kit protocol with minor modification (i.e. we used 30 µL of AMPure XP beads per PCR reaction). The concentration and quality of the obtained samples were assayed by Nanodrop and gel electrophoresis. The sequencing was performed with a maximum of 100 fmol per run.
MinION flow cells (ONT, FLO-MIN106D) underwent flow cell check prior to library construction. The barcoded PCR-cDNA libraries were prepared for sequencing and the MinION flow cell was primed using the flow cell priming kit (ONT, EXP-FLP002) as indicated in the PCR-cDNA Barcoding Kit protocol. A maximum of six PCR-cDNA libraries per run were sequenced in parallel on a single MinION flow cell with Min-KNOWN software v.21.02.2 (ONT). Fast basecalling was performed in real-time with a maximum data acquisition time of 48 h and the following filters applied: minimum Barcode score of 60 and minimum Qscore of 7. All the raw data produced is available at the Sequence Read Archive (SRA) database under accession numbers SRR24756885-SRR24756899, BioProject PRJNA977127.
Transcriptomic data processing
The cDNA ONT reads were pre-processed with pychopper (ONT), to remove the primer sequences introduced by the protocol, and with SeqKit [38], to remove sequences under 200 bp length. Each cDNA ONT library for each developmental stage sequenced was aligned to the corresponding reference genome by minimap2 [39] (C. intestinalis reads aligned against Ciona robusta genome (GCA_000224145.2 [40]); L. planeri reads aligned against Petromyzon marinus genome (GCA_010993605.1 [41]); X. tropicalis reads aligned against X. tropicalis genome (GCA_000004195.3 [42])), transcripts refined with TranscriptClean [43] and annotated with StringTie2 [44] software. Finally, the stage-specific annotations were merged into a general annotation file for each species with StringTie2 ‘-merge’ option and reference transcriptome and proteome dataset were generated using TransDecoder [45]. The obtained proteome datasets and general annotation file were analysed with BUSCO [46] (v5.2.2) and gffcompare [47], respectively, to assess the quality of the transcriptomes. For obtaining the GO annotations, the InterPro Scan option of Blast2GO software (v.6.0.3) and the EggNOG-mapper tool [48] were run using each transcriptome dataset as input.
Statistical analysis
The GO enrichment analysis was done separately for each species. The analysis was performed in R using the function ‘enricher()’ from the ‘clusterProfiler’ package providing as inputs the list of ‘u’ genes and the GOs and genes found in the whole transcriptome.
For each species dataset, the ratio transcript:gene (t/g ratio) for developmentally expressed genes was calculated for all the genes present in the created transcriptome (All), genes that had more than 1 transcript (Over 1), genes with the gene ontology numbers GO:0009790 (Embryo Development, Emb. Dev.), GO:0016055 (Wnt signalling pathway, Wnt path.), GO:0008101 or GO:0030509 (BMP signalling pathway, BMP path.), GO:0007224 (smoothened signalling pathway, Hh path.) and GO:0003700 (DNA-binding transcription factor activity, TF), and for the gene families SOXs, TCFs, SMADs and GLIs. For the target gene families a BLASTN against the raw reads data was done to ensure isoform detection. We performed F-tests (or Bartlett’s test when data not normal by Shapiro Wilk test) to compare the variances of t/g ratios within the different subsets (i.e. All, Over 1, Emb. Dev., Wnt path., BMP path., Hh path., TF, SOXs, TCFs, SMADs and GLIs) doing pairwise comparisons and Bonferroni correction for multiple-test comparisons (Additional File 1: Table S2). A difference in the variance was expected when the t/g ratio was noticeably different within species. The regression coefficient (β_1_) for each subset was estimated using a linear regression model with t/g ratio values and species complexity defined as the number of cell types detected by single-cell RNAseq in larva/organogenesis stage (C. intestinalis [49]: 60; L. planeri [50]: 70; X. tropicalis [51]: 106). Finally, a Mann–Whitney U test was applied to evaluate differences in regression coefficients between groups. In all cases, data normality was assessed by Shapiro–Wilk tests (see Additional File 1: Tables S2 and S8).
RACE-PCR, cloning and sequencing
Total RNA of C. intestinalis was used for 3′RACE and 5′RACE experiments using FirstChoice™ RLM-RACE Kit (Invitrogen, AM1700) following the manufacturer’s protocol and with the following CiTCF-specific primers: 5′-CAGGCATGTTACGATACCCATATCCA-3′ (3′RACE), 5′-CATCACAATTTACATCCACATCTGGTGGT-3′ (5′RACE), 5′-CTTCACATATGGCCGACTTGGTTTGTCACCT-3′ (nested 3′RACE) and 5′-TCGCGTTTCTTTGAACCAGGTTCAG-3′ (nested 5′RACE). PCRs were performed with Taq DNA polymerase (Thermo Scientific, EP0402) following the manufacturer’s protocol and results were assessed by gel electrophoresis in 1% agarose gels.
The individual bands obtained after nested RACE-PCR were purified with the ISOLATE II PCR and Gel Kit (Meridian Bioscience, BIO-52059), and cloned with the pGEM®-T Easy Vector System (Promega, A1360), following the manufacturer’s protocol. Transformation was performed into E. coli competent cells (Agilent, XL10-Gold Ultracompetent cells, 200,314) by heat-shock. All clones were selected by Ampicillin resistance and their composition was confirmed by enzyme digestion with NotI (New England Biolabs, R0189) and Sanger sequencing (Oxford Zoology service, Eurofins service). The sequences were compared against C. intestinalis genomic sequences from Roscoff reference genome (GCA_018327825.1 [52]) and from Plymouth reference genome (GCA_018327805.1 [53]).
The intronic region within exon 12 and exon 13 of C. intestinalis TCF was amplified with the following primer pair: 5′-TCGCACGATAATGTTAACAAGC-3′ (forward primer), 5′-GTTCATAGCTACTTGATGGTTGGA-3′ (reverse primer). Specific exon 12.5 PCRs were done with the following primer pair: 5′-ACAACAGCAATTATGGTGCGCAC-3′ (forward primer), 5′- ATACCCCGACGAGGACAAC-3′ (reverse primer). The protocols for PCR and posterior cloning were as described above.
Supplementary Information
Additional file 1: Tables S1-8. Table S1. GO terms enriched in the novel loci found in our transcriptomic data of Xenopus tropicalis. Table S2. P-values of F-test or Bartlett's tests performed on each group, according to the Shapiro–Wilk test p-values. Table S3. Gffcompare results of X. tropicalis transcriptome, including the GO terms found for each gene ID (qry_gene_id). Table S4. Gffcompare results of L. planeri transcriptome, including the GO terms found for each gene ID (qry_gene_id). Table S5. Gffcompare results of C. intestinalis transcriptome, including the GO terms found for each gene ID (qry_gene_id). Table S6. Linear regression model with individual subsets. The subset 'All' is used as reference for the p-value calculations. Table S7. Linear regression model summaries for each studied subset. Table S8. Regression coefficients obtained from each linear regression performed. Data normality assessed with Shapiro–Wilk test, data homogeneity assessed with Bartlett's test, difference of means assessed with Mann–Whitney U Test. SD: standard deviation.Additional file 2. Data 1–6. DNA and protein sequences for the TCF/LEF, GLI, and SMAD families found in the transcriptomes reported here.
The reference list from the paper itself. Each links out to its DOI / PubMed record.
- 1Akiyama T, Raftery LA, Wharton KA. Bone morphogenetic protein signaling: the pathway and its regulation. Genetics. 2023;226:iyad 200. 10.1093/genetics/iyad 200.10.1093/genetics/iyad 200PMC 1084772538124338 · doi ↗ · pubmed ↗
- 2Torres‐Aguila NP, Salonna M, Hoppler S, Ferrier DEK. Evolutionary diversification of the canonical Wnt signaling effector TCF/LEF in chordates. Dev Growth Differ. 2022;64:120–137. 10.1111/dgd.12771.10.1111/dgd.12771 PMC 930352435048372 · doi ↗ · pubmed ↗
- 3Weise A, Bruser K, Elfert S, Wallmen B, Wittel Y, Wohrle S, Hecht A. Alternative splicing of Tcf 7l 2 transcripts generates protein variants with differential promoter-binding and transcriptional activation properties at Wnt/beta-catenin targets. Nucleic Acid Res 2010;38:1964–1981. 10.1093/nar/gkp 1197.10.1093/nar/gkp 1197 PMC 284724820044351 · doi ↗ · pubmed ↗
- 4Department of Zoology, Graduate School of Science, Kyoto University. Ciona intestinalis KH genome assembly (GCA_000224145.2). NCBI Datasets. 2013. https://identifiers.org/ncbi/assembly:GCA_000224145.2.
- 5Vertebrate Genomes Project. Petromyzon marinus (k Pet Mar 1) genome assembly. NCBI Datasets. 2020. https://identifiers.org/ncbi/assembly:GCA_010993605.1.
- 6DOE Joint Genome Institute. Xenopus tropicalis (Xenopus_tropicalis_v 9.1) genome assembly (GCA_000004195.3). NCBI Datasets. 2016. https://identifiers.org/ncbi/assembly:GCA_000004195.3.
- 7Haas BJ. Trans D Ecoder. https://github.com/Trans Decoder/Trans Decoder.
- 8Marine Genomics Unit, Okinawa Institute of Science and Technology. Ciona intestinalis (Cint(type B-Roscoff)_1.0) genome assembly. NCBI Datasets. 2021. https://identifiers.org/ncbi/assembly:GCA_018327825.1.