Prevention of Cholestatic Liver Disease Through BCL6-FXR Enterohepatic Crosstalk
Ellen Fruzyna, Meredith A. Sommars, Yasu Omura, Kristine M. Yarnoff, Janice C. Wang, Christopher R. Futtner, Richard M. Green, Grant D. Barish

TL;DR
This study reveals that BCL6 works with FXR to regulate bile acid levels and prevent liver damage from bile acid overload.
Contribution
BCL6 is identified as a novel regulator of bile acid metabolism that interacts with FXR to maintain liver health.
Findings
BCL6 suppresses bile acid synthesis and activates FGFR4 to regulate Cyp7a1 repression.
BCL6 induces NTCP to enhance bile acid reuptake, maintaining bile acid homeostasis.
Combined loss of BCL6 and FXR leads to severe bile acid accumulation and liver toxicity.
Abstract
Bile acid (BA) metabolism must be tightly regulated because BAs serve as metabolic signaling molecules but become cytotoxic at high levels. The farnesoid X receptor (FXR) is a crucial BA sensor, yet our understanding of its regulation and coordination with other transcription factors is limited. Here, we investigated the role of B-cell lymphoma 6 (BCL6) in regulating BA levels and how it coordinates with FXR to protect from BA overload. We quantified cholesterol, BA levels, expression of key BA regulators, and hepatic damage markers in genetic mouse models with hepatic deletion of Bcl6 (Bcl6LKO), global deletion of Fxr (FxrKO), or combined loss of both factors. We identified an epigenomic link between BCL6- and FXR-regulated gene networks. BCL6 regulated BA homeostasis through multiple mechanisms, including suppression of BA synthesis, activation of fibroblast growth factor receptor 4…
Genes, proteins, chemicals, diseases, species, mutations and cell lines named across the full text — each resolved to its canonical identifier and authoritative record.
Click any figure to enlarge with its caption.
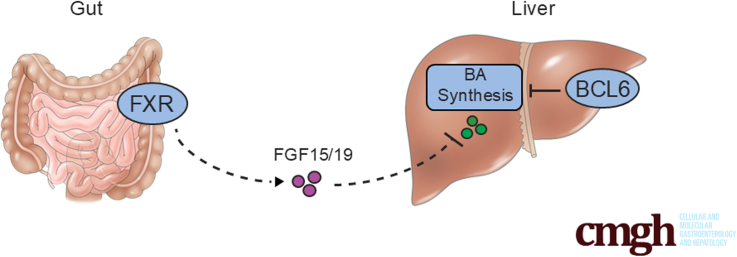 Figure 1
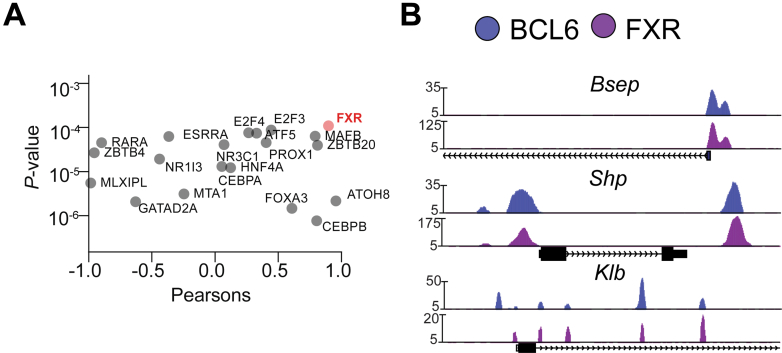 Figure 2
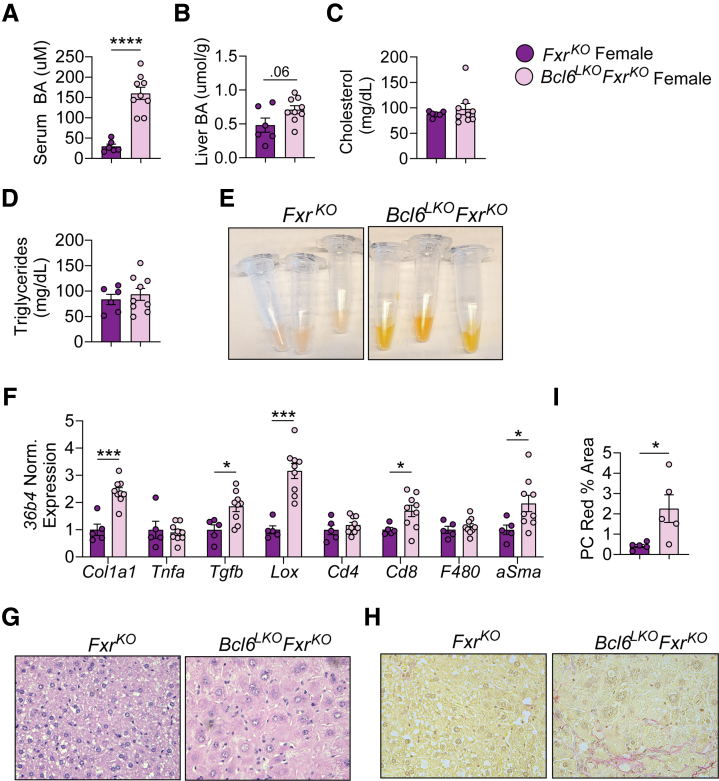 Figure 3
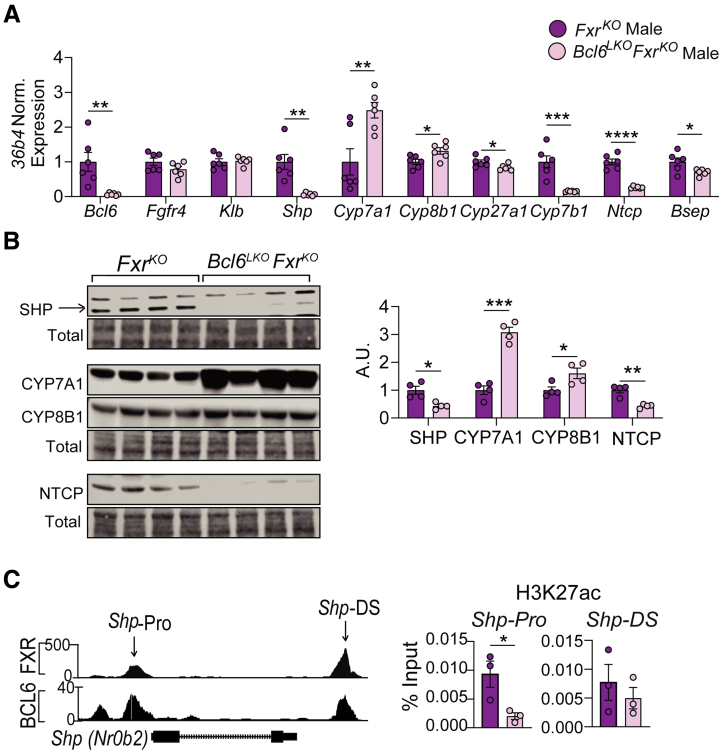 Figure 4
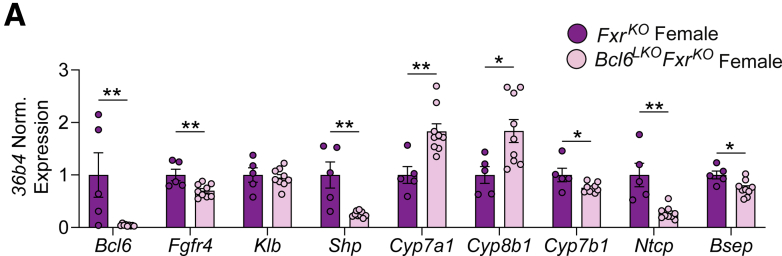 Figure 5
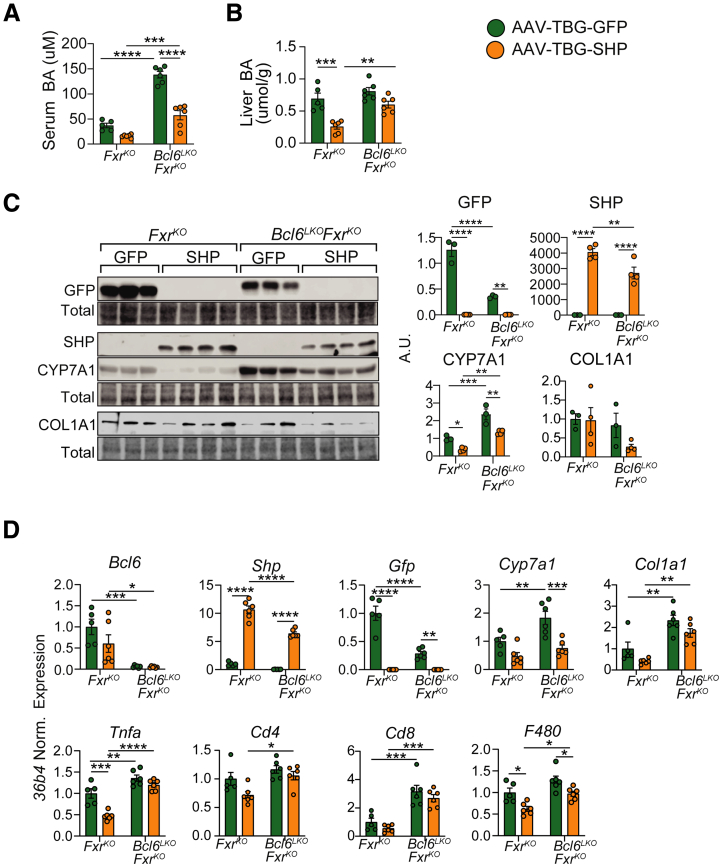 Figure 6
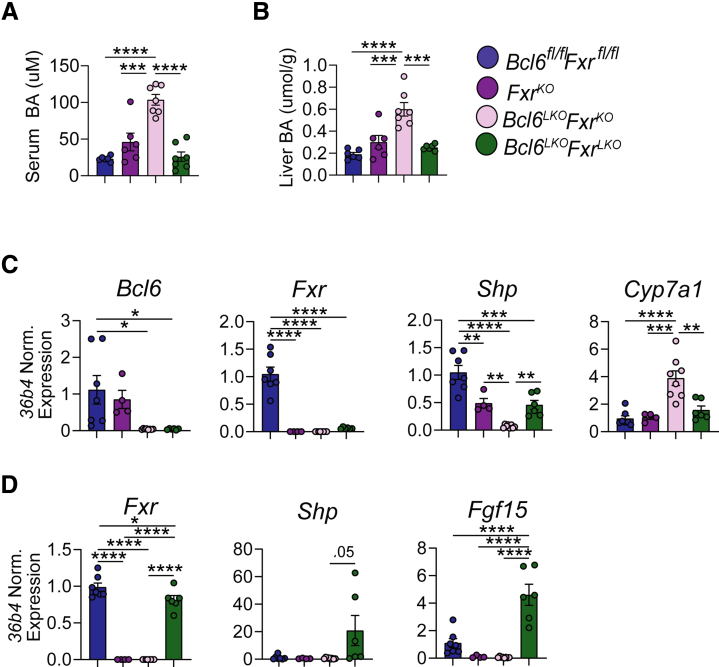 Figure 7
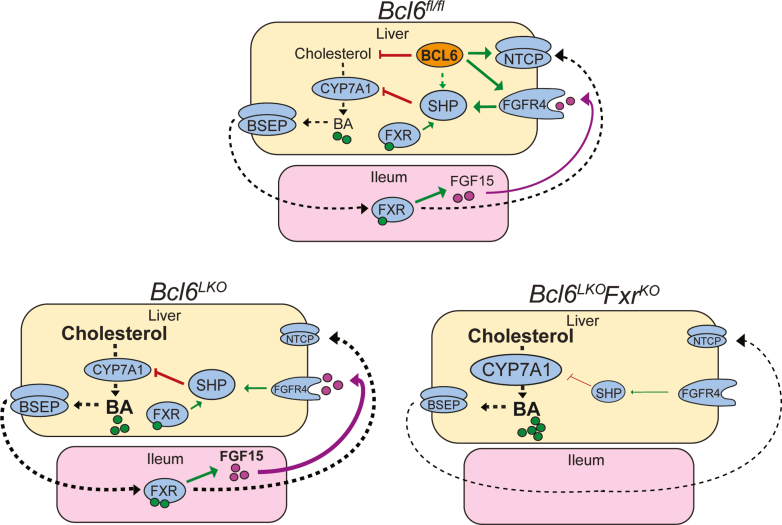 Figure 8
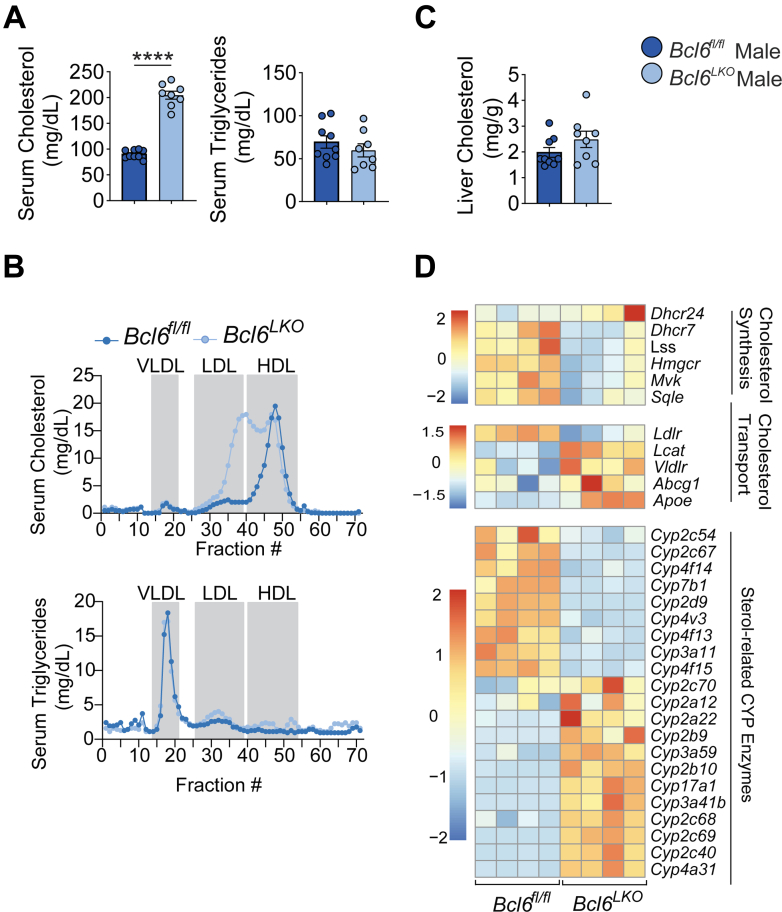 Figure 9
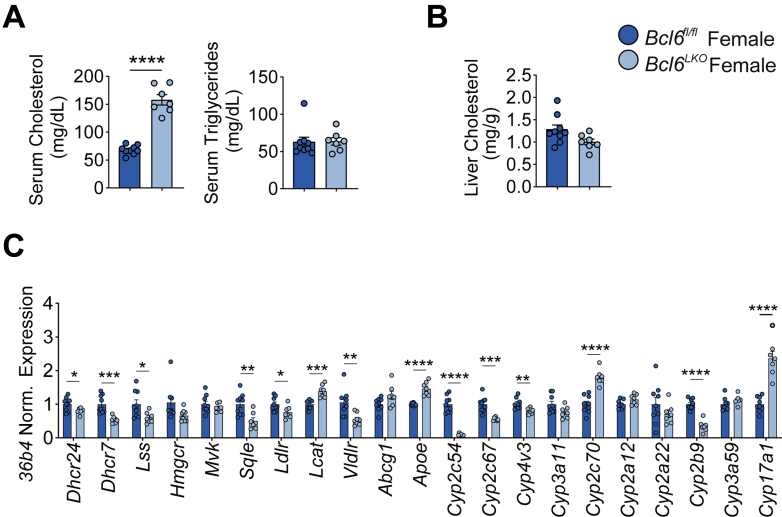 Figure 10
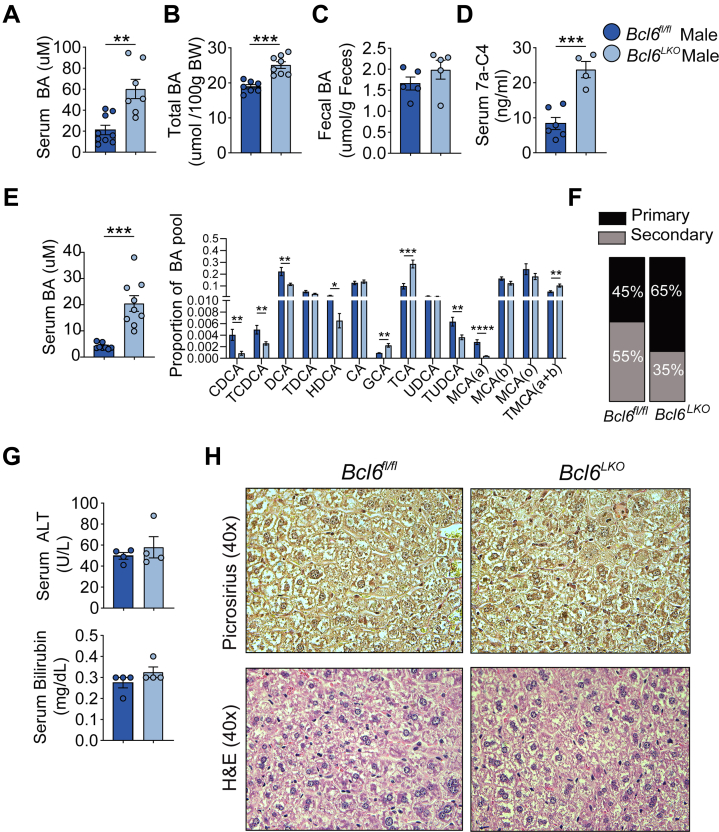 Figure 11
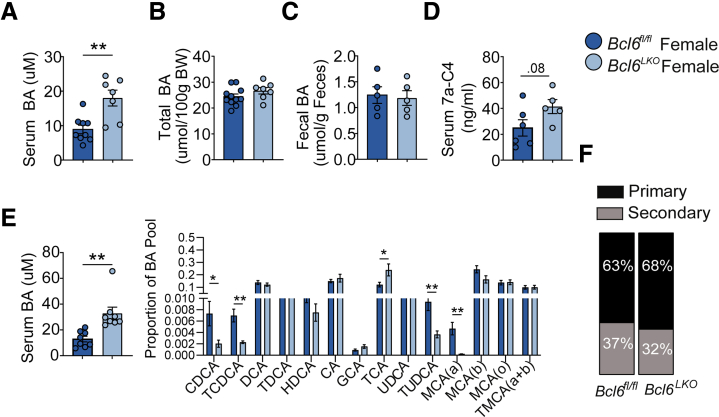 Figure 12
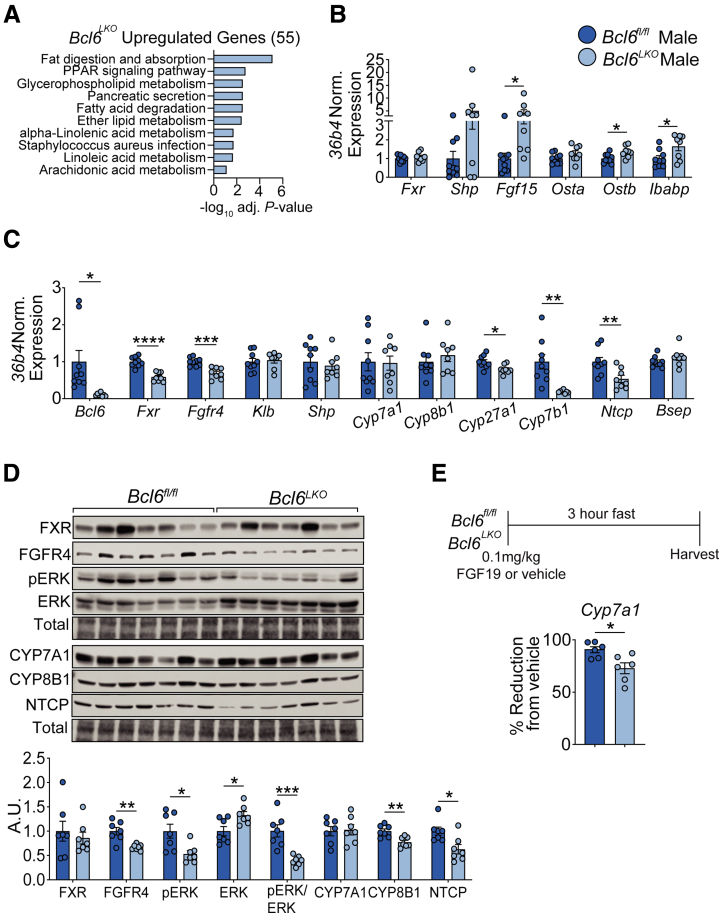 Figure 13
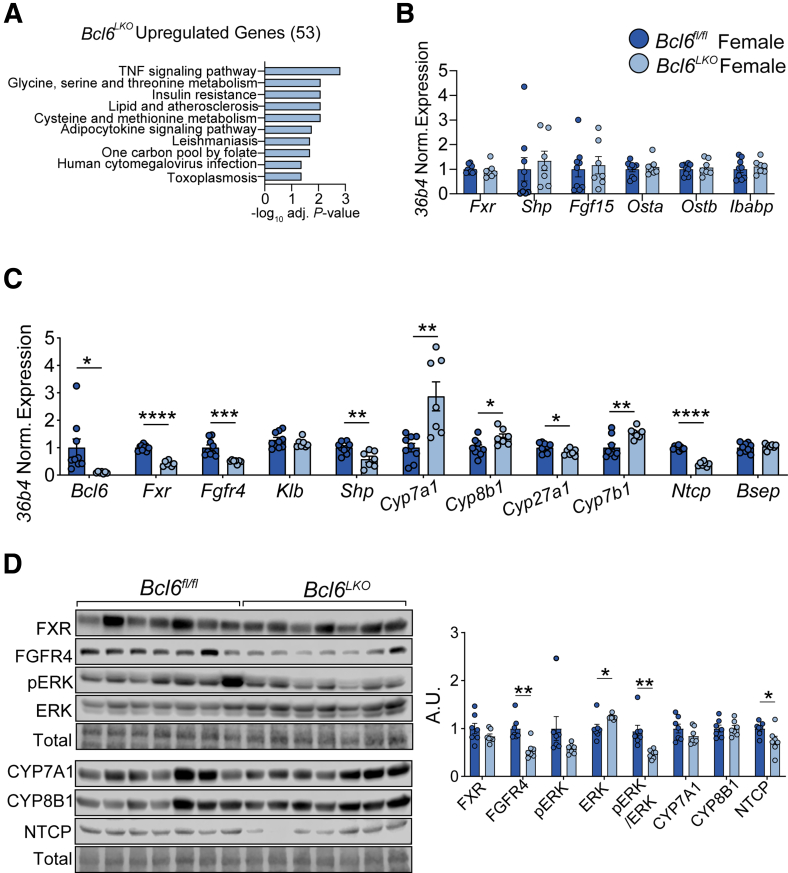 Figure 14
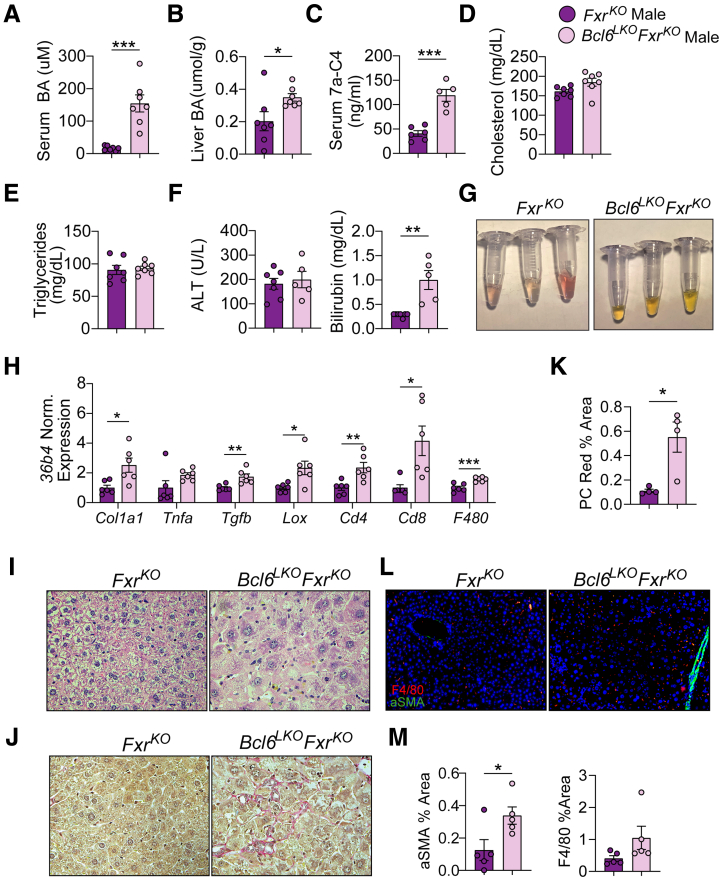 Figure 15
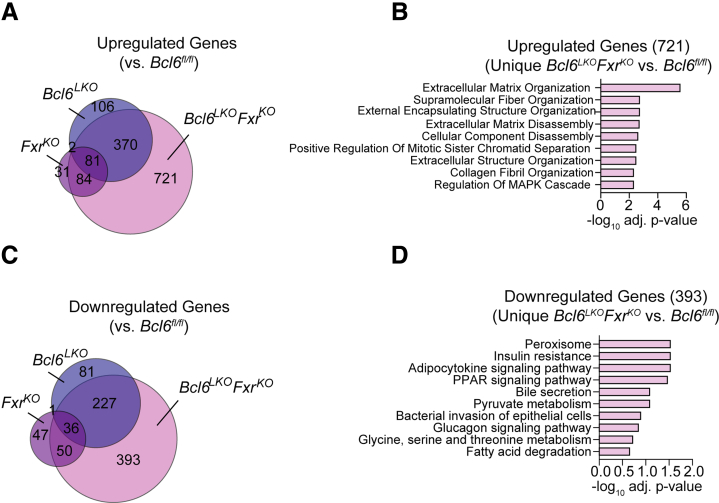 Figure 16
Peer Reviews
No public reviews on file for this paper yet. If you reviewed it on a platform where reviews are public (OpenReview, ICLR, NeurIPS, ICML), you can paste yours below so the community can read it here.
Videos
No videos yet. Explain this paper in a talk, walkthrough, or lecture? Add one.
Taxonomy
TopicsLiver physiology and pathology · Drug Transport and Resistance Mechanisms · Protein Kinase Regulation and GTPase Signaling
SummaryThis study shows that hepatic B-cell lymphoma 6 controls bile acid metabolism and converges with farnesoid X receptor enterohepatic signaling. Combined loss of hepatic B-cell lymphoma 6 and farnesoid X receptor causes severe cholestatic liver disease. What You Need to KnowBackgroundThe transcriptional repressor B cell lymphoma 6 (BCL6) is a well-established regulator of immune cell function, but its role in metabolic tissues is less understood.ImpactHere, we find that hepatic BCL6 cooperates with farnesoid X receptor to inhibit bile acid (BA) synthesis and levels, particularly in male mice.Future DirectionsFuture studies should extend our findings to determine the impact of hepatic BCL6 BA regulation on intestinal BAs, microbiota, and immunity.
The liver orchestrates the body’s response to changing energy conditions by directing gene expression and metabolism in response to nutrient-induced cues. Among these signals are bile acids (BAs), which are released into the intestines following meals to aid in lipid digestion.1^,^2 BAs signal by activating farnesoid X receptor (FXR) in the liver to direct transcription controlling BA, carbohydrate, and lipid homeostasis.2, 3, 4, 5 Additionally, intestinal bile acids activate FXR in enterocytes and upregulate the production and release of fibroblast growth factor (FGF)19 (FGF15 in mice).6 FGF15/19 then circulates back to hepatocytes to shut off BA synthesis by inhibiting expression of the rate-limiting BA synthetic enzyme, Cyp7a1.7^,^8 Hepatic FXR can also bind to BAs and inhibit Cyp7a1, although this liver-intrinsic pathway is less critical.9, 10, 11, 12 In this manner, FXR senses high enterohepatic BA levels and communicates to the liver to reduce BA synthesis. FXR also induces liver BA removal by activating the BA efflux pump bile salt export pump (BSEP) and inhibiting the BA re-uptake transporter sodium-taurocholate cotransporting polypeptide (NTCP).13, 14
When BA homeostasis is disrupted, BAs can overload the liver and cause damage due to their detergent properties.15^,^16 Based on the role for FXR in repressing BA synthesis and enhancing BA efflux, FXR agonists have been developed as clinical therapeutics for cholestatic liver diseases. Although they are effective, they have drawbacks including incomplete clinical response,17 as well as a range of side effects such as pruritus and increased low-density lipoprotein (LDL) cholesterol levels.18 Thus, additional strategies to treat cholestatic diseases are needed.
Previously, our laboratory identified the transcriptional repressor B-cell lymphoma 6 (BCL6)19, 20, 21 as a negative regulator of fasting hepatic lipid metabolism and antagonist of peroxisome proliferator-activated receptor alpha (PPARa)-driven gene regulation.22 In addition to its role in fatty acid handling, prior work has linked hepatic PPARa to the control of enzymes and transporters of BAs,23 whereas studies in human hepatocytes demonstrate that the PPARa promoter contains an FXR binding site, and PPARa expression is induced by BAs.24 Together, these suggested that BCL6 and FXR control overlapping transcriptional pathways potentially involved in BA signaling. Furthermore, a link between BCL6 and circulating lipoprotein cholesterol has been described, indicating a role in sterol metabolism.25
Here, using a machine learning-based analysis of BCL6-controlled genes and active DNA regulatory regions in liver, we identified an epigenomic link between BCL6- and FXR-regulated gene networks. These results, together with the known roles for BCL6 and FXR in directing fed state liver metabolism,22^,^26 prompted us to examine whether BCL6 influences hepatic FXR signaling and BAs. We discovered that BCL6 controls BAs by: (1) suppressing BA synthesis; (2) activating expression of fibroblast growth factor receptor 4 (FGFR4), priming the liver for FGF15-mediated Cyp7a1 repression; and (3) increasing expression of the BA re-uptake transporter NTCP. Finally, we found that combined loss of hepatic Bcl6 and Fxr causes severe BA accumulation and toxicity due to a virtually complete loss of hepatic Shp, indicating that Fxr and Bcl6 have independent but critical co-regulatory roles in maintaining BA homeostasis. Overall, these findings implicate BCL6 as a key integrator of FXR enterohepatic signaling and BA metabolism.
Results
Hepatic BCL6 and FXR Converge on Key BA Genes
To advance our understanding of BCL6 functions in the liver, we implemented a machine learning analysis pipeline, IMAGE, to integrate gene expression changes in hepatocyte Bcl6 knockout (Bcl6^LKO^) mice with active vicinal enhancers and promoters.27 This predicted 50 high confidence BCL6 co-regulatory transcription factors, including PPARa, which we previously described to functionally converge with BCL6 in directing fatty acid metabolism.22 Notably, FXR emerged as a high-ranked co-regulatory factor (P = 10^−4^) whose activity was strongly correlated (r = 0.90) to gene expression changes caused by loss of Bcl6 (Figure 1A). To extend these predictions, we performed FXR chromatin immunoprecipitation sequencing (ChIP-seq) in Bcl6^fl/fl^ livers and overlapped the resulting cistrome with our prior BCL6 ChIP-seq data.22^,^28 We found that BCL6 and FXR bind in close proximity along Bsep, Shp, and Klb, suggesting a potential role for BCL6 at FXR-dependent genes controlling BA metabolism (Figure 1B).Figure 1Hepatic BCL6 is predicted to co-regulate transcription with FXR. (A) Top 20 high-confidence causal transcription factors predicted by IMAGE analysis of RNA-seq and H3K27ac datasets from Bcl6^fl/fl^ and Bcl6^LKO^ livers. N = 3/group. (B) Representative UCSC browser tracks showing hepatic BCL6 and FXR binding at key BA regulatory genes in Bcl6^fl/fl^ liver.
Hepatic Bcl6 Deletion Increases Circulating Sterols
The liver is a primary organ for sterol metabolism, synthesizing cholesterol and directing its removal through the formation of lipoproteins and BAs.29^,^30 To begin to test the impact of BCL6 on sterol metabolism, we quantified serum cholesterol and triglycerides in Bcl6^LKO^ and Bcl6^fl/fl^ male and female mice (Figure 2A; Figure 3A). Although circulating triglycerides were unchanged in both sexes, cholesterol levels were doubled in Bcl6^LKO^ animals. Evaluation of lipoproteins from pooled serum using fast protein liquid chromatography revealed an increase for both high-density lipoprotein (HDL) and LDL cholesterol fractions in these mice (Figure 2B), in line with findings from another report.25 Additionally, we found no change in Bcl6^LKO^ liver cholesterol compared with their control counterparts (Figure 2C; Figure 3B). To gain insight into transcriptional changes underlying these alterations in cholesterol, we assembled expression data for genes involved in cholesterol metabolism (Figure 2D) from liver transcriptomic data in our prior study of ad lib fed Bcl6^LKO^ and Bcl6^fl/fl^ male mice.22 We found that SREB2-dependent cholesterol biosynthetic (Hmgcr, Mvk, Lss, Sqle, Dhcr7) and uptake (Ldlr) genes were significantly reduced in mice with hepatocyte Bcl6 ablation.31 In contrast, expression of genes implicated in reverse cholesterol transport was significantly increased (Lcat, Abcg1, Apoe) in livers of Bcl6^LKO^ mice. We also identified over 20 significantly altered CYP genes with functions in cholesterol and BA metabolism that were robustly up- or down-regulated in the livers of Bcl6^LKO^ mice.Figure 2Hepatic Bcl6 deletion increases serum cholesterol in males. (A) Serum cholesterol and triglycerides from Bcl6^fl/fl^ and Bcl6^LKO^ males. N = 8–9/group. (B) FPLC quantification of cholesterol and triglycerides from Bcl6^fl/fl^ and Bcl6^LKO^ pooled male serum. N = 3–4 animals/pool. (C) Liver cholesterol in Bcl6^fl/fl^ and Bcl6^LKO^ males. N = 8–9/group. Student’s t-tests were performed in (A and C) to compare means. (D) Heatmap of Bcl6^fl/fl^ vs Bcl6^LKO^ differentially expressed (Padj < .05, |log_2_FC |> 0) cholesterol synthesis, transport, and sterol-related CYP genes expressed as relative RPKM from RNA-seq performed in Bcl6^fl/fl^ and Bcl6^LKO^ male livers. N = 4/group. Data are represented as mean ± SEM. ^∗^P < .05; ^∗∗^P < .01; ^∗∗∗^P < .001; ^∗∗∗∗^P < .0001.Figure 3Hepatic Bcl6 deletion increases serum cholesterol in females. (A) Serum cholesterol and triglycerides and (B) liver cholesterol levels in Bcl6^fl/fl^ and Bcl6^LKO^ females. N = 7–9/group. (C) Liver qPCR quantifying cholesterol synthesis, transport, and sterol-related CYP genes in Bcl6^fl/fl^ and Bcl6^LKO^ females. N = 7–9/group. Student’s t-tests or multiple Student’s t-tests were performed to compare means. Data are represented as mean ± SEM. ^∗^P < .05; ^∗∗^P < .01; ^∗∗∗^P < .001; ^∗∗∗∗^P < .0001.
Because hepatic Bcl6 has sexually dimorphic expression with higher levels in males,19 we also examined cholesterol levels and regulation in Bcl6^LKO^ and Bcl6^fl/fl^ females. Similar to males, serum cholesterol levels were doubled in Bcl6^LKO^ females, whereas serum triglyceride levels and liver cholesterol levels were unchanged compared with female controls (Figure 3A and B). In addition, female Bcl6^LKO^ animals had reduced hepatic expression of cholesterol biosynthetic (Dhcr24, Dhcr7, Lss, Sqle) genes, elevated expression of cholesterol transport (Lcat, Apoe) genes, and changes in cholesterol-related CYP expression resembling liver alterations in Bcl6^LKO^ males (Figure 3C). Together, these findings showed that BCL6 regulates cholesterol metabolism and could more broadly impact liver sterol metabolism.
Hepatic Bcl6 Deletion Increases BA Levels and Synthesis
To determine whether BCL6 influences BAs, we first quantified BA levels in Bcl6^fl/fl^ and Bcl6^LKO^ male mice. We found that loss of hepatic Bcl6 caused a ∼3× increase in serum BAs (Figure 4A). We also quantified the total BA pool composed of liver, gallbladder, and small intestines in these animals and found that Bcl6^LKO^ males had a ∼25% increase in total BAs compared with controls (Figure 4B). Fecal BA levels also trended higher but were not significantly changed in Bcl6^LKO^ males (Figure 4C). To test whether BCL6 controls BA synthesis, we measured serum 7a-C4, an intermediate of classical BA synthesis and marker of CYP7A1 activity.32 Levels of 7a-C4 were nearly 3-fold higher in Bcl6^LKO^ males compared with controls (Figure 4D), indicating that loss of hepatic Bcl6 increased BA synthesis. Overnight fasting reduced circulating BA levels overall (Figure 4E), but Bcl6^LKO^ males continued to exhibit significantly more elevated BA levels than controls. We also examined whether BCL6 regulates the composition of BAs, finding higher proportions of classical pathway primary BAs (glycocholic acid [GCA]/taurocholic acid [TCA]) and reduced alternative pathway BAs (chenodeoxycholic acid [CDCA]/taurochenodeoxycholic acid [TCDCA]) in the serum of Bcl6^LKO^ males (Figure 4E; Table 1). Furthermore, loss of hepatic Bcl6 increased the ratio of primary to secondary serum BAs in males (Figure 4F). We found no changes in serum alanine aminotransferase (ALT) and bilirubin or liver picrosirius red staining in Bcl6^LKO^ animals, however, indicating that their increased BA levels do not cause hepatic inflammation or fibrosis (Figure 4G and H).Figure 4Hepatic Bcl6 deletion increases BA synthesis and serum/total levels in males. (A) Serum BA levels in Bcl6^fl/fl^ and Bcl6^LKO^ males. N = 7–9/group. (B) Total BA pool quantification (including liver, gallbladder, and small intestines) in Bcl6^fl/fl^ and Bcl6^LKO^ males, expressed as umol per 100 grams of body weight. N = 7–8/group. (C) Total fecal BA levels in Bcl6^fl/fl^ and Bcl6^LKO^ males. N = 5/group. (D) Serum 7a-C4 quantification in Bcl6^fl/fl^ and Bcl6^LKO^ males. N = 4–6/group. (E) Total (left) and individual BA species in serum as proportions of total (right), and (F) percentages of primary and secondary BAs in overnight-fasted Bcl6^fl/fl^ and Bcl6^LKO^ males. N = 8–9/group. (G) Serum ALT and bilirubin levels in Bcl6^fl/fl^ and Bcl6^LKO^ mice. N = 4/group. (H) Representative Picrosirius Red and H&E staining in liver from Bcl6^fl/fl^ and Bcl6^LKO^ males. In (A–E and G), Student’s t-tests or multiple Student’s t-tests were performed to compare means. Data are represented as mean ± SEM. ^∗^P < .05; ^∗∗^P < .01; ^∗∗∗^P < .001; ^∗∗∗∗^P < .0001.Table 1. Serum Individual BA Concentrations (uM)IDGenotypeSexCDCATCDCADCATDCAHDCACAGCATCAUDCATUDCAMCA(a)MCA(b)MCA(o)TMCA_(a+b)_Total1Bcl6^fl/fl^F0.07.050.700.210.090.940.000.610.190.090.082.290.730.676.732Bcl6^fl/fl^F0.120.041.270.140.140.520.000.380.310.09.011.361.140.275.773Bcl6^fl/fl^F.050.112.851.150.123.580.032.940.340.100.092.542.341.3817.624Bcl6^fl/fl^F0.06.051.400.300.081.32.010.790.380.080.042.291.290.728.805Bcl6^fl/fl^F0.070.082.200.760.142.40.011.420.450.09.052.483.080.9314.166Bcl6^fl/fl^F0.110.121.710.370.193.470.022.220.490.110.095.452.541.9918.897Bcl6^fl/fl^F0.030.130.930.610.061.44.012.170.210.150.041.450.791.369.388Bcl6^fl/fl^F0.070.072.510.630.222.34.012.250.470.11.057.841.603.7721.939Bcl6^LKO^F0.040.073.410.890.359.000.046.340.250.06.014.266.822.3233.8510Bcl6^LKO^F0.060.063.130.720.294.870.033.720.420.07.019.043.743.4829.6311Bcl6^LKO^F0.13.051.980.250.316.450.033.330.670.09.015.885.991.7226.8912Bcl6^LKO^F0.070.117.832.170.3119.100.0915.200.410.09.016.479.034.6865.5613Bcl6^LKO^F0.060.083.210.890.193.460.045.030.560.14.014.633.032.5223.8414Bcl6^LKO^F.010.092.411.040.040.920.0913.700.150.15.011.461.215.2826.5615Bcl6^LKO^F.010.074.231.450.042.920.069.370.280.13.012.342.582.3025.7816Bcl6^LKO^F0.140.065.530.650.383.980.024.690.890.11.016.604.922.5130.4817Bcl6^fl/fl^M0.03.010.590.090.080.420.000.190.08.01.010.461.500.073.5518Bcl6^fl/fl^M.01.050.750.350.031.01.011.390.070.030.020.970.550.535.7619Bcl6^fl/fl^M0.020.032.480.620.030.47.010.620.110.04.010.690.760.286.1520Bcl6^fl/fl^M0.02.010.650.090.090.300.000.150.040.02.010.661.330.123.4821Bcl6^fl/fl^M.01.010.740.100.100.380.000.20.050.02.010.761.270.173.8122Bcl6^fl/fl^M.010.020.580.150.100.410.000.250.040.030.020.751.010.233.6023Bcl6^fl/fl^M.010.020.650.220.030.520.000.500.040.03.010.650.700.263.6424Bcl6^fl/fl^M0.020.021.060.210.040.570.000.240.060.03.010.340.320.123.0325Bcl6^LKO^M.010.061.390.600.081.05.057.170.090.06.010.971.262.9815.7726Bcl6^LKO^M.010.062.340.570.164.49.056.820.340.08.014.775.082.8127.5927Bcl6^LKO^M0.020.041.360.420.100.800.022.930.12.05.010.812.350.839.8528Bcl6^LKO^M0.030.032.560.360.205.29.053.540.260.04.014.518.071.5626.5029Bcl6^LKO^M.01.051.990.540.021.330.024.140.170.06.011.221.461.1012.1130Bcl6^LKO^M.010.031.620.210.172.18.012.310.190.04.012.833.841.1114.5531Bcl6^LKO^M.010.041.370.58.052.640.066.600.120.06.011.982.332.2318.0732Bcl6^LKO^M.010.074.481.920.155.820.1411.200.440.15.014.794.114.7938.0733Bcl6^LKO^M0.07.053.050.760.243.370.045.990.410.10.011.854.051.6921.68BA, bile acid; Bcl6, B-cell lymphoma 6; CA, cholic acid; CDCA, chenodeoxycholic acid; DCA, deoxycholic acid; F, female; GCA, glycocholic acid; HDCA, hyodeoxycholic acid; M, male; MCA, muricholic acid; TCA, taurocholic acid; TCDCA, taurochenodeoxycholic acid; TDCA, taurodeoxycholic acid; TMCA, tauro-α-muricholic acid; TUDCA, tauroursodeoxycholic acid; UDCA, ursodeoxycholic acid.
In female Bcl6^LKO^ mice, serum BAs were ∼2× increased (Figure 5A), but their total BA pool was unchanged compared with control females (Figure 5B). Bcl6^LKO^ females exhibited unchanged fecal BA levels and a trend towards increased serum 7a-C4 (P = .08) compared with controls (Figure 5C and D). In line with our findings in males, serum BA profiling revealed increased proportions of classical pathway primary BAs (TCA) and reduced alternative pathway BAs (CDCA/TCDCA) in Bcl6^LKO^ females (Figure 5E; Table 1). In contrast to males, however, the ratio of primary to secondary serum BAs was mostly unchanged in females, suggesting that hepatic Bcl6 may be responsible for the sexual dimorphism observed in the proportion of primary vs secondary BAs (Figure 5F). Overall, these results indicated that hepatic Bcl6 ablation increased the synthesis and pool of BAs in males, and it increased circulating BA levels in both sexes.Figure 5Hepatic Bcl6 deletion increases BA synthesis and serum levels in females. (A) Serum BA levels in Bcl6^fl/fl^ and Bcl6^LKO^ females. N = 7–9/group. (B) Total BA pool quantification (including liver, gallbladder, and small intestines) in Bcl6^fl/fl^ and Bcl6^LKO^ females, expressed as umol per 100 grams of body weight. N = 7–11/group. (C) Total fecal BA levels in Bcl6^fl/fl^ and Bcl6^LKO^ females. N = 5/group. (D) Serum 7a-C4 quantification in Bcl6^fl/fl^ and Bcl6^LKO^ females. N = 5–6/group. (E) Total (left) and individual BA species in serum as proportions of total (right), and (F) percentages of primary and secondary BAs in overnight-fasted Bcl6^fl/fl^ and Bcl6^LKO^ females. N = 8/group. In (A–E), Student’s t-tests or multiple Student’s t-tests were performed to compare means. Data are represented as mean ± SEM. ^∗^P < .05; ^∗∗^P < .01; ^∗∗∗^P < .001; ^∗∗∗∗^P < .0001.
Loss of Hepatic Bcl6 Increases Ileal BA Signaling in Males
To elucidate the mechanism by which loss of BCL6 increases BA synthesis, we next examined the impact of BCL6 on BA feedback signaling. FXR controls BA homeostasis through its combined actions in the liver and intestine. In the ileum, BA activation of FXR induces FGF15 (FGF19 in humans) expression and release. FGF15 then binds the FGFR4/beta-Klotho (KLB) receptor complex on hepatocytes, which suppresses transcription of the rate-limiting BA synthetic enzyme Cyp7a1.12 To determine the role of BCL6 in this feedback pathway, we queried transcriptional changes in Bcl6^fl/fl^ and Bcl6^LKO^ ileum using RNA sequencing (RNA-seq). Notably, we found that genes differentially expressed in the ilea of Bcl6^LKO^ male mice were highly enriched in pathways involved in ‘Fat digestion and absorption’ (Figure 6A), suggesting a possible increase in BA signaling consistent with their elevated BA pools (Figure 4B). To confirm this, we interrogated the expression of key FXR target genes in the ilea of Bcl6^LKO^ males compared with controls. We detected 5-fold elevated Fgf15, ∼1.5-fold elevated Ostb and Ibabp, and trending increases in Shp levels in ilea of Bcl6^LKO^ mice (Figure 6B). These findings indicated that hepatic Bcl6 ablation enhances ileal FXR signaling and FGF15/19 levels in males.Figure 6Hepatic Bcl6 deletion activates ileal BA signaling while reducing liver sensitivity to FGF15/19 in males. (A) KEGG pathway analysis of ileal Bcl6^LKO^ upregulated genes (log_2_FC > 0, Padj < .05) from RNA-seq performed in Bcl6^fl/fl^ and Bcl6^LKO^ male ileum. N = 4/group. (B) qPCR of FXR target genes in ileum and (C) liver from Bcl6^fl/fl^ and Bcl6^LKO^ males. N = 8–9/group. (D) Western blot of BA feedback signaling markers from Bcl6^fl/fl^ and Bcl6^LKO^ male liver. N = 7/group. (E) qPCR of hepatic Cyp7a1 after treatment with FGF19, expressed as % reduction from respective Bcl6^fl/fl^ or Bcl6^LKO^ vehicle-treated expression. N = 6/group. In (B–D), multiple Student’s t-tests were performed to compare means. Data are represented as mean ± SEM. ^∗^P < .05; ^∗∗^P < .01; ^∗∗∗^P < .001; ^∗∗∗∗^P < .0001.
Hepatic Bcl6 Deletion Reduces Sensitivity to FGF15 in Males
Elevated FGF15/19 levels should efficiently shut down BA synthesis by repressing Cyp7a1. Counterintuitively, we found raised ileal Fgf15 (Figure 6B) along with increased bile acid synthesis and serum and total BA levels in Bcl6^LKO^ males (Figure 4A, B and D). Based upon these incongruent findings, we hypothesized that BCL6 promotes FGF15/19 signaling. FGF15/19 signals in the liver by binding to FGFR4/KLB receptor, triggering pERK activation and increased Shp expression, causing repression of Cyp7a1 transcription. To examine the role for BCL6 in this pathway, we first quantified levels of the hepatic FGF15 receptor FGFR4/KLB. Although we observed no change in Klb expression with loss of Bcl6, we found reduced FGFR4 mRNA and protein levels in Bcl6^LKO^ male livers (Figure 6C and D). Consistent with reduced FGFR4 signaling, we also observed decreased pERK levels, and no change in Shp or Cyp7a1 expression in Bcl6^LKO^ males compared with controls despite their high ileal Fgf15 (Figure 6C and D). To definitively determine whether BCL6 modulates hepatic sensitivity to FGF15/19, we injected Bcl6^fl/fl^ and Bcl6^LKO^ males with recombinant FGF19 and then measured the resulting reduction in Cyp7a1 expression after 3 hours compared with vehicle controls. Food was removed upon FGF19 administration to avoid confounding effects from endogenous meal-induced FGF15 during treatment.33^,^34 Although FGF19 suppressed Cyp7a1 expression by 90% in control livers, FGF19 treatment reduced Cyp7a1 levels by only 73% in Bcl6^LKO^ mice (Figure 6E). Together, these findings reflected that Bcl6^LKO^ livers are moderately resistant to FGF15/19-mediated signaling.
Females Lacking Hepatic Bcl6 Have Unchanged Ileal BA Signaling and Reduced FGF15 Sensitivity
Interestingly, when we examined gene expression in the ilea of female mice, we did not find enrichment of lipid absorption pathways or increased expression of FXR target genes, including Fgf15, with loss of hepatic Bcl6. (Figure 7A and B). These findings, along with the unchanged BA pools in Bcl6^LKO^ females, suggest that Bcl6^LKO^ females lack the increased ileal BA signaling found in male Bcl6^LKO^ mice. However, Bcl6^LKO^ females exhibited reduced hepatic FGFR4 transcript and protein expression, similar to findings in Bcl6^LKO^ males and suggesting they may also have reduced sensitivity to FGF15-mediated Cyp7a1 repression (Figure 7C and D). Consistent with their reduced FGFR4 levels, female Bcl6^LKO^ livers had reduced pERK signaling, reduced Shp expression, and increased Cyp7a1 and Cyp8b1 (Figure 7C and D). Overall, these findings suggest a model in which both male and female Bcl6^LKO^ mice are resistant to FGF15-mediated Cyp7a1 repression due to reduced FGFR4 expression. In Bcl6^LKO^ males, the elevated Fgf15 is sufficient to maintain WT Cyp7a1 levels, while Bcl6^LKO^ females, which do not have increased ileal Fgf15 expression, have elevated Cyp7a1 levels.Figure 7Hepatic Bcl6 deletion activates hepatic Cyp7a1 in females. (A) KEGG pathway analysis of ileal Bcl6^LKO^ upregulated genes (log_2_FC > 0, Padj < .05) from RNA-seq performed in Bcl6^fl/fl^ and Bcl6^LKO^ female ileum. N = 4/group. (B) qPCR of FXR target genes in ileum and (C) liver from Bcl6^fl/fl^ and Bcl6^LKO^ females. N = 7–9/group. (D) Western blot of BA feedback signaling markers from Bcl6^fl/fl^ and Bcl6^LKO^ female liver. N = 7/group. In (B–D), multiple Student’s t-tests were performed to compare means. Data are represented as mean ± SEM. ^∗^P < .05; ^∗∗^P < .01; ^∗∗∗^P < .001; ^∗∗∗∗^P < .0001.
Hepatic BCL6 Deletion Reduces NTCP Expression in Both Sexes
We also tested whether BCL6 controls expression of BA transporters, which are known to influence circulating BA levels.35^,^36 The BA efflux pump Bsep is responsible for the majority of BA export from the liver, whereas the bulk of BA re-uptake into the liver from circulation is mediated by the transporter NTCP (Slc10a1).13^,^37 We observed no change in Bsep expression in males and females with loss of Bcl6, but we did detect a ∼40% to 50% reduction in NTCP mRNA and protein levels in both sexes, suggesting that the increased serum BA levels observed in Bcl6^LKO^ animals may be partially due to reduced BA re-uptake into the liver (Figure 6C and D; Figure 7C and D).
Hepatic BCL6 Deletion Reduces Alternative BA Synthesis Enzyme Expression
Based on our observation that loss of hepatic Bcl6 increased serum BAs and the proportion of classical BAs (GCA/TCA) relative to alternative pathway BAs (CDCA/TCDCA) (Figure 4E; Figure 5E), we tested the expression of CYP enzymes that determine levels of individual BA species. CYP8B1 catalyzes the conversion to cholic acid (CA) in the classical BA synthesis pathway and is critical for controlling relative levels of CA vs CDCA.38 With loss of Bcl6 in males, we observed no changes in Cyp8b1 expression despite a 22% decrease of its protein level (Figure 6C and D). The enzymes CYP27A1 and CYP7B1 catalyze reactions in the alternative BA synthesis pathway, which generates CDCA.39 Consistent with an elevated ratio of CA compared with CDCA in the serum of Bcl6^LKO^ males, we found 20% reduced Cyp27a1 and 80% reduced Cyp7b1 in the livers of Bcl6^LKO^ males compared with controls (Figure 6C and D). Bcl6^LKO^ females showed a slight increase in Cyp8b1 gene expression, but unchanged protein levels. Similar to males, female Bcl6^LKO^ livers had reduced Cyp27a1 but elevated levels of Cyp7b1, a known sexually dimorphic CYP enzyme (Figure 7C and D).21 These data suggest that BCL6 maintains the balance between classical and alternative BA synthesis by upregulating alternative pathway enzymes.
Dual Loss of FXR and Hepatic BCL6 (Bcl6LKOFxrKO) Results in Cholestatic Liver Disease
The interrelationship between BCL6 and FXR gene regulation in the enterohepatic system prompted us to test their combined impact on BA homeostasis. To this end, we generated mice lacking both hepatic Bcl6 and whole body Fxr (Bcl6^LKO^Fxr^KO^) and compared these with animals with loss of Fxr alone (Fxr^KO^). Although singular loss of Bcl6 resulted in a ∼3-fold elevation in serum BA levels compared with control males (Figure 4A), Bcl6^LKO^Fxr^KO^ males had levels that were nearly 10-fold elevated compared with Fxr^KO^ animals (Figure 8A). Bcl6^LKO^Fxr^KO^ males also had elevated liver BA levels, suggesting possible cholestasis (Figure 8B). Correspondingly, serum 7a-C4 levels were nearly doubled in males with combined loss of Fxr and hepatocyte Bcl6 compared with mice with deficiency of Fxr alone, indicating that FXR and hepatocyte BCL6 additively suppress BA synthesis (Figure 8C). Interestingly, Bcl6^LKO^Fxr^KO^ males had similar serum cholesterol and triglyceride levels compared with their Fxr^KO^ counterparts (Figure 8D and E). This indicated that FXR may play a role in the elevated cholesterol levels observed with loss of hepatic Bcl6 (Figure 2A), and previous work revealed that Fxr-deficient mice have elevated serum cholesterol levels, further suggesting that BCL6 and FXR co-regulate sterol levels.40Figure 8Dual deletion of Fxr and hepatic Bcl6 causes BA overload and liver damage in males. (A) Serum BAs, (B) liver BAs, (C) serum 7a-C4, (D) serum cholesterol, (E) serum triglycerides, and (F) serum ALT and bilirubin in Fxr^KO^ and Bcl6^LKO^Fxr^KO^ males. N = 5–7/group. (G) Representative image of serum from Fxr^KO^ and Bcl6^LKO^Fxr^KO^ males. (H) Liver qPCR of Col1a1 and immune markers in Fxr^KO^ and Bcl6^LKO^Fxr^KO^ males. N = 6/group. (I) Representative H&E stained (40×) and (J) Picrosirius Red stained (40×) images from Fxr^KO^ and Bcl6^LKO^Fxr^KO^ male livers. (K) Picrosirius Red quantification expressed as % total area in Fxr^KO^ and Bcl6^LKO^Fxr^KO^ male livers. Each data point is the average of 3 images/liver. N = 4/group. (L) Representative (20×) images of aSMA (green) and F4/80 (red) immunofluorescence in Fxr^KO^ and Bcl6^LKO^Fxr^KO^ male livers. (M) aSMA and F4/80 image quantification expressed as % total area in Fxr^KO^ and Bcl6^LKO^Fxr^KO^ male liver. Each data point is the average of 4 images/liver. N = 5/group. In (A–F, H, K and M) Student’s t-tests or multiple Student’s t-tests were performed to compare means. Data are represented as mean ± SEM. ^∗^P < .05; ^∗∗^P < .01; ^∗∗∗^P < .001; ^∗∗∗∗^P < .0001.
In line with the large elevations in liver BAs and serum 7a-C4 levels in Bcl6^LKO^Fxr^KO^ mice, we detected evidence of cholestatic liver damage in these mice, including increased serum bilirubin, visibly apparent yellowing of serum, and 2- to 4-fold elevated hepatic expression of pro-fibrotic (Col1a1, Tgfb, Lox), proinflammatory (Tnfa), and immune cell marker (Cd4, Cd8, F4/80) genes (Figure 8F–H). Furthermore, we observed hepatocellular hypertrophy, 5-fold increased liver picrosirius red collagen staining, 2-fold increased alpha smooth muscle actin, and a trend towards increased F4/80 macrophage staining in Bcl6^LKO^Fxr^KO^ livers compared with their Fxr^KO^ counterparts (Figure 8I–M).
To better understand the transcriptional pathways co-regulated by BCL6 and FXR, we performed RNA-seq in Fxr^KO^ and Bcl6^LKO^Fxr^KO^ male livers and compared this with data from Bcl6^fl/fl^ and Bcl6^LKO^ males. We identified 721 genes uniquely upregulated in Bcl6^LKO^Fxr^KO^ compared with Bcl6^fl/fl^ mice, whose expression was unaffected by single deletion of either Fxr or hepatic Bcl6 (Figure 9A). Gene Ontology enrichment analysis revealed that these uniquely upregulated genes were highly linked to pathways including ‘Extracellular Matrix Organization’ and ‘Collagen Fibril Organization,’ in line with the elevated liver Col1a1 expression and picrosirius red staining observed in Bcl6^LKO^Fxr^KO^ mice compared to Fxr^KO^ counterparts (Figure 9B). Furthermore, we identified 393 uniquely downregulated liver genes in Bcl6^LKO^Fxr^KO^ compared with Bcl6^fl/fl^ and single knockout animals. These included genes implicated in ‘Bile Secretion,’ consistent with the cholestasis observed in livers of Bcl6^LKO^Fxr^KO^ mice (Figure 9C and D).Figure 9Combined loss of Fxr and hepatic Bcl6 upregulates pro-fibrotic genes. (A) Venn diagram showing common and unique upregulated genes (Padj < .05; log_2_FC >0.5) in male Fxr^KO^ , Bcl6^LKO^, or Bcl6^LKO^Fxr^KO^ livers compared with Bcl6^fl/fl^ livers. (B) Top GO pathways of genes uniquely upregulated in Bcl6^LKO^Fxr^KO^ vs Bcl6^fl/fl^ livers. (C) Venn diagram of common and unique downregulated genes (Padj < .05; log_2_FC <0.5) in male Fxr^KO^, Bcl6^LKO^, or Bcl6^LKO^Fxr^KO^ livers compared with Bcl6^fl/fl^ livers. (D) Top GO pathways of genes uniquely downregulated in male Bcl6^LKO^Fxr^KO^ vs Bcl6^fl/fl^ livers. N = 4/group.
In females, dual-loss of hepatic Bcl6 and Fxr similarly caused ∼5-fold elevations in serum BAs, a strong trend towards increased liver BAs (P = .06), and no change in serum cholesterol or triglycerides compared with Fxr^KO^ females (Figure 10A–D). Like Bcl6^LKO^Fxr^KO^ males, Bcl6^LKO^Fxr^KO^ females exhibited jaundiced serum, increased expression of pro-fibrotic (Col1a1, aSma) and inflammatory/immune marker genes (Tgfb, Lox, Cd8), hepatocyte ballooning, and increased liver picrosirius red staining (Figure 10E–I). Overall, these data indicated that BCL6 and FXR co-regulate BA production and, in the absence of Fxr, BCL6 is critical to restrain synthesis and hepatotoxic overload of BAs.Figure 10Dual deletion of Fxr and hepatic Bcl6 causes BA overload and liver damage in females. (A) Serum BAs, (B) liver BAs, (C) serum cholesterol, and (D) serum triglycerides in Fxr^KO^ and Bcl6^LKO^Fxr^KO^ females. N = 6–9/group. (E) Representative image of serum from Fxr^KO^ and Bcl6^LKO^Fxr^KO^ females. (F) Liver qPCR of Col1a1 and immune markers in Fxr^KO^ and Bcl6^LKO^Fxr^KO^ females. N = 5–9/group. (G) Representative H&E stained (40×) and (H) Picrosirius Red stained (40×) images from Fxr^KO^ and Bcl6^LKO^Fxr^KO^ female livers. (I) Picrosirius Red quantification expressed as % total area in Fxr^KO^ and Bcl6^LKO^Fxr^KO^ female liver. Each data point is the average of 3 images/liver. N = 5/group. In (A–D, F, and I), Student’s t-tests or multiple Student’s t-tests were performed to compare means. Data are represented as mean ± SEM. ^∗^P < .05; ^∗∗^P < .01; ^∗∗∗^P < .001; ^∗∗∗∗^P < .0001.
Dual Deletion of Fxr and Hepatic Bcl6 Causes Profound Loss of SHP-mediated Repression and BA Overload
We next examined the mechanism driving the massive elevation in BAs observed with co-deletion of Fxr and hepatocyte Bcl6. Hepatic Shp (Nr0b2) is activated through both liver-intrinsic and enterohepatic mechanisms directed by FXR.12 Remarkably, we found that Bcl6^LKO^Fxr^KO^ males and females had a profound loss of liver Shp mRNA and 57% reduced small heterodimer partner (SHP) protein levels (Figure 11A and B; Figure 12A). To better understand the large reduction in Shp, we interrogated chromatin activity at the Shp locus by performing ChIP-quantitative polymerase chain reaction (qPCR) with histone 3 lysine 27 acetyl (H3K27ac) antibody (Figure 11C). In Bcl6^LKO^Fxr^KO^ mice, we detected an ∼80% reduction of H3K27ac at the Shp promoter site where BCL6 and FXR each bind and a trending reduction in H3K27ac levels at an enhancer site just downstream of the Shp locus where BCL6 and FXR likewise bind, consistent with the loss of Shp transcription (Figure 11C). In addition, mRNA and protein levels of the SHP target genes CYP8B1 and CYP7A1 were upregulated ∼1- to 3-fold in Bcl6^LKO^Fxr^KO^ mice compared to animals lacking Fxr alone (Figure 11A and B; Figure 12A), reflecting a loss of SHP-mediated repression. Bcl6^LKO^Fxr^KO^ animals exhibited reduced liver Ntcp, Cyp27a1, and Cyp7b1, paralleling the reductions observed with loss of Bcl6 alone and suggesting these genes are controlled by BCL6 independently of FXR (Figure 11A and B; Figure 12A). Interestingly, Bcl6^LKO^Fxr^KO^ males did not exhibit reduced Fgfr4 expression compared with Fxr^KO^ males, whereas this reduction was preserved in females. This suggested that hepatic Bcl6 may indirectly regulate Fgfr4 in a manner that is sexually dimorphic in the absence of Fxr (Figure 11A; Figure 12A). Combined loss of hepatic Bcl6 and Fxr also reduced expression of the BA exporter Bsep, consistent with the elevated liver BAs and cholestatic damage we detected in Bcl6^LKO^Fxr^KO^ animals (Figure 11A; Figure 12A). These findings established BCL6 as a key partner for hepatic FXR to cooperatively maintain Shp expression.Figure 11Dual deletion of Fxr and hepatic Bcl6 in males results in loss of SHP. (A) qPCR and (B) Western blots of BA regulatory targets in Fxr^KO^ and Bcl6^LKO^Fxr^KO^ male livers. N = 4–6/group. (C) (Left) UCSC browser tracks at the Shp (Nr0b2) locus, showing FXR (top) and BCL6 (bottom) binding sites in control male livers. Arrows annotate the Shp promoter (Shp-Pro) and Shp downstream enhancer (Shp-DS) regions. (Right) H3K27ac ChIP qPCR at the Shp-Pro and Shp-DS regions in Fxr^KO^ and Bcl6^LKO^Fxr^KO^ male livers, expressed as percent of input chromatin. N = 3/group. Student’s t-tests or multiple Student’s t-tests were performed to compare means. Data are represented as mean ± SEM. ^∗^P < .05; ^∗∗^P < .01; ^∗∗∗^P < .001; ^∗∗∗∗^P < .0001.Figure 12Dual deletion of Fxr and hepatic Bcl6 in females results in loss of SHP. (A) qPCR of BA regulatory targets in Fxr^KO^ and Bcl6^LKO^Fxr^KO^ female livers. N = 5–9/group. Multiple Student’s t-tests were performed to compare means. Data are represented as mean ± SEM. ^∗^P < .05; ^∗∗^P < .01; ^∗∗∗^P < .001; ^∗∗∗∗^P < .0001.
To definitively determine whether the large increases in CYP7A1 and serum BAs were due to the drop in liver Shp expression in Bcl6^LKO^Fxr^KO^ mice, we transduced Bcl6^LKO^Fxr^KO^ and Fxr^KO^ males with adeno-associated virus serotype 8 (AAV8) expressing either Gfp (AAV8-TBG-GFP) or Shp (AAV8-TBG-SHP) from the thyroid binding globulin promoter and examined their livers 4 weeks post-AAV injection. We found that overexpression of Shp in the liver was sufficient to suppress serum BAs in Bcl6^LKO^Fxr^KO^ mice down to quantities observed in Fxr^KO^ mice treated with green-fluorescent protein (GFP)-negative control virus (Figure 13A). Similarly, Shp overexpression caused a trending decrease in liver BA levels in Bcl6^LKO^Fxr^KO^ mice (Figure 13B). In line with reduced serum BA levels, AAV-TBG-SHP treatment reduced liver CYP7A1 gene and protein expression to levels found in Fxr^KO^ mice treated with GFP (Figure 13C and D). We also observed a trend towards reduced liver COL1A1 mRNA and protein expression in Shp-transduced Bcl6^LKO^Fxr^KO^ mice and a slight but significant reduction in their F4/80 expression, suggesting that SHP overexpression may attenuate hepatic damage in Bcl6^LKO^Fxr^KO^ mice (Figure 13C and D). Overall, these data indicate that SHP is required for BCL6 and FXR co-repression of Cyp7a1 and BAs.Figure 13SHP is required for BCL6-FXR co-suppression of CYP7A1 and BAs in males. (A) Serum, (B) liver total BAs, (C) liver western blot of GFP, SHP, CYP7A1, and COL1A1, and (D) liver qPCR of Bcl6, Shp, Gfp, Cyp7a1, and immune marker genes in Fxr^KO^ and Bcl6^LKO^Fxr^KO^ males treated with AAV-TBG-GFP or AAV-TBG-SHP for 4 weeks. N = 3–6/group. Two-way ANOVA with Holm-Sidak’s post-hoc testing was performed to compare effects of AAV-treatment, genotype, and their interaction on means. Data are represented as mean ± SEM. ^∗^P < .05; ^∗∗^P < .01; ^∗∗∗^P < .001; ^∗∗∗∗^P < .0001.
Extrahepatic FXR Coordinates with Hepatocyte BCL6 to Suppress BAs
Hepatic SHP inhibits Cyp7a1 expression and BA synthesis through: (1) an ileal-liver negative feedback pathway involving FGF15-mediated induction of Shp; and (2) a liver-intrinsic pathway by which hepatic FXR activates Shp expression. Because both ileal and liver FXR play a part in BA feedback signaling, we sought to determine the relative contribution of hepatocyte vs global Fxr deletion in driving the massive BA elevation observed in Bcl6^LKO^Fxr^KO^ mice. To test this, we crossed Bcl6^LKO^ mice with Fxr^fl/fl^ mice to generate hepatocyte-specific double knockout (Bcl6^LKO^Fxr^LKO^) mice and compared these with Fxr full-body knockout counterparts (Bcl6^LKO^Fxr^KO^ and Fxr^KO^ mice). We found that Bcl6^LKO^Fxr^LKO^ mice, which lack Fxr in liver but express it in ileum, had serum and liver BA levels resembling those of wild-type control (Bcl6^fl/fl^Fxr^fl/fl^) mice (Figure 14A and B). Consistent with their reduced BA levels, we observed increased Shp and reduced Cyp7a1 in the livers of double hepatocyte knockout mice (Bcl6^LKO^Fxr^LKO^) compared with their full-body Fxr knockout counterparts (Bcl6^LKO^Fxr^KO^) (Figure 14C). This reduction in Cyp7a1 was likely due to elevated ileal Fgf15, which we observed in Bcl6^LKO^Fxr^LKO^ compared with both control (Bcl6^fl/fl^Fxr^fl/fl^) and Bcl6^LKO^Fxr^KO^ mice (Figure 14D). These data indicate that liver-intrinsic FXR signaling is dispensable for the massive BA elevation observed in Bcl6^LKO^Fxr^KO^ animals, which instead is likely dependent upon ileal FXR and FGF15 enterohepatic signaling.Figure 14Hepatic Fxr is not required for FXR-BCL6 co-regulation of BAs. (A) Serum total BAs, (B) liver total BAs, (C) liver qPCR of Bcl6, Fxr, Shp, and Cyp7a1, and (D) ileal qPCR of Fxr, Shp, and Fgf15 in Bcl6^fl/fl^Fxr^fl/fl^, Fxr^KO^, Bcl6^LKO^Fxr^KO^, and Bcl6^LKO^Fxr^LKO^ males. N = 4–8/group. One-way ANOVA with Holm-Sidak’s post-hoc testing was performed to compare means. Data are represented as mean ±SEM. ^∗^P < .05; ^∗∗^P < .01; ^∗∗∗^P < .001; ^∗∗∗∗^P < .0001.
Conclusion
BAs signal through FXR to control diverse processes including lipid, glucose, and BA metabolism.1^,^41, 42, 43, 44 Due to their signaling and cytotoxic potential, BA synthesis must be tightly controlled to maintain homeostasis and prevent hepatic damage.45 FXR is well-established as a key regulator of BA levels, acting directly in the liver and indirectly in the ileum to repress hepatic BA synthesis. Although this negative feedback loop is well-established, much less is understood about the control of FXR and its transcriptional network. Our work has identified BCL6 as a suppressor of BA synthesis and levels (Figure 15, top). Consistent with these functions, BCL6: (1) reduces cholesterol levels; (2) activates expression of FGFR4, priming the liver for FGF15-mediated repression of Cyp7a1; and (3) upregulates expression of the BA reuptake transporter NTCP. These findings support a model wherein BCL6 primes the liver through multiple mechanisms to shut down BA synthesis and induce BA recycling to maintain BA homeostasis.Figure 15Model for BCL6 and FXR co-regulation of BAs. (Top) In control (Bcl6^fl/fl^) mice, BCL6 restrains hepatic and circulating cholesterol while enhancing NTCP and FGFR4 expression. In tandem, FXR activates SHP via enterohepatic and direct liver signaling to suppress CYP7A1 and BA production. (Bottom left) Loss of hepatic Bcl6 reduces the BA transporter NTCP and FGFR4 while it increases cholesterol and CYP7A1-directed BA synthesis and circulating levels. (Bottom right) Combined loss of hepatic Bcl6 and whole body Fxr unmasks co-dependent regulation of Shp by BCL6 and FXR. Shp levels are strongly reduced, whereas CYP7A1 is reciprocally increased. BA synthesis and levels become severely elevated, leading to cholestasis.
In the absence of Bcl6 (Figure 15, bottom left), levels of the BA precursor 7a-C4, were substantially higher in Bcl6^LKO^ male mice compared with controls (Figure 4D), indicating that loss of hepatic Bcl6 increases BA synthesis. Although 7a-C4 is the direct product of CYP7A1, we surprisingly found that liver levels of CYP7A1 protein were not increased by Bcl6 ablation (Figure 6D). This could reflect that Bcl6 deletion facilitates proper CYP7A1 localization or retention in the endoplasmic reticulum, enhances CYP7A1 enzymatic activity through allosteric regulation or post-translational modification, or increases CYP7A1 reaction rate by increasing its substrate levels (cholesterol) in the endoplasmic reticulum. To date, little is known about the regulation of CYP7A1 beyond its transcriptional control,46, 47, 48, 49, 50, 51, 52 so future work to understand how BCL6 influences CYP7A1 may illuminate new regulatory aspects of classical BA synthesis.
BA metabolism differs between sexes, with females exhibiting a larger BA pool, higher serum BA levels, reduced BA excretion, and reduced cholesterol conversion to BAs compared with males.53, 54, 55 Expression of the key enterohepatic hormone Fgf15 is also reportedly higher in the ilea of females.55 Notably, BCL6 is sexually dimorphic with lower expression in the livers of females.19, 20, 21 We correspondingly found that the total BA pool, BA synthesis rate, and ratio of primary to secondary BAs were not substantially impacted in females with hepatic Bcl6 deletion, in contrast to the marked BA changes observed in Bcl6^LKO^ males (Figure 4A–F; Figure 5A–F). We additionally found that hepatic BCL6 regulated ileal FXR signaling in a sex-biased manner, with Bcl6^LKO^ males exhibiting increased expression of Fgf15 and FXR target genes compared with controls, an effect which was not evident in females (Figure 6B; Figure 7B). These data support a role for hepatic BCL6 as a regulator of male-biased BA metabolism in mice. Future studies to test the impact of BCL6 on intestinal BA composition, signaling, and the microbiome may further reveal functional consequences of its sex-dependent BA regulation.
We found evidence of epigenetic crosstalk between BCL6 and FXR, including co-binding along the Shp, Klb, and Bsep loci (Figure 1). To understand their relationship in BA metabolism, we generated a model lacking both hepatic Bcl6 and whole body Fxr (Bcl6^LKO^Fxr^KO^) (Figure 15, bottom right). Previous work has suggested that FXR is not the sole regulator of Shp expression and BA synthesis; Fxr^KO^ mice retain some Shp expression and only show a modest increase in CYP7A1 and BA levels compared with the massive elevations observed with dual deletion of both Fxr and Shp.56^,^57 In the present study, we found that dual deletion of hepatic Bcl6 and whole body Fxr (Bcl6^LKO^Fxr^KO^) results in a profound loss of hepatic SHP, in turn causing induction of CYP7A1 (particularly in males), massive BA elevation, and liver injury similar to that observed with combined deletion of Fxr and Shp.56 Remarkably, these effects were not observed when co-deletion of Bcl6 and Fxr was restricted to hepatocytes, indicating a critical interaction between FXR enterohepatic signaling and BCL6-directed regulation of BA metabolism in the liver.
Our findings reveal BCL6 as an FXR co-regulatory transcription factor which, in the absence of whole body Fxr, is critical for maintaining Shp expression and protecting the liver from cholestatic liver damage. This co-regulatory role of BCL6 could have clinical implications. For instance, cholestatic liver diseases are sometimes associated with reduced Fxr expression or activity,58, 59, 60 and specific forms of cholestasis are associated with loss-of-function mutations in FXR.61, 62, 63 FXR agonists are a major therapy for cholestatic diseases, although ∼30% to 40% of patients with primary biliary cholangitis (PBC) do not respond to ursodeoxycholic acid (UDCA),64 and high doses of obeticholic acid (OCA) have been linked with worsening cholestasis in patients with PBC and advanced cirrhosis.65 Thus, our results raise the possibility that interventions to raise hepatic BCL6 could be therapeutic for cholestatic disease.
Materials and Methods
Mice
Bcl6^fl/fl^ mice, which contain loxP sites between exons 5 and 6 of the mouse Bcl6 locus, were generated by the UC David Mouse Biology Program.66 Bcl6^fl/fl^ mice were crossed with Albumin-Cre (Jackson Laboratories, Stock #003574) to generate Bcl6^LKO^ mice. Fxr^KO^ (Stock #004144) and Fxr^fl/fl^ mice (Stock #028393) were acquired from Jackson Laboratories. Mice were housed with a 14:10 light:dark cycle. All experiments were performed in ad libitum-fed or 4-hour fasted animals unless otherwise stated. All animal care and procedures were conducted in accordance with regulations of the Institutional Animal Care and Use Committee at Northwestern University, protocol IS000020416. FGF19 treatment: Ad libitum-fed Bcl6^fl/fl^ and Bcl6^LKO^ males were treated with intraperitoneal (i.p.) injection of 0.1 mg/kg rhFGF19 (Peprotech) dissolved in phosphate buffered saline (PBS) or corresponding PBS vehicle. Mice were fasted 3 hours post-injection, and then livers were harvested for RNA and protein. AAV-TBG-SHP injections: Liver-specific (AAV8) adeno-associated virus driven by the thyroid binding globulin promoter (TBG) containing the Nr0b2 cDNA (AAV-TBG-SHP) or GFP (AAV-TBG-GFP) were acquired from Vector Biolabs. Bcl6^LKO^Fxr^KO^ and Fxr^KO^ mice were retro-orbitally injected with 1.5 × 10^11^ GC of either AAV-TBG-SHP or AAV-TBG-GFP and harvested 4 weeks later for analysis.
Serum/Liver Lipid Quantification
Liver cholesterol was isolated using the Folch method, in which tissues were homogenized in 1 mL of methanol and then incubated overnight in a 1:2 methanol:chloroform solution. 0.9% NaCl was added to homogenates, which were then incubated overnight. The subsequent chloroform layer was extracted and dried under nitrogen gas. The lipids were resuspended in 2-propanol prior to quantification. Serum and liver triglycerides and cholesterol levels were quantified using the Infinity Thermo Fisher kit for triglycerides or cholesterol. Lipoprotein separation of serum was performed using fast protein liquid chromatography (FPLC) at the Vanderbilt Mouse Metabolomic Phenotyping Center (MMPC).
qPCR
∼25 mg of livers or terminal ilea (last 2 cm of ileum just proximal to cecum) were collected in RNALater (ThermoFisher). Samples were bead-homogenized in Trizol (ThermoFisher). 20% chloroform by volume was added, and the aqueous phase was isolated following centrifugation. RNA was further purified using the RNAeasy kit (Qiagen). 1 ug RNA was converted to cDNA using the iScript cDNA synthesis kit (BioRad). qPCR was performed using iTaq Universal SYBR Green Supermix (BioRad). All gene expression was quantified using the standard curve method and normalized to the housekeeping gene 36b4. See Table 2 for primer sequences.Table 2. Primer SequencesNameForward PrimerReverse PrimerDhcr24CGCCTGTCACTTGGAACATTAGCCTAGCTACCACCTGGATCATTDhcr7AGAGCTGAATTCACACGGATACCTCCAAGCAGAGAGACATGAAALssGTGTCTTGGCTGGGTGATAAGACACCAACACTGACCCTATCHmgcrCCAGAAGCTTTCGTCAGTAGAGCTCTGCTTGTAGTCTCTGCTTMvkGGTGGCCTTGAACTTGAGAACATCCCAGACCTGCTTAATACCSqleAGAGCCCGACAGGATAGTTGATGGGCATTGAGACCTTCTACLdlrATCCACCGCAACATCTACTGGGAACAGTGTCCTCCTCTTTACLcatGAAAGAGGAGCAGCGCATAAGTCTTGGACGGTGTAGTTGAAGVldlrGTGACCACAGCAGTATCAGAAGCTGCCATCACTAAGAGCAAGAGAbcg1ACCCGCCTGTCATGTTCTTTCACCACTTGGAAGCAGGAGGApoeTGAACCGCTTCTGGGATTACCATCAGTGCCGTCAGTTCTTCyp2c54TTAAAGGAGCCCAGGAAGATGTTGACTCTGTCCCACCAATAAACyp2c67CAAGAGGAAGCACAGTGGCTCAGGAAAACAATGGAGCAGATGACATCyp4v3CACCTTGGAAGACCTGAAGAAAGCTAAGACTCCGGGCAAATAACyp3a11CCGAGTGGATTTTCTTCAGCGAGCCTCATCGATCTCATCCCyp2c70GATTGACCAGGGAGATGAGTTTCGGGTTTGTTTCCATGTTTCTCCyp2a12TGCTCCTCCTAGCCATTCTGCAGGGCCATAGTGCTCTTGGCyp2a22GGCACTGATGTGTTCCCTATAATCTTCAACTGTCCCTTGTCATCCyp2b9CTCCACTATGGAGTCCTGCTCAGCGGTCATCAAGAGTTGGTAGCCyp3a59GCTATGATGCCACAAGCACTTCCTCAGGGCATCATAGGTGACAGGCyp17a1GGATGCACAGGTTGAGGTTAGGGATAGGAGTGAGGAGGATTGTFxr (Nr1h4)ATCCCAGATCTCACAGAGGAGTCCGGACATTCAACCATCACShp (Nr0b2)CGATCCTCTTCAACCCAGATGAGGGCTCCAAGACTTCACACAFgf15GATATACGGGCTGATTCGCTACAGATGGTGCTTCATGGATCTGOsta (Slc51a)CTTCTGTCCCTCAGCCTTATCGTTCAACCCACTGCACTTTACOstb (Slc51b)CCTGCATCTTGATGACTCCATATTCTCTTTCAACTCAGGTTCCCIbabp (Fabp6)TATGAGCGCGTAAGCAAGAGCTAGCAGTGGTGATCCATGAAABcl6TGCAGATGGAGCATGTTGACCTCGGTAGGCCATGATFgfr4CCTGAGGCCAGATACACAGATAGGATGACTTGCCGATGATACACKlbCCAAGTCAGCTGTTCCTCTATGCATCTGTCTTCCAACTCCCTTCCyp7a1AGCCAGAGTCCAATGCTTAGCTCATCTCACACCAGGGTAAATCyp8b1TTTCTGAGGGAGCAAGGAATAGGGAATAAGAGGACCCAGAAACACyp27a1TTGCCTTGGAAGCCATCACGGCAGCCAATCCTTTTCTCACyp7b1CGAGAAGTGCAGGAGGATATGGTGTATGAGTGGAGGAAAGAGGNtcp (Slc10a1)TCTCTGCTCTCTTCCGACTAAGGTGACATTGAGGATGGTAGAABsep (Abcb11)GCTCATCGCTTGTCTACTATCCCCTTCTGGTCCATCAGTTTCTTCol1a1AGACCTGTGTGTTCCCTACTGAATCCATCGGTCATGCTCTCTnfaACTCCCAGGTTCTCTTCAAGGGTGGGTGAGGAGCACGTAGTTgfbCTCCCGTGGCTTCTAGTGCGCCTTAGTTTGGACAGGATCTLoxCCTGGCCAGTTCAGCATATAGGTAAGAAGTCCGATGTCCCTTGCd4TCCTAGCTGTCACTCAAGGGATCAGAGAACTTCCAGGTGAAGACd8CCGTTGACCCGCTTTCTGTCGGCGTCCATTTTCTTTGGAAF480TTGTACGTGCAACTCAGGACTGATCCCAGAGTGTTGATGCAAaSmaGTCCCAGACATCAGGGAGTAATCGGATACTTCAGCGTCAGGAGfpAGTCCGCCCTGAGCAAAGATCCAGCAGGACCATGTGATC36b4AGATGCAGCAGATCCGCAGTTCTTGCCCATCAGCACCShp(Nr0b2)_PromoterGCATGGAAATGGGCATCAATAGTCGGATGACTCAAGTGCATAAAShp(Nr0b2)_DownstreamCAGTTGTCTACAGGGCTTTCACCGGTGAGAAGGATCCAAAC
Western Blotting
Fifty mg liver samples were dounced in RIPA buffer and centrifuged to isolate the liquid fraction. Bicinchoninic acid (BCA) assay (ThermoFisher) was used to quantify protein. Lysates were denatured by boiling for 5 minutes in loading buffer. Twenty to 40 ug of lysates were loaded into pre-cast gels (BioRad) and transferred to 0.4 um polyvinylidene fluoride (PVDF) membranes (Immobilon). Membranes were blocked in 5% milk in TBST or PBST. Primary antibodies for BCL6 (sc-7388, Santa Cruz) at 1:200, FXR (E4B8P, Cell Signaling) at 1:1000, FGFR4 (D3B12, Cell Signaling) at 1:1000, NTCP (ab131084, Abcam) at 1:1000, pERK1/2 (#9101, Cell Signaling) at 1:1000, ERK1/2 (#137F5, Cell Signaling) at 1:1000, CYP7A1 (18054-1-AP, ProteinTech) at 1:1000, GFP (#G10362, Invitrogen) at 1:1000, SHP (PA5-102494, Thermo Fisher) at 1:1000, CYP8B1 (Abcam, ab191910), or COL1A1 (Cell Signaling, #E8I9Z) were added and incubated overnight at 4 degrees. Secondary antibodies (Jackson ImmunoResearch) were added for 1.5 hours. All blots were imaged and quantified using the Licor Odyssey FC and ImageStudio (Licor). All protein levels were normalized to Licor Total Protein Stain.
ChIP
Livers were harvested and dual-crosslinked by homogenizing in 2 mM disuccinimidyl glutarate for 30 minutes followed by adding 1% formaldehyde for 10 minutes. Samples were quenched in 125 mM glycine, then rinsed with PBS. Crosslinked nuclei were lysed in cell lysis buffer (0.75M NaCl, 1% Triton X, 0.5 mM Tris, .05 mM EDTA, and 0.5% NP-40) and lysed in sodium dodecyl sulfate (SDS) lysis buffer (1% SDS, 10 mM EDTA, and 50 mM Tris) using a Diagenode Bioruptor. Samples were then incubated in 5 ug of FXR antibody (E4B8P, Cell Signaling) or 2 ug of H3K27ac antibody (39133, Active Motif) overnight, and immune complexes were isolated using anti-IgG paramagnetic beads (ThermoFisher). De-crosslinked samples were further processed using the MinElute PCR purification kit (Qiagen). For H3K27ac ChIP-qPCR, DNA was diluted 1:20 and assessed via qPCR and expressed as percent of input chromatin. See Table 2 for primer sequences.
ChIP-seq
Samples were made into libraries using the KAPA Hyperprep Kit (Kapa Biosystems) and sequenced using the Illumina NextSeq 2000 with 100 bp single-end reads. The resulting FASTQ files were aligned to the mm10 genome using Bowtie with parameters to output uniquely mapped reads.67 ChIP-seq samples were analyzed with HOMER.68 The ‘makeTagDirectory’ command with ‘-tbp1’ was used to make tag directories. Homer’s ‘-makeUCSCfile’ and ‘-bedGraphToBigWig’ commands were utilized to make BigWig files for visualization on the UCSC genome browser.
RNA-seq
RNA from liver and ileum was purified using the RNAeasy kit (Qiagen). Sequencing libraries were made using the TruSeq Stranded mRNA Kit (Illumina), and sequencing was performed on the Illumina NextSeq 2000 using 100 bp single-end reads. Sequences were aligned to mm10 using STAR version 2.5.2 with ‘--outFilterMultimapNmax 1’ and ‘--outFilterMismatchNmax 4’.69 Gene expression was normalized and reads per kilobase of transcript per million mapped reads (RPKM) was quantified using HOMER.68 Differential expression was calculated using DEseq2.70 Venn diagrams were generated in R using BioVenn,71 and Gene Ontology analysis was performed using EnrichR.72
Integrated Analysis of Motif Activity and Gene Expression Analysis
Liver RNA-seq and H3K27ac datasets from male ad libitum-fed Bcl6^fl/fl^ and Bcl6^LKO^ livers were taken from our previously published data (GSE118789). These datasets were aligned, and tag directories were generated as described above. For the RNA-seq datasets, HOMER’s ‘analyzeRepeats.pl’ with parameters ‘-noadj’, ‘-count exons’ and ‘-condenseGenes’ was used to create a raw counts file containing tags from all replicates. For H3K27ac datasets, Homer’s ‘findPeaks.pl’ with style ‘-histone’ was used to generate a list of peaks for each replicate. Homer’s ‘mergePeaks’ with ‘-d given’ was then utilized to make a merged list of all individual sample peaks. Then, ‘annotatePeaks.pl’ was used to annotate the merged list with tags from each replicate. These gene and regulatory region lists served as inputs for Integrated Analysis of Motif Activity and Gene Expression (IMAGE) to predict transcription factors driving changes in gene expression. (https://github.com/JesperGrud/IMAGE/).
BA Quantification
Individual serum BAs were analyzed in overnight-fasted serum by the Duke Metabolomics/Proteomics Core. Total serum BAs were quantified using the Crystal Chem Mouse Serum Bile Acid kit. For liver BAs, ∼50 mg of left-lobe liver was weighed and dounced in 1 mL of 75% ethanol. Samples were transferred into glass test tubes and incubated at 50° for 2 hours. Samples were then centrifuged, transferred into vials, and stored at −20° until BAs were quantified. To measure the total BA pool, the liver, gallbladder, and small intestines were weighed and transferred to a tube containing 20 mL of 75% ethanol. Tissues were minced and homogenized for 30 seconds using a Polytron. The homogenized contents were then incubated at 50° for 2 hours and centrifuged. The resulting lysate was collected and diluted 1:4 with PBS prior to quantification. Fecal BAs were processed as previously described.73 For collection, mice were single-housed for 12 hours, and all feces were collected into a glass culture tube. Fecal samples were placed in a 37° incubator until completely dry and crushed with a mortar and pestle. Two mL of 75% ethanol was added to 100 mg of feces, then samples were incubated at 50° for 2 hours. Samples were centrifuged and then transferred to vials to be quantified. Liver, fecal, and total pool BA extracts were quantified using the Crystal Chem Mouse Serum Bile Acid kit per the manufacturer’s instructions.
Serum 7a-C4, ALT, and Bilirubin Quantification
Serum 7a-C4 was quantified in overnight-fasted serum by Mayo Clinic’s Immunochemical Core Lab. Serum ALT and bilirubin were quantified by Northwestern’s Microsurgery Core using the Mammalian Liver Profile kit (Abaxis).
Histology
One hundred mg of liver from the left lobe was fixed in 10% formalin overnight, stored in 70% ethanol, paraffin-embedded, and sectioned. Embedded samples were stained using hematoxylin and eosin (H&E), Picrosirius red, and alpha-smooth muscle actin (ThermoFisher 53-9760-82) and F4/80 (Cell Signaling #70076S) antibodies by Northwestern University’s Mouse Histology and Phenotyping Laboratory.
Statistical Analysis
GraphPad Prism (Dotmatics) was utilized to perform statistical analyses with Student’s t-tests or analysis of variance (ANOVA) with Holm-Sidak’s post-hoc testing as detailed in the figure legends.
CRediT Authorship Contributions
Ellen Fruzyna (Conceptualization: Lead; Formal analysis: Lead; Funding acquisition: Supporting; Investigation: Lead; Writing – original draft: Lead; Writing – review & editing: Supporting)
Meredith A. Sommars (Conceptualization: Supporting; Formal analysis: Supporting; Funding acquisition: Supporting; Investigation: Supporting)
Yasu Omura (Investigation: Supporting)
Kristine M. Yarnoff (Investigation: Supporting)
Janice C. Wang (Investigation: Supporting)
Christopher R. Futtner (Investigation: Supporting)
Richard M. Green (Conceptualization: Supporting)
Grant D. Barish (Conceptualization: Lead; Funding acquisition: Lead; Supervision: Lead; Writing – original draft: Lead; Writing – review & editing: Lead)
The reference list from the paper itself. Each links out to its DOI / PubMed record.
- 1Macierzanka A.Torcello-Gómez A.Jungnickel C.Maldonado-Valderrama J.Bile salts in digestion and transport of lipids Adv Colloid Interface Sci 274201910204510.1016/j.cis.2019.10204531689682 · doi ↗ · pubmed ↗
- 2Chiang J.Y.L.Ferrell J.M.Discovery of farnesoid X receptor and its role in bile acid metabolism Mol Cell Endocrinol 548202211161810.1016/j.mce.2022.111618 PMC 903868735283218 · doi ↗ · pubmed ↗
- 3Preidis G.A.Kim K.H.Moore D.D.Nutrient-sensing nuclear receptors PPARα and FXR control liver energy balance J Clin Invest 1272017119312012828740810.1172/JCI 88893 PMC 5373864 · doi ↗ · pubmed ↗
- 4Duran-Sandoval D.Cariou B.Percevault F.The farnesoid X receptor modulates hepatic carbohydrate metabolism during the fasting-refeeding transition J Biol Chem 280200529971299791589988810.1074/jbc.M 501931200 · doi ↗ · pubmed ↗
- 5Ma K.Saha P.K.Chan L.Moore D.D.Farnesoid X receptor is essential for normal glucose homeostasis J Clin Invest 1162006110211091655729710.1172/JCI 25604 PMC 1409738 · doi ↗ · pubmed ↗
- 6Kir S.Kliewer S.A.Mangelsdorf D.J.Roles of FGF 19 in liver metabolism Cold Spring Harb Symp Quant Biol 7620111391442181363810.1101/sqb.2011.76.010710 · doi ↗ · pubmed ↗
- 7Kliewer S.A.Mangelsdorf D.J.Bile acids as hormones: the FXR-FGF 15/19 pathway Dig Dis 3320153273312604526510.1159/000371670 PMC 4465534 · doi ↗ · pubmed ↗
- 8Inagaki T.Choi M.Moschetta A.Fibroblast growth factor 15 functions as an enterohepatic signal to regulate bile acid homeostasis Cell Metab 220052172251621322410.1016/j.cmet.2005.09.001 · doi ↗ · pubmed ↗