A pilot study on measured insulin sensitivity and estimated glucose disposal rates in adults with type 1 diabetes and diabetic kidney disease
Johan R Simonsen, Daniel Gordin, Andrzej S Januszewski, Alicia J Jenkins, Daniël H van Raalte, Michael JB van Baar, Petter Bjornstad, Lena M Thorn, Per-Henrik Groop

TL;DR
This pilot study explores insulin sensitivity in adults with type 1 diabetes and kidney disease, finding potential signs of increased insulin resistance.
Contribution
The study is the first to use euglycemic-hyperinsulinemic clamps to assess insulin resistance in type 1 diabetes with diabetic kidney disease.
Findings
M/I-values were 62.5% lower in individuals with type 1 diabetes and DKD, though not statistically significant.
eGDR by Januszewski et al. showed the highest correlation with GDR in the DKD group.
The study suggests increased insulin resistance in type 1 diabetes patients with diabetic kidney disease.
Abstract
Diabetic kidney disease (DKD) in type 1 diabetes has been shown to be strongly associated with insulin resistance, but this has not been previously explored using the euglycemic-hyperinsulinemic clamp. Therefore, we investigated insulin sensitivity in people with type 1 diabetes with and without DKD using M/I-values (mean glucose disposal rates [GDR]/mean plasma insulin) and compared GDRs to estimated GDR (eGDR)-formulae. In this pilot study, we studied 17 adult individuals with type 1 diabetes (ten with and seven without DKD) using euglycemic-hyperinsulinemic clamps and assessed correlations between GDR and eGDR values. M/I-values were 62.5% lower in individuals with type 1 diabetes and DKD compared to those without DKD, albeit not statistically significant (0.16 ± 0.08 vs. 0.10 ± 0.08 mg/kg/min per mIU/L, P = 0.154). In the whole group (n = 17) eGDR by Williams et al. demonstrated…
Genes, proteins, chemicals, diseases, species, mutations and cell lines named across the full text — each resolved to its canonical identifier and authoritative record.
Click any figure to enlarge with its caption.
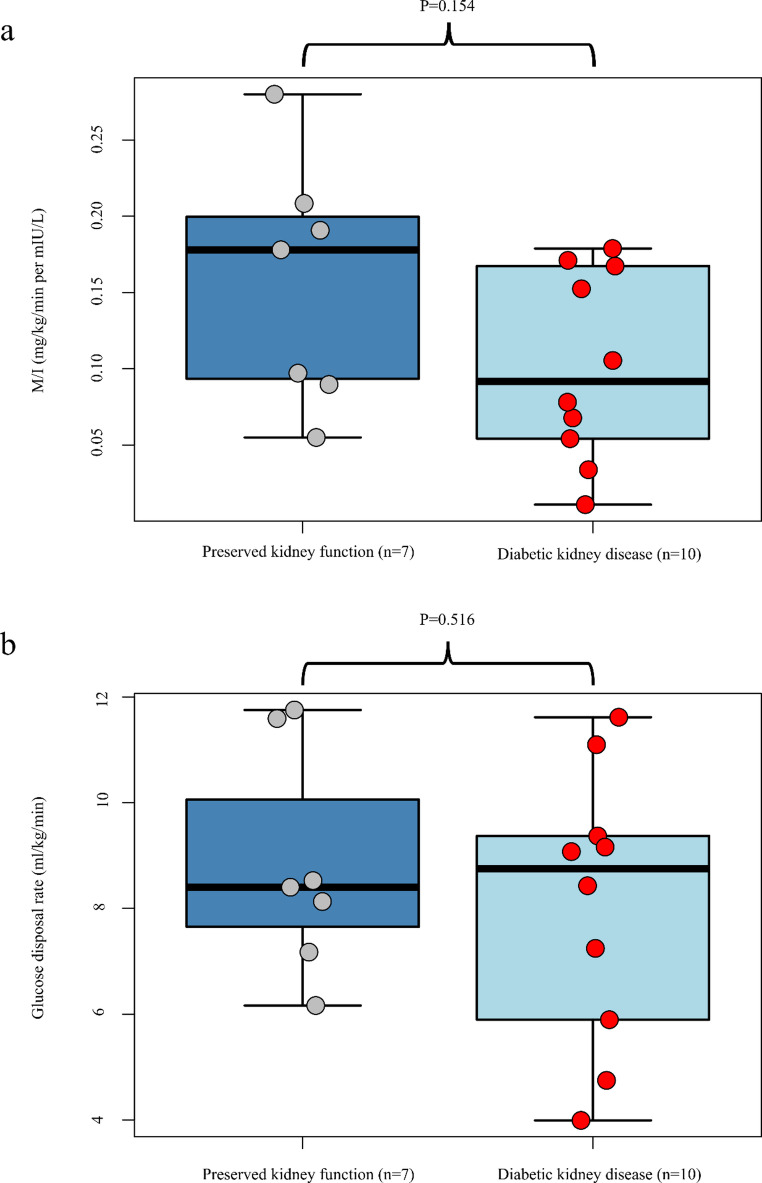 Figure 1
- —University of Helsinki (including Helsinki University Central Hospital)
Peer Reviews
No public reviews on file for this paper yet. If you reviewed it on a platform where reviews are public (OpenReview, ICLR, NeurIPS, ICML), you can paste yours below so the community can read it here.
Videos
No videos yet. Explain this paper in a talk, walkthrough, or lecture? Add one.
Taxonomy
TopicsDiabetes Management and Research · Chronic Kidney Disease and Diabetes · Diabetes and associated disorders
Introduction
Insulin resistance is a key feature of type 2 diabetes, and an increasingly recognized feature of type 1 diabetes as well [1]. The gold standard of assessing insulin sensitivity is measuring the glucose disposal rate (GDR) in the euglycemic-hyperinsulinemic clamp. However, due to the required expertise, intensive nature and high costs of such studies this method is not feasible for large studies and mathematical formulae to estimate glucose disposal rates (eGDR) have been devised [2–4]. Diabetic kidney disease (DKD) has been shown to be strongly associated with insulin resistance [5–8], but to our knowledge no clamp studies have been undertaken to directly assess insulin sensitivity in individuals with type 1 diabetes and DKD. Furthermore, previously developed eGDR formulae in type 1 diabetes are based on individuals with mostly preserved kidney function. Therefore, in this pilot study, we investigated insulin resistance in individuals with type 1 diabetes with and without DKD and evaluated the correlations of three published eGDR formulas with measured GDR (mGDR).
Materials and methods
The study is part of the Finnish Diabetic Nephropathy (FinnDiane) Study, a prospective, observational study comprising adult participants with type 1 diabetes (age at onset < 40 years and permanent insulin treatment started < 1 year after diagnosis) attending clinical study visits with 5-year intervals. We recruited FinnDiane participants, who at a study visit in the previous year met the following inclusion criteria: not having DKD (estimated glomerular filtration rate [eGFR] 90–125 mL/min per 1.73 m^2^ and urinary albumin excretion rate [AER] < 30 mg/24 h) or having DKD (diagnosis based on eGFR 30–89 mL/min per 1.73 m^2^ and AER ≥ 30 mg/24 h). eGFR was calculated using the Chronic Kidney Disease Epidemiology Collaboration (CKD-EPI 2021) formula [9]. The study was approved by the local ethics committee and conducted in accordance with the revised Declaration of Helsinki. All participants gave written informed consent.
Participants attended two clinical visits 2–4 weeks apart. At the first visit anthropometrics and blood pressure were measured, and blood samples collected. Body composition was measured by DXA (Lunar version 16; GE Healthcare, Wauwatosa, WI). The participant’s insulin regimen and blood glucose (BG) monitoring method, diet, and medications were assessed.
During the second visit an euglycemic-hyperinsulinemic clamp was performed. Participants abstained from alcohol, rigorous exercise (24 h), coffee (12 h) and collected 24 h urine samples prior to the visit. Clamps started at 7 am after an overnight fast. The prandial insulin dose was withheld. Intravenous cannulas were placed in both upper limbs for the infusions of 20% glucose and insulin, and blood sampling, respectively. Heating pads were applied for arterialization of venous blood. BG was measured every 5 min with a Biosen C-Line - Clinic/GP+-platform (EKF, Cardiff, United Kingdom). The insulin infusion (Insulin Aspart, NovoRapid^®^) was started at 40 mIU/(min⋅m^2^) with the goal to maintain a plasma glucose level of 5.0–5.5 mmol/l by adjusting the 20% glucose infusion rate. Clamps lasted for 240 min. During a 30 min steady-state phase at the end of the clamp, glucose infusion rates were measured for the GDR and calculation of M/I (mean GDR/mean plasma insulin). Insulin levels were measured using the Mercodia (Uppsala, Sweden) Iso-Insulin ELISA kit as per manufacturer’s instructions. The mGDR was compared with eGDR based on three published eGDR formulae: The Pittsburgh Epidemiology of Diabetes Complications (EDC) formula by Williams et al. (factors included: waist-hip ratio, presence of hypertension, HbA_1c_), the Coronary Artery Calcification in Type 1 Diabetes (CACTI) formula by Duca et al. (waist, total daily insulin dose per weight, triglycerides and diastolic blood pressure), and finally the eGDR-formula by Januszewski et al. (sex, age, high-density lipoprotein cholesterol [HDL-C], systolic and diastolic blood pressure, height, weight, waist and serum creatinine)[2–4].
Clinical characteristics are presented as mean ± SD, median (IQR), or frequency percentage. Differences between groups were tested using the Student’s t-test, Wilcoxon signed-rank test or Fisher’s exact test. Correlations between mGDR and eGDR were estimated using Spearman ρ correlation coefficients. All analyses were performed in R (R Core Team version 4.4.2, Vienna, Austria). Statistical significance was taken at P < 0.05.
Results
We studied 17 Caucasian adults with type 1 diabetes (10 with DKD and seven with normal kidney function [Table 1]). Nine of the 10 participants with DKD had severe albuminuria (AER > 300 mg/24 h). No significant differences in age, diabetes duration, sex, baseline HbA_1c_, lipids were observed between the groups, but individuals with DKD had more central obesity compared to the group with retained kidney function (median waist to height ratio [IQR]: 0.57 vs. 0.51 (0.49–0.52), P = 0.043). All participants in the DKD group were on blockers of the renin-angiotensin-aldosterone system, while none of the participants in the other groups were treated with these or other hypertensive medications.
Table 1. Clinical characteristics of individuals with type 1 diabetes without or with diabetic kidney disease (DKD)ParameterAll individuals with type 1 diabetes (n = 17)Preserved kidney function (n = 7)DKD (n = 10)P (for difference between DKD and preserved kidney function)Age, years55.0 (44.9–57.0)49.1 (43.6–52.5)56.1 (55.2–60.7)0.070Sex (Female), n (%)8 (47)4 (57)4 (40)0.486Diabetes duration, years37.5 (28.6–47.2)29.3 (22.8–40.9)45.9 (30.0–50.0)0.133Usage of CSII, n (%)7 (41)4 (57)3 (30)0.298Usage of MDI, n (%)10 (59)3 (43)7 (70)0.298HbA_1c_, mmol/mol53.2 ± 9.757.0 ± 3.450.5 ± 11.90.081Creatinine, µmol/l94 ± 29113 ± 2267 ± 5< 0.001eGFR, ml/min/1.73 m^2^78.7 ± 23.1102.9 ± 9.361.7 ± 10.5< 0.001Urinary AER, mg/24 h303 (8–407)0 (0–9)401 (340–633)< 0.001Total cholesterol, mmol/l3.4 (2.9–4.5)4.2 (3.4–4.8)3.1 (2.8–4.4)0.282HDL-cholesterol, mmol/l1.3 (1.0–1.9)1.7 (1.3–1.9)1.2 (0.9–1.5)0.133LDL-cholesterol, mmol/l2.0 (1.6–2.9)2.2 (2.1–2.7)1.6 (1.3–2.9)0.171Triglycerides, mmol/l1.2 (0.8–1.5)0.8 (0.7–1.1)1.5 (1.1–1.8)0.051Systolic blood pressure, mmHg143 ± 22141 ± 23144 ± 220.771Diastolic blood pressure, mmHg82 ± 1284 ± 1581 ± 100.591Fat-percent32.9 ± 0.131.0 ± 0.134.2 ± 0.10.400Height (cm)169 ± 13171 ± 14169 ± 140.770Weight (kg)77 ± 1577 ± 1877 ± 130.999Waist (cm)94 (83–103)84 (80–93)103 (87–104)0.196WHR0.90 ± 0.110.85 ± 0.100.93 ± 0.110.131BMI (kg/m^2^)27.3 (25.6–28.0)27.1 (24.9–27.7)27.3 (25.8–27.9)0.813 Measured and estimated insulin sensitivity GDR (mg/kg/min)8.4 ± 2.48.8 ± 2.18.1 ± 2.60.516GDR per lean mass (mg/kg/min)12.5 ± 3.212.8 ± 2.812.2 ± 3.70.712Insulin levels during steady state (µU/l)67.9 (55.3–87.0)68.3 (62.2-148.6)56.4 (44.3–76.2)0.172Hypertension and/or use of antihypertensive medication10 (59%)010 (100%)< 0.001Total daily dose of insulin/bodyweight (IU/kg)0.52 ± 0.170.44 ± 0.120.58 ± 0.180.090M/I (mean GDR/mean plasma insulin,[mg/kg/min per mIU/L])0.12 ± 0.070.16 ± 0.080.10 ± 0.080.154eGDR by Williams formula, mg/kg/min6.55 ± 2.518.93 ± 1.374.88 ± 1.57< 0.001eGDR by Duca formula, mg/kg/min3.91 ± 1.654.87 ± 1.563.23 ± 1.410.046eGDR by Januszewski formula, mg/kg/min5.64 ± 4.649.96 ± 1.621.77 ± 1.88< 0.001CSII indicates continuous subcutaneous insulin infusion; MDI, multiple daily insulin injections; AER, albumin excretion rate; HbA1c, glycated hemoglobin; eGFR, estimated glomerular filtration rate; HDL, high-density lipoprotein cholesterol; LDL, low-density lipoprotein cholesterol; WHR, waist-hip ratio; BMI, body mass index; GDR, glucose disposal rate; eGDR, estimated glucose disposal rate. Data are presented as means ± standard deviation, medians (interquartile range), or percentages where appropriate
During clamp steady state, average BG was 5.4 mmol/l (SD 0.4), and the median insulin concentration was 66.6 µU/ml (IQR: 53.0-89.3). M/I-values were 62.5% lower in type 1 diabetes individuals with vs. without DKD, albeit not statistically significant (0.10 ± 0.08 vs. 0.16 ± 0.08 mg/kg/min per mIU/L, P = 0.154, Fig. 1a). Differences in mean [SD] GDR were smaller (8.8 [2.1] vs. 8.1 [2.6] mg/kg/min, P = 0.516). We also observed substantial variability in GDR in both groups, especially in the DKD group where GDR-values ranged from 4 to 12 mg/kg/min (Fig. 1b).
Fig. 1. Insulin sensitivity in adults with type 1 diabetes with and without diabetic kidney disease (DKD). a Mean glucose disposal rate (GDR)/mean plasma insulin, mg/kg/min per µU/L insulin. b Measured GDR (mg/kg bodyweight/min). The box represents upper and lower quartile, the whiskers range, the line represents median with data points as dots
Comparing the previously published eGDR-formulae with our mGDR, the eGDR-formulae generally exhibited weak correlations: in all 17 participants the Spearman correlation coefficients between mGDR and eGDRs calculated were r = 0.35 (P = 0.167) for the Williams formula, r = 0.34 (P = 0.184) for the Duca formula, and r = 0.24 (P = 0.350) for the Januszewski formula. Similarly, in individuals without DKD, all formulae showed weak correlations: Williams, r = 0.30, P = 0.518; Duca, r = 0.05, P = 0.91; and Januszewski, r=-0.24, P = 0.613. In individuals with DKD all formulae showed modest correlations: Williams, r = 0.43, P = 0.222; Duca, r = 0.46, P = 0.184; and Januszewski, r = 0.46, P = 0.177. Interestingly, all three eGDR formulas predicted statistically significant differences in insulin sensitivity between the two groups, with lower sensitivity in those with vs. without DKD (Table 1).
Discussion
Insulin resistance has been associated with chronic kidney disease [6,10]. To our knowledge it has never previously been investigated in people with type 1 diabetes and established DKD using the euglycemic-hyperinsulinemic clamp methodology. Herein we measured insulin sensitivity by this “gold-standard” technique and also assessed the performance of three eGDR formulae in 17 adults with type 1 diabetes with and without DKD. Individuals with DKD seemed more insulin resistant and had ≈ 63% lower insulin sensitivity (M/I) compared to those without DKD. mGDR was also lower in those with vs. without DKD, but again did not reach statistical significance in this pilot study. Interestingly, all three eGDR formulae predicted a significant difference in eGDR between the two groups. The Williams formula showed the best correlation in the whole group, while the Januszewski formula performed best in individuals with DKD.
Some limitations must be considered. Taking our small sample size into account, our pilot study likely lacked the statistical power to detect significant differences in insulin sensitivity between the groups. Furthermore, our sample set was quite heterogenous considering the large variability in GDR-values we observed across participants as well as the difference between the two groups in terms of chronic diabetes complications, which may further impede statistical power in our study. However, despite the lack of statistical significance we still believe the difference observed in insulin resistance between the two groups to be clinically relevant. The strengths of the study include carefully characterized participants and reliable GDR measurements. Notably, our participants with DKD also had quite advanced kidney disease as nine out of ten had severe macroalbuminuria and reduced eGFR. Therefore, the present study sheds some new light on insulin resistance in advanced diabetic kidney disease in type 1 diabetes, to our knowledge not previously explored. Based on the results of our pilot study we estimate that to have 90% power to show a statistically significant difference (two-sided P < 0.05) in clamp-measured insulin sensitivity between two groups of adults with type 1 diabetes with and without DKD at least 21 individuals per group would be required.
Regarding the difference in eGDRs and our mGDRs, it is of note that our participants differed from the other studies subjects, from which the three eGDR formulae were derived. Compared to the other studies (Williams, Duca, Januszewski), our participants were older and had a longer diabetes duration. The glycemic control in our participants, especially in the DKD group, was also fairly good and markedly better than in the Williams study. The varying correlations may also be explained by the fact that eGDR-values poorly correlate with both mGDRs as well as with each other [4]. As all participants were white it is unclear how the results apply to other ethnic populations.
To conclude, our study implies that there is a likely increased insulin resistance in adult individuals with type 1 diabetes and DKD relative to those without DKD. Euglycemic clamps in larger cohorts are needed to confirm this, and to elucidate which eGDR-formulas may best predict insulin sensitivity in these individuals.
The reference list from the paper itself. Each links out to its DOI / PubMed record.
- 1C. Greenbaum, Insulin resistance in type 1 diabetes: Diabetes Metab Res Rev. 18, 192–200 (2002). 10.1002/dmrr.29110.1002/dmrr.29112112937 · doi ↗ · pubmed ↗
- 2K.V. Williams, J.R. Erbey, D. Becker, S. Arslanian, T.J. Orchard, Can clinical factors estimate insulin resistance in type 1 diabetes? Diabetes. 49, 626–632 (2000). 10.2337/diabetes.49.4.62610.2337/diabetes.49.4.62610871201 · doi ↗ · pubmed ↗
- 3L.M. Duca, D.M. Maahs, I.E. Schauer, B.C. Bergman, K.J. Nadeau, P. Bjornstad, M. Rewers, J.K. Snell-Bergeon, Development and validation of a method to estimate insulin sensitivity in patients with and without Type 1 diabetes. J Clin Endocrinol Metab. 101, 686–95 (2016). 10.1210/jc.2015-327210.1210/jc.2015-3272 PMC 488011526672636 · doi ↗ · pubmed ↗
- 4P. Bjornstad, J.K. Snell-Bergeon, M. Rewers, D. Jalal, M.B. Chonchol, R.J. Johnson, D.M. Maahs, Early diabetic nephropathy: a complication of reduced insulin sensitivity in type 1 diabetes. Diabetes Care. 36, 3678–3683 (2013). 10.2337/dc 13-063110.2337/dc 13-0631 PMC 381687224026551 · doi ↗ · pubmed ↗
- 5A. Alqallaf, P. Swan, N.G. Docherty, Renal insulin resistance in type 2 diabetes mellitus and progression of chronic kidney disease: potential pathogenic mechanisms. Expert Rev Endocrinol Metab. 17, 523–532 (2022). 10.1080/17446651.2022.213153410.1080/17446651.2022.213153436203374 · doi ↗ · pubmed ↗
- 6M.-T. Liao, C.-C. Sung, K.-C. Hung, C.-C. Wu, L. Lo, K.-C. Lu, Insulin Resistance in Patients with Chronic Kidney Disease. J Biomed Biotechnol. 2012, 691369 (2012). 10.1155/2012/69136910.1155/2012/691369 PMC 342035022919275 · doi ↗ · pubmed ↗
- 7A.V. Ekstrand, P.H. Groop, C. Grönhagen-Riska, Insulin resistance precedes microalbuminuria in patients with insulin-dependent diabetes mellitus. Nephrol Dial Transplant. 13, 3079-83 (1998). 10.1093/ndt/13.12.307910.1093/ndt/13.12.30799870469 · doi ↗ · pubmed ↗
- 8L.A. Inker, D.N. Eneanya, J. Coresh, H. Tighiouart, D. Wang, Y. Sang, D.C. Crews, A. Doria, M.M. Estrella, M. Froissart, M. Grams, E. Greene, T. Grubb, A. Gudnason, V. Gutiérrez, O.M. Kalil, R. Karger, A.B. Mauer, M. Navis, G. Nelson, R.G. Poggio, E.D. Rodby, R. Rossing, P. Rule, A.D. Selvin, E. Seegmiller, J.C. Shlipak, M.C. Torres, V.E. Yang, W. Ballew, S.H. Couture, S.J. Powe, N.R. Levey et al., A.S, Chronic Kidney Disease Epidemiology Collaboration: New Creatinine- and Cystatin C-Based Equat · doi ↗ · pubmed ↗