Urinary bacterial spectrum and antibiotic resistance trends at a Urology Clinic in Hungary between 2012 and 2023
Ádám Miklós Fehér, Milad Safikhani, Zoltán Bajory, Andrea Lázár, Katalin Burián, Ferenc Rárosi, Béla Köves

TL;DR
This study tracks changes in urinary bacteria and antibiotic resistance in Hungary from 2012 to 2023, showing shifts in bacterial prevalence and resistance patterns.
Contribution
The study provides a detailed 11-year analysis of urinary bacterial resistance trends in a Hungarian urology clinic, highlighting the impact of antibiotic stewardship.
Findings
Escherichia coli decreased from 53% to 40% while Proteus mirabilis increased from 4% to 6%.
Resistance to several antibiotics decreased for multiple bacteria, but Klebsiella pneumoniae showed increased resistance to fosfomycin.
Extended-spectrum beta-lactamase-producing bacteria and Clostridioides difficile infections declined significantly.
Abstract
Widespread antibiotic use has promoted a concerning rise in bacterial resistance. To counteract this trend and improve the effectiveness of antibiotic treatments, implementing antibiotic stewardship and an active surveillance system is crucial. Our primary aim was to analyze the local urinary bacterial spectrum and antibiotic resistance trends. All positive urine culture results (9423) obtained between January 1, 2012 and December 31, 2023 at the Urology Department, University of Szeged were analyzed. Spearman’s rank correlation test was then used to examine changes in bacterial spectrum, resistance trends of the five most common bacteria, and incidences of multidrug-resistant strains and nosocomial Clostridioides difficile infections. The proportion of Escherichia coli decreased significantly from 53 to 40% (p < 0.001), whereas that of Proteus mirabilis increased from 4 to 6% (p =…
Genes, proteins, chemicals, diseases, species, mutations and cell lines named across the full text — each resolved to its canonical identifier and authoritative record.
Click any figure to enlarge with its caption.
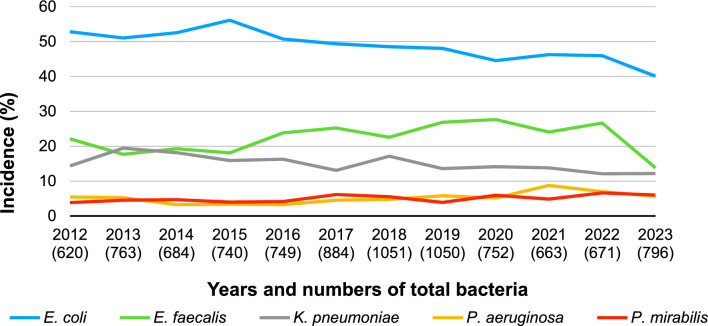 Figure 1
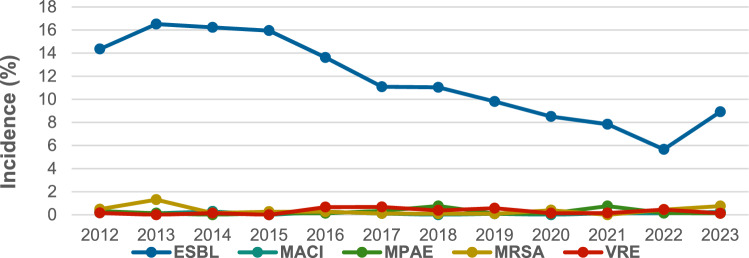 Figure 2
- —https://doi.org/10.13039/501100015763Szegedi Tudományegyetem
- —University of Szeged
Peer Reviews
No public reviews on file for this paper yet. If you reviewed it on a platform where reviews are public (OpenReview, ICLR, NeurIPS, ICML), you can paste yours below so the community can read it here.
Videos
No videos yet. Explain this paper in a talk, walkthrough, or lecture? Add one.
Taxonomy
TopicsUrinary Tract Infections Management · Bacterial Identification and Susceptibility Testing · Antibiotic Resistance in Bacteria
Introduction
The increasing trend in antimicrobial resistance (AMR) has emerged as a worldwide problem that negatively impacts both healthcare systems and economies. Without the development of novel antibiotics in the near future, several patients may not receive effective treatment for multidrug-resistant (MDR) bacterial infections.
Urinary tract infections (UTIs) are among the most common diseases caused by bacterial infections, affecting up to 27% of the healthy adult population. The prevalence UTIs is even higher among elderly and institutionalized individuals (15–50%) who are also more vulnerable to complications [1]. Managing MDR UTIs in hospitals is becoming increasingly challenging, which can prolong the duration of antibiotic treatments, extended hospitalization, raise costs, and increased mortality rates [2]. In the United States alone, the total expenses associated with UTIs, including medications, hospital care, and missing workdays, exceed $5 billion [3].
Therefore, understanding and analyzing the local bacterial spectrum and resistance have become a priority, which allows clinicians to provide more accurate treatments that decrease morbidity and mortality rates and costs. Moreover, effective antibiotic stewardship remains crucial in slowing the emergence of resistant strains. The current study aimed to retrospectively analyze the longitudinal trends in our local urinary culture data and compare them to those observed in other regional results.
Materials and methods
Ethical considerations
The single-center, retrospective observational study was conducted in accordance with the Declaration of Helsinki and the principles of Good Clinical Practice and was approved by the local ethics committee (44/2023-SZTE RKEB, approved: 20-Mar-2023).
All positive urine culture results collected between January 1, 2012 and December 31, 2023 from the Urology Department, University of Szeged were analyzed. We analyzed outpatient and inpatient samples, as well as the prevalence of nosocomial C. difficile infections. All data were collected from the electronic medical records (MedBakter, Asseco Magyarország) of the Department of Medical Microbiology, University of Szeged. The five most common bacteria strains were evaluated.
Urine culture method
After obtaining the urine samples at the Department of Urology, boric acid containers were used to transform them to the Department of Medical Microbiology. Inoculation was performed using a 0.01-mL loop onto URISELECT (BioRad) agar media. Samples were incubated at 35 ± 2 °C in normal atmosphere. Bacteria were identified using a matrix-assisted laser desorption ionization time-of-flight mass spectrometry system (MALDI-TOF MS) device (Bruker Daltonics Gmbh) since July 2012. Before July 2012, conventional biochemical tests or the VITEK 2 automated system (Biomerieux) were used for bacterial identification. Antibiotic sensitivity tests were performed using the disc diffusion test method according to the current standards of the European Committee on Antimicrobial Susceptibility Testing (EUCAST) [4].
The following MDR bacteria were detected: extended-spectrum beta-lactamase (ESBL)-producing bacteria, multiresistant Acinetobacter baumannii (MACI), multiresistant Pseudomonas aeruginosa (MPAE), methicillin-resistant Staphylococcus aureus (MRSA), and vancomycin-resistant Enterococcus (VRE).
Statistical analysis
Continuous variables were expressed as mean ± SD, whereas categorical data were expressed as number of cases (frequency) and percentage (relative frequency). Spearman’s rank correlation analysis was used to examine overall tendencies in incidence rates and year and antibiotic resistance rates and year. Sign (tendency) and significance of the Spearman’s rank correlation coefficients were evaluated. All analyses were conducted using IBM SPSS Statistics version 29.0.0.0 (241), with p values < 0.05 indicating statistical significance.
Results
During the 12-year period, 8596 positive urine cultures with 9423 bacterial isolates were collected and evaluated. Among the 827 cases included, more than one bacterium had been detected simultaneously. The annual number of the positive samples generally increased from 2012 to 2019; however, the COVID-19 pandemic caused a significant drop in the number of positive samples until 2023, when the number of positive samples started to increase again.
Bacterial spectrum
The proportion on Gram-negative and -positive bacteria remained relatively stable during the 12-year period (~ 75% vs. ~ 25%, respectively). The five most commonly detected bacterial species (Escherichia coli, Enterococcus faecalis, Klebsiella pneumoniae, P. aeruginosa, and Proteus mirabilis) were statistically analyzed in terms of their yearly distribution (Fig. 1) and antibiotic resistance.Fig. 1. Yearly incidence of the five most common bacteria
The most frequently detected bacterium was E. coli, with an incidence rate of approximately 50%. However, its proportion significantly declined from 53 to 40% (Spearman’s rho = − 0,930, very strong negative tendency, 95% CI − 0.981, − 0.764, p < 0.001). The overall proportions of E. faecalis and K. pneumoniae also decreased (from 22 to 14% and from 14 to 12%, respectively), but only the latter showed a significant trend (Spearman’s rho = − 0.748, strong negative tendency, 95% CI − 0.925, − 0.305, p = 0.005). In contrast, the proportion of P. aeruginosa slightly increased (from 5 to 6%, p = 0.051), whereas that of P. mirabilis significantly increased (from 4 to 6%, Spearman’s rho = 0.664, strong positive tendency, 95% CI 0.146, 0.896, p = 0.018). These five bacterial species were detected in more than 95% of the samples throughout the study period, except in 2023 (~ 78%).
Among MDR bacteria, the ESBL-producing strains decreased significantly over the 12-year period, declining from 14.35% to 8.92% by 2023 (Spearman’s rho = − 0,916, very strong negative tendency, 95% CI − 0.977, − 0.721, p < 0.001). MRSA exhibited a single spike in detection in 2013 (10/763 bacteria, 1.31%); otherwise, its presence remained between 0% and 0.75% (Fig. 2).Fig. 2. Incidence of MDR bacteria. ESBL extended spectrum of beta-lactamase, MACI multiresistant Acinetobacter baumannii, MPAE multiresistant Pseudomonas aeruginosa, MRSA methicillin-resistant Staphylococcus aureus, VRE vancomycin-resistant Enterococcus
Moreover, nosocomial C. difficile infections were also observed, with the annual number decreasing from 17 to 6 cases between 2013 and 2023.
Antibiotic resistance trends
Clinically relevant antibiotics, such as amoxicillin/clavulanic acid (AMC), cefuroxime, ceftriaxone, cefepime, ciprofloxacin, gentamicin, imipenem, ertapenem, meropenem, trimethoprim/sulfamethoxazole (TMP/SMX), fosfomycin, and nitrofurantoin, and their effectiveness were evaluated according to the current EUCAST breakpoints. The “intermediately susceptible” category was reported as susceptible in our results [4]. Detailed annual data and trends are shown in Tables 1, 2, 3, 4, and 5. We only highlight significant changes or important data informing antibiotic policy in the text.
E. coli
Our results showed a decline in all examined antibiotic resistance rates, except for fosfomycin (Table 1). Resistance to AMC and cefuroxime decreased significantly from 24.67% to 18.18% (Spearman’s rho = − 0.699, strong negative tendency, 95% CI −0.908; − 0.209, p = 0.011) and from 15.61% to 13.21% (Spearman’s rho = − 0.615, strong negative tendency, 95% CI − 0.879, − 0.064, p = 0.03, p = 0.033), respectively. Gentamicin resistance decreased from 12% to 5.64% (Spearman’s rho = − 0.853, very strong negative tendency, 95% CI − 0.958, − 0.547, p < 0.001). Nitrofurantoin and fosfomycin resistance rates remained generally low (2.44% and 3.15%, in 2023, respectively), although the latter was rarely tested. Among the carbapenems, ertapenem was primarily tested, which showed a resistance rate of 0%. Table 1. Yearly resistance rates of E. coli (EC)ECAMCCFXCTXCIPGMERTTMP/SMXFMNF%nN%nN%nN%nN%nN%nN%nN%nN%nN201224.677430015.614730113.954230133.3310030012.00363000029928.67822860036.4019297201321.497534914.615134912.934534836.6812834910.95383470034734.051113267.142284.3515345201419.816432315.485032314.814832438.2712432412.46403210032429.199432200185.3817316201518.427038015.495938114.445538140.4215438112,07463810038137.401413774,171243.4513377201618.956534316.035534315.455334341.1114134311.37393430034339.651363432.781361.184339201717.306839313.995539312.985139349.231933926.87273930039335.6413939000450.522388201819.108544515.286844514.386444540.221794457.21324440044533.0314543900571.597439201921.589343117.877743116.247043140.931764309.05394310043137.211604304.413681.416425202015.164227712.413427411.913327731.05862778.00222750027732.25892763.331302.958271202113.313324811.292824810.082524825.81642486.48162470024840.7310124800282.857246202216.874124311.522824311.112724324.69602434.94122430024330.177324200302.526238202318.185831913.214231812.544031922.57723195.64183190031926.18833172.441413.1510312Δ, rho, p− 6.49− 0.6990.011− 2.40− 0.6150.033− 1.41− 0.5170.085− 10.76− 0.4900.106− 6.36− 0.853**< 0.001**0––− 2.49− 0.0280.9312.44− 0.1270.694− 3.25− 0.4480.145AMC amoxicillin/clavulanic acid, CFX cefuroxime, CTX ceftriaxone, CIP ciprofloxacin, GM gentamicin, ERT ertapenem, TMP/SMX trimethoprim/sulfamethoxazole, FM fosfomycin, NF nitrofurantoin, Δ difference between 2012 and 2023, rho Spearman’s correlation coefficient, p trend significance
E. faecalis
E. faecalis exhibits intrinsic susceptibility to aminopenicillin derivatives and resistance to cephalosporins. Resistance rates to high-dose gentamicin significantly decreased from approximately 45%–50% to 30% (Spearman’s rho = − 0.790, strong negative tendency, 95% CI − 0.938, 0.395, p = 0.002). Owing to its high resistance rates, TMP/SMX was tested only until 2014, according to EUCAST guidance (Table 2). Table 2. Yearly resistance rates of E. faecalis (EF)EFCIPGMTMP/SMXNF%nN%nN%nN%nN201245.4551144.005512541.773379001192013N.dN.dN.d49.596012142.984911400106201420.99178159.66711190090.911110201530.003010053.6666123N.dN.dN.d0.821122201624.823413748.1377160N.dN.dN.d1.312153201748.709419348.2697201100110.511197201838.658020746.6397208N.dN.dN.d0.982205201939.589524042.50102240N.dN.dN.d1.283235202030.125016629.6551172N.dN.dN.d00147202132.814212834.1144129N.dN.dN.d00126202218.382513628.0639139N.dN.dN.d0.781129202320.182210930.0033110N.dN.dN.d00103Δ, rho, p− 25.27− 0.3640.27214.00− 0.7900.002–––0− 0.1090.737CIP ciprofloxacin, GM gentamicin, TMP/SMX trimethoprim/sulfamethoxazole, NF nitrofurantoin, Δ difference between 2012 and 2023, rho Spearman’s correlation coefficient, p trend significance, n.d. no data
K. pneumoniae
Baseline resistance rates of K. pneumoniae were high, exceeding 60% for most antibiotics, except for fosfomycin and ertapenem. However, significant decreases were observed for AMC (Spearman’s rho = − 0.909, very strong negative tendency, 95% CI − 0.975, − 0.701, p < 0.001), cefuroxime (Spearman’s rho = − 0.944, very strong negative tendency, 95% CI − 0.985, −0.808, p < 0.001), ceftriaxone (Spearman’s rho = −0.909, very strong negative tendency, 95% CI: −0.975, −0.701, p < 0.001), ciprofloxacin (Spearman’s rho = − 0.923, very strong negative tendency, 95% CI: −0.979, −0.742, p < 0.001), gentamicin (Spearman’s rho = −0.965, very strong negative tendency, 95% CI − 0.990, − 0.877, p < 0.001), and TMP/SMX (Spearman’s rho = − 0.895, very strong negative tendency, 95% CI − 0.970, − 0.660, p < 0.001). Fosfomycin resistance rates increased significantly (Spearman’s rho = 0.879, very strong positive tendency, 95% CI 0.616, 0.966, p < 0.001), whereas ertapenem resistance rates remained below 2% (Table 3). Table 3. Yearly resistance rates of K. pneumoniae (KP)KPACMCFXCTXCPCIPGMERTTMP/SMXFM%nN%nN%nN%nN%nN%nN%nN%nN%nN201267.90558168.29568265.85548276.92101371.95598262.344877008270.13547814.29214201365.418713366.678813265.41871331009969.929313353.54681271.54213062.507512020.001365201468.757711266.077411266.0774112N.dN.dN.d71.438011252.73581100.90111166.677411140.352357201567.597310865.427010765.74711081002273.157910851.85561080010863.896910840.002050201659.096511056.366211054.556011075.003462.736911044.55491100011063.306910940.002050201751.925410445.194710445.19471041005562.506510448.0850104N.dN.dN.d58.656110458.331424201837.345915835.445615835.4456158502446.207315833.54531580015849.687815743.591739201931.973912231.153812231.1538122501239.344812218.03221220.82112227.873412253.131732202035.23318835.23318834.09308800132.95298827.272488008840.91368850.001224202140.54307440.54307439.19297400140.54307424.3218741.3517444.59337446.671430202217.19116417.46116315.63106400122.2214639.386641.5616423.44156460.00915202330.93309728.87289727.842797N.dN.dN.d29.90299714.4314971.0319737.89369575.002128Δ, rho, p− 36.97− 0.909**< 0.001**− 39.42− 0.944**< 0.001**− 38.01− 0.909**< 0.001**–––− 42.05− 0.923**< 0.001**− 47.91− 0.965**< 0.0011.030.3620.276− 32.24− 0.895< 0.00160.710.879< 0.001**AMC amoxicillin/clavulanic acid, CFX cefuroxime, CTX ceftriaxone, CP cefepime, CIP ciprofloxacin, GM gentamicin, ERT ertapenem, TMP/SMX trimethoprim/sulfamethoxazole, FM fosfomycin, Δ difference between 2012 and 2023, rho Spearman’s correlation coefficient, p = trend significance, n.d. no data
P. aeruginosa
Resistance to AMC, cefuroxime, ceftriaxone, ertapenem, TMP/SMX, nitrofurantoin, and fosfomycin was not evaluated due to the intrinsic resistance of P. aeruginosa to such drugs. Ciprofloxacin resistance rates showed the most substantial decrease across the study period (50.18%), with the decreased being highly significant (Spearman’s rho = − 0.839, very strong negative tendency, 95% CI − 0.954, − 0.511, p = 0.001). Gentamicin only had EUCAST guidance until 2020, although it showed a significant 46.52% decrease (Spearman’s rho = − 0.794, strong negative tendency, 95% CI − 0.949, − 0.329, p = 0.006). Imipenem and meropenem had similar resistance rates, varying irregularly across a wide range (0–34.09%) (Table 4). Table 4. Yearly resistance rates of P. aeruginosa (PA)PACPCIPGMIMIMER%nN%nN%nN%nN%nN201229.0393161.29193158.06183122.5873125.818312013003661.11223638.89143613.895368.333362014002065.00132045.0092015.00320002020154.3512356.52132352.17122321.745238.70223201618.1842268.18152245.45102213.6432218.1842220178.3333616.6763613.8953611.1143611.11436201825.00114447.73214434.09154434.09154429.55134420193.8525232.69175211.546525.773527.6945220209.3833215.635320093.131323.13132202114.8974729.79144733.331327.66134729.79144720225.4123716.22637N.dN.dN.d5.412372.7013720236.6734511.11545N.dN.dN.d17.7884515.56745Δ, rho, p− 22.360.0740.820− 50.18− 0.839** < 0.001**− 46.52− 0.7490.006− 4.80− 0.2380.457− 10.250.0070.983CP* cefepime, CIP ciprofloxacin, GM gentamicin, IMI imipenem, MER meropenem, Δ difference between 2012 and 2023, rho Spearman’s correlation coefficient, p trend significance, n.d. no data*Partial results
P. mirabilis
The resistance rates to AMC, cefuroxime, and ceftriaxone followed a similar pattern such that a slight initial increase followed by a decrease until 2022 was noted. In 2023, resistance rates tended to increase, although a significant overall increase was only observed for AMC (Spearman’s rho = − 0.666, strong negative tendency, 95% CI − 0.897, − 0.149, p = 0.018). Ciprofloxacin resistance did not significantly change (p = 0.145) and remained high at around 50%. Ertapenem resistance was detected in only one strain. TMP/SMX resistance rates consistently remained above 50%, although a significant decrease was observed (Spearman’s rho = − 0.650, strong negative tendency, 95% CI − 0.891, − 0.121, p = 0.022). Fosfomycin resistance rates remained high throughout the study, although testing was only performed on a subset of isolates (Table 5). Table 5. Yearly resistance rates of P. mirabilis (PM)PMACMCFXCTXCIPGMERTTMP/SMXFM%nN%nN%nN%nN%nN%nN%nN%nN201245.45102245.45102245.45102250112227.27622002290182033.3313201341.94133135.48113135.48113145.1614316.45231003160.71172820.0015201455.17162951.72152951.72152955.17162937.931129002979.312329006201566.67182766.67182762.96172770.37192718.52527002770.37192763.64711201639.29112835.71102832.1492846.43132821.43628002889.29252850.0024201757.14284955.10274951.02254961.22304920.831048004981.25394835.71514201843.14225144.00225043.14225160.78315113.737511.9615062.75325150.00714201940.00143540.00143531.43113537.14133522.86835003557.14203554.55611202037.84143737.84143737.84143737.84143729.731137003762.16233766.67812202126.9272626.9272626.9272642.31112615.38426002669.23182671.4357202228.57103528.57103528.57103542.86153534.291235003554.29193533.3339202340.00184538.30184737.50184847.92234816.67848004858.33284861.111118Δ, rho, p− 5.45− 0.6660.018− 7.15− 0.4690.124− 7.95− 0.5590.059− 2.08− 0.4480.145− 10.60− 0.0140.96600.0440.893− 31.67− 0.6500.02227.780.5680.054AMC amoxicillin/clavulanic acid, CFX cefuroxime, CTX ceftriaxone, CIP ciprofloxacin, GM gentamicin, ERT ertapenem, TMP/SMX trimethoprim/sulfamethoxazole, FM fosfomycin, Δ difference between 2012 and 2023, rho Spearman’s correlation coefficient, p trend significance
Discussion
Antibiotic resistance is an emerging problem worldwide, highlighting the importance of identifying local bacterial spectrum and antibiotic resistance. To ensure appropriate and cost-effective antimicrobial treatment, strict antibiotic stewardship and surveillance must be implemented locally. Regarding Hungarian studies, Gajdács et al. evaluated E. coli, Klebsiella species [5], and Gram-positive cocci [3] in UTIs between 2008 and 2017, while the most similar single-center analysis of urinary bacterial flora and AMR rates (2004–2015) was performed by Magyar et al. [6]. The following comparison with our results was limited to the years that coincided with the timeframe of these investigations.
Our results showed a significant decrease in the prevalence of E. coli and K. pneumoniae but a significant increase in that of while P. mirabilis. The observed bacterial spectrum was similar to previously published regional results, which showed that E. coli was the most prominent strain followed by E. faecalis, K. pneumoniae, P. aeruginosa, and P. mirabilis [5–9].
Among the MDR species, the prevalence of ESBL bacteria decreased significantly, which was contrary to a similar study by Magyar et al. [6]. Gajdács et al. found a pronounced elevation in the prevalence of MRSA in the second half of the study period, which was not consistent with in our results [3]. Evidence has shown that in almost every second of hospital admission, inappropriate antibiotics have been selected, leading to higher costs, longer hospitalization, and increased mortality rates and incidence of nosocomial infections, such as C. difficile [1]. However, our findings showed a decrease in incidence rates of C. difficile. These results may be attributed to our revised local antibiotic policy introduced around 2016, which mostly replaced the previously used prolonged fluoroquinolone-based preoperative antibiotic prophylaxis with single-shot cephalosporins. Contrary to this, some procedures (e.g., prostate biopsy) have been performed under fluoroquinolone prophylaxis even later. In accordance with this, our study showed a decrease in fluoroquinolone and cephalosporin resistance trends compared to others [5,6], meanwhile fluoroquinolone resistance rates in our country have generally been high (26% for E. coli and 38% for K. pneumoniae) in 2023 [10].
Resistance rates of E. coli to AMC decreased significantly, while others found varying AMR rates (14–35%) [6]. We found relatively low cephalosporin resistance rates (~ 15%), nonetheless significant decrease was only observed in cefuroxime. Ceftriaxone AMR rates were lower in other studies [5,6], except for inpatients [5]. Despite this, our ceftriaxone resistance rate was still superior to the national average in 2023 (12.54% vs. 21.3%) [10]. We found the lowest resistance rates (~ 5%) to gentamicin with a significant decreasing trend among the E. coli strains, similarly to the other studies [5,6], except for inpatients, where up to ~ 20% AMR was seen [5]. Ertapenem was extremely efficient against E. coli similarly to others [5,6]. E. coli showed high susceptibility to nitrofurantoin, which aligns with previous findings [5,6], even in ESBL or AmpC beta-lactamase producers [11]. The low resistance rate to fosfomycin has been supported by a local randomized controlled trial, which administered empiric fosfomycin prophylaxis before transrectal prostate biopsy, with no E. coli infections having developed at all after the surgery [12].
AMC is mostly limited to Gram-positive infections, with the most prominent E. faecalis having excellent susceptibility to aminopenicillin [3, 6]. Ciprofloxacin resistance rates were similar or higher [3, 6], except for inpatients in Gajdács et al. study [3]. E. faecalis showed a significant decrease in resistance rates to gentamicin and showed low AMR rates to nitrofurantoin, which aligns with others’ results [6].
K. pneumoniae showed significant decrease in resistance trend of AMC; however, the overall AMR rate was high, similarly to another study [6]. Resistance rates of K. pneumoniae to cefuroxime and ceftriaxone decreased significantly. In 2023, AMR rates of K. pneumoniae reached > 25% again; however, resistance rates to ceftriaxone were still better than the national average (27.84% vs. 42.0%) [10]. The incidence of fluoroquinolone-resistant K. pneumoniae decreased significantly during the study period (from 71.95% to 29.90%); however, more favorable data were reported by others [5,6]. Besides the significant decrease, we found high TMP/SMX resistance rate during the study period, which was similar to that observed in another study [5]. Magyar et al. published fluctuating results [6]. Our findings showed a significant increase in resistance rates of K. pneumoniae to fosfomycin. Moreover, our AMR rates to fosfomycin in the Klebsiella strains were much higher than in the studies by other authors. [5,6].
The incidence of fluoroquinolone-resistant P. aeruginosa decreased pronouncedly over the study period, resulting 11.11% AMR rate in 2013, concurrently the national resistance rate was mostly < 25% [10]. Compared to our results, Magyar et al. found much lower AMR rates to ciprofloxacin and gentamicin [6]. P. aeruginosa had moderate but fluctuating resistance to cefepime, meropenem, and imipenem, similarly to the findings of Magyar et al. [6].
The resistance trend of P. mirabilis to AMC decreased significantly, although the annual resistance rates remained high especially compared to another study [6]. Magyar et al. found 0% ceftriaxone AMR rate, while our data showed ~ 35–63% during the overlapping years. Although resistance rates of P. mirabilis decreased significantly, we found higher than 20% AMR rate similarly to Gajdács et al.[5]. However, P. mirabilis showed excellent susceptibility to ertapenem, equally to the results of Magyar et al. [6].
Our findings align with the recommendations of the EAU Guidelines [1]. Empiric use of aminopenicillin is not suggested due to the high AMR rates or negative ecological impact; however, combining with beta-lactamase inhibitors, the preoperative prophylactic use continues to be considered a feasible alternative. Nitrofurantoin and fosfomycin remain useful options for the empiric treatment of uncomplicated lower UTIs, although increased AMR rates, especially in K. pneumoniae strains, raise concern. As such, TMP/SMX should only be used when the local resistance rate is below 20%. Except the decreased ciprofloxacin resistance rates observed by our study, the overall AMR rates were high. Moreover, fluoroquinolones are mainly restricted to outpatients with uncomplicated pyelonephritis and prostatitis due to their unfavorable side-effect profile [13]. Cephalosporins seem to be suitable for empiric preoperative prophylaxis, especially considering that our AMR rates have decreased even with their continued use. However, severe UTI or urosepsis requires broad-spectrum empiric antibiotics (e.g., cefepime, AMC + gentamicin, or carbapenems) [1].
Conclusion
We found mostly decreasing AMR rates during the study period. The only significantly increasing trend was observed in case of K. pneumoniae strains to fosfomycin, which should be carefully considered by clinicians. Our results have also shown a decrease in the incidence of MDR bacteria and C. difficile. Resistance patterns could be different even in a small country such as Hungary; thus, the knowledge of the local urinary bacterial flora and AMR rates must be crucial. Overall, this research underscores the importance of appropriate antibiotic stewardship, ongoing surveillance, and adaptability in the ongoing fight against antibiotic resistance, which might influence our opportunities in the near future.
Limitations
Given the changes in the EUCAST breakpoints tables, resistance rates of some strains were no longer evaluated after a certain period. In addition, resistance rates of some strains were less likely tested due to clinical irrelevancy or financial reasons. Occasionally, more than one sample was obtained from a patient at the same time (e.g., different locations: catheter and nephrostomy). In these cases, regarding the five most common species, only in a few samples (0.84%) were identical strains detected, which probably has no significant impact on the results. Our antibiotic policy shifting was implemented as a long process around 2016. For this reason, specific date or year cannot be assigned between our previous and modified antibiotic stewardship. The retrospective design and the longer antibiotic policy shifting process may affect the causality inference of the favorable AMR rates. During the COVID-19 pandemic (2020–2021), a reduction in the number of urine cultures and elective hospital admissions was observed, which could have affected our results.
The reference list from the paper itself. Each links out to its DOI / PubMed record.
- 1The European Committee on Antimicrobial Susceptibility Testing. Breakpoint tables for interpretation of MI Cs and zone diameters, version 2.0, 2012- version 13.1, 2023: https://www.eucast.org
- 2ECDC—European Centre for Disease Prevention and Control, https://atlas.ecdc.europa.eu/public/index.aspx. Accessed 06 Mar 2025