Identification of endogenous reference genes for RT-qPCR analysis in breast cancer and matched adjacent tissues
Yue Meng, Ya-Wen Wang, Zhi-Bao Xu, Zhong-Qi Qiao, Can Liu, Yan-Duo Chen, Yao Xu, Kai Zhang

TL;DR
This study identifies suitable reference genes for RT-qPCR in breast cancer and adjacent tissues to improve gene expression analysis.
Contribution
The study evaluates and identifies stable reference genes specifically for breast cancer and matched adjacent tissues.
Findings
TFRC was identified as the most stable reference gene in cancer tissues.
Adjacent tissues showed higher Ct values and less stability in reference genes.
18S rRNA and TFRC are suggested as suitable reference genes for breast cancer tissues.
Abstract
Real-time quantitative PCR (RT-qPCR), essential for gene expression and biomarker studies, requires stable endogenous reference genes (RGs) for normalization. This study aimed to identify consistently expressed RGs in breast cancer and adjacent tissues to facilitate comparative analyses of breast cancer-related gene expression. Five candidate RGs (β-actin, 18S rRNA, PUM1, RPLP0, TFRC) were analyzed by RT-qPCR from 30 breast cancer patients. Threshold cycle (Ct) values were evaluated using descriptive statistics, and stability of RGs was assessed using RefFinder, integrating GeNorm, NormFinder, ΔCt, and BestKeeper algorithms. In cancer tissues, descriptive statistics showed that 18S rRNA was a suitable RG (Ct Range = 3.96; Mean Ct=8.43; SD = 0.84). RefFinder identified TFRC as the most stable RG (GM = 1.19), followed by 18S rRNA (GM = 1.41). In adjacent tissues, TFRC was find with its…
Genes, proteins, chemicals, diseases, species, mutations and cell lines named across the full text — each resolved to its canonical identifier and authoritative record.
Click any figure to enlarge with its caption.
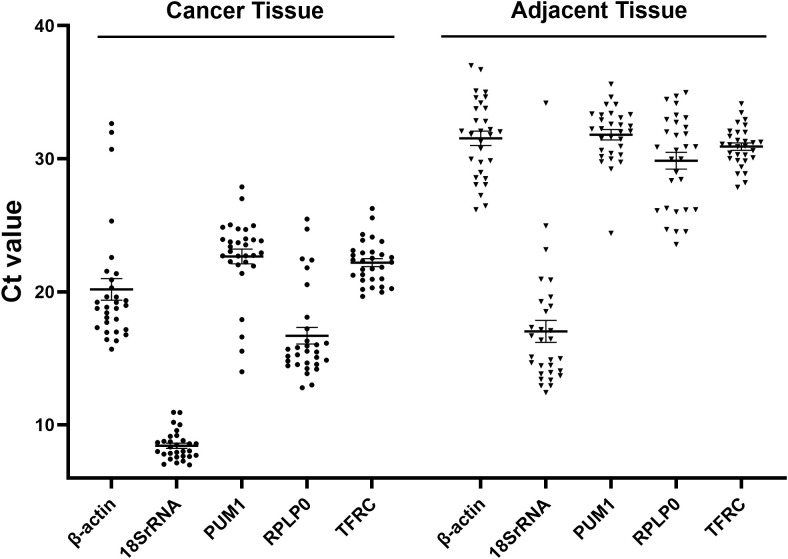 Figure 1
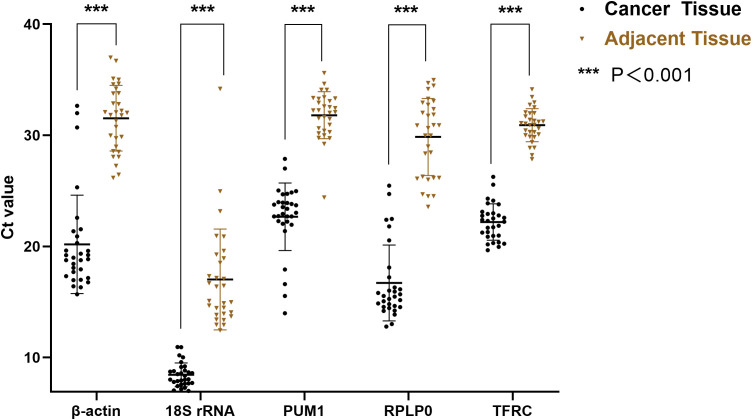 Figure 2
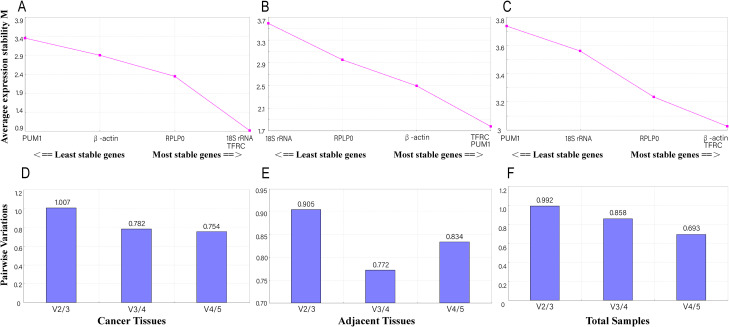 Figure 3
| Cancer tissue | Adjacent tissue | ||||||||
|---|---|---|---|---|---|---|---|---|---|
| Gene symbol | Ct min | Ct max | Ct range | Mean or median* | Gene symbol | Ct min | Ct max | Ct range | Mean or median* |
| β-actin | 15.69 | 32.65 | 16.96 | 18.91 | β-actin | 26.17 | 37.00 | 10.83 | 31.93 |
| 18S rRNA | 6.98 | 10.94 | 3.96 | 8.19 | 18S rRNA | 12.43 | 34.18 | 21.75 | 15.74 |
| PUM1 | 13.98 | 27.88 | 13.90 | 23.21 | PUM1 | 24.40 | 35.61 | 11.21 | 32.16 |
| RPLP0 | 12.78 | 25.47 | 12.69 | 15.51 | RPLP0 | 23.56 | 34.97 | 11.41 | 29.85 |
| TFRC | 19.65 | 26.26 | 6.61 | 22.19 | TFRC | 27.85 | 34.14 | 6.29 | 30.91 |
| Cancer tissues | |||||||||||
|---|---|---|---|---|---|---|---|---|---|---|---|
| Reference gene | GeNorm | NormFinder | BestKeeper | Δ Ct | RefFinder | ||||||
| M | Rank | SV | Rank | SD | CV | Rank | Avg.Ct | Rank | GM | Rank | |
| β-actin | 2.899 | 4 | 3.068 | 3 | 3.05 | 15.11 | 5 | 3.81 | 4 | 5.00 | 5 |
| 18S rRNA | 0.912 | 1 | 0.456 | 1 | 0.84 | 9.93 | 1 | 2.58 | 2 | 1.41 | 2 |
| PUM1 | 3.347 | 5 | 3.641 | 5 | 2.00 | 8.85 | 3 | 4.02 | 5 | 3.46 | 3 |
| RPLP0 | 2.341 | 3 | 3.136 | 4 | 2.61 | 15.61 | 4 | 3.76 | 3 | 3.46 | 3 |
| TFRC | 0.912 | 1 | 0.456 | 1 | 1.29 | 5.83 | 2 | 2.56 | 1 | 1.19 | 1 |
| Adjacent tissues | |||||||||||
| Reference gene | GeNorm | NormFinder | BestKeeper | Δ Ct | RefFinder | ||||||
| M | Rank | SV | Rank | SD | CV | Rank | Avg.Ct | Rank | GM | Rank | |
| β-actin | 2.492 | 3 | 2.375 | 3 | 2.42 | 7.69 | 3 | 3.47 | 3 | 3.00 | 3 |
| 18S rRNA | 3.596 | 5 | 4.041 | 5 | 3.18 | 18.70 | 5 | 4.56 | 5 | 4.73 | 5 |
| PUM1 | 1.779 | 1 | 1.907 | 2 | 1.55 | 4.88 | 2 | 3.23 | 2 | 1.68 | 2 |
| RPLP0 | 2.953 | 4 | 2.497 | 4 | 2.96 | 9.91 | 4 | 3.63 | 4 | 4.23 | 4 |
| TFRC | 1.779 | 1 | 1.638 | 1 | 1.15 | 3.71 | 1 | 3.10 | 1 | 1.00 | 1 |
| Total samples | |||||||||||
| Reference gene | GeNorm | NormFinder | BestKeeper | Δ Ct | RefFinder | ||||||
| M | Rank | SV | Rank | SD | CV | Rank | Avg.Ct | Rank | GM | Rank | |
| β-actin | 3.555 | 4 | 2.763 | 2 | 6.27 | 24.26 | 4 | 3.85 | 3 | 3.13 | 4 |
| 18S rRNA | 3.101 | 3 | 2.938 | 4 | 4.30 | 33.83 | 1 | 3.95 | 4 | 2.63 | 3 |
| PUM1 | 2.364 | 1 | 2.887 | 3 | 4.69 | 17.33 | 3 | 3.83 | 2 | 2.06 | 2 |
| RPLP0 | 3.803 | 5 | 3.356 | 5 | 6.70 | 28.77 | 5 | 4.17 | 5 | 5.00 | 5 |
| TFRC | 2.364 | 1 | 1.288 | 1 | 4.36 | 16.43 | 2 | 3.21 | 1 | 1.19 | 1 |
Peer Reviews
No public reviews on file for this paper yet. If you reviewed it on a platform where reviews are public (OpenReview, ICLR, NeurIPS, ICML), you can paste yours below so the community can read it here.
Videos
No videos yet. Explain this paper in a talk, walkthrough, or lecture? Add one.
Taxonomy
TopicsMolecular Biology Techniques and Applications · Advanced biosensing and bioanalysis techniques · Gene expression and cancer classification
Highlights
TFRC and 18S rRNA are potential endogenous reference genes for breast cancer tissues.GeNorm, NormFinder, BestKeeper, and RefFinder were used to evaluate RGs.Integrating clinicopathological parameters enhances RGs selection for breast cancer.
Background
1
Breast cancer is the leading cause of cancer-related mortality among women, with 670,000 deaths annually. It ranks as the fourth most common cancer-related cause of death globally (1). In China, the incidence of breast cancer is the fourth highest, and it has been rapidly increasing since the 1990s, at a rate twice as fast as the global average, particularly in urban areas (2). Recent evidence also indicates a shift toward younger age at diagnosis, with an increasing proportion of cases occurring in younger women (3).
Traditional tumor characteristics such as tumor size, grade, and lymph node metastasis are insufficient for evaluating the treatment response and prognosis of breast cancer patients. Consequently, many studies have focused on identifying biomarkers for early diagnosis, treatment, and prognosis of breast cancer. Estrogen receptor (ER), progesterone receptor (PR), HER2, and Ki-67 are common markers for guiding adjuvant therapy (4). Standard methods for detecting qualitative biomarkers, such as immunohistochemistry (IHC) and enzyme-linked immunosorbent assay (ELISA), have been proven to be feasible (5). However, these methods are limited by their inability to quantify gene expression and their time-consuming nature. In contrast, RT-qPCR offers the potential to improve the accuracy of early breast cancer diagnosis and prognostic analysis. However, RT-qPCR results can be influenced by variations in initial sample size, RNA integrity, and reverse transcription efficiency (6). Endogenous reference genes (RGs) are genes whose expression remains relatively constant. It is essential to select appropriate RGs under specific experimental conditions to ensure accurate normalization.
Despite the importance of RGs, there is no consensus on the optimal RGs for gene expression studies in breast cancer. Several studies have identified some potential RGs. For instance, an analysis of 12 commonly used RGs across 23 cancer cell lines indicated that 18S rRNA is stable across a broad range of cancer types, while PUM1 was identified as a suitable RG for breast cancer (7). PUM1 has been reported as a reliable RG in both breast cancer and normal breast tissues (8, 9). Combining three RGs (TBP, RPLP0, and PUM1), or using PUM1 alone, is considered a suitable approach for normalizing gene expression in breast cancer and adjacent normal tissues (10). Other studies have suggested that β-actin is widely used as an RG in breast cancer research (11–14). RPLP0 and β-actin have also been shown to be stable RGs in breast cancer (15), remaining reliable even in paraffin-embedded and long-term cryopreserved samples (16).
For RT-qPCR data analysis, appropriate RGs are required for processing Ct values. Several algorithms, including geNorm (17), NormFinder (18), BestKeeper (19), and ΔCt (20), have been developed to assess the stability of RGs. These tools help identify the most suitable RGs under different experimental conditions, cell types, and tissues. The software RefFinder (21) integrates the results of above four algorithms to select the most appropriate RGs. RefFinder has been used in various cancer-related studies to identify suitable RGs, such as screening potential RGs for radiation therapy response in colorectal cancer (22) and identifying appropriate RGs in periprostatic adipose tissue under obesity and prostate cancer (23).
In this study, five commonly used RGs (β-actin, 18S rRNA, PUM1, RPLP0, and TFRC) were evaluated for their stability in breast cancer and matched adjacent tissues. RT-qPCR data were analyzed using the aforementioned algorithms. RefFinder was used to assess the expression stability of these five candidate RGs.
Materials and methods
2
Clinical samples
2.1
Breast cancer tissues and matched adjacent tissues were collected from thirty breast cancer patients at Qilu Hospital, Shandong University, between September 2017 and May 2018. Tumor tissue was histologically confirmed as malignant. The adjacent tissue was sampled from a macroscopically normal area located ≥2.0 cm from the visible tumor margin and was pathologically verified to be free of tumor cell infiltration (24–26). The tissues were rapidly frozen in liquid nitrogen and subsequently stored at -80 °C. This study was approved by the Ethics Committee of Qilu Hospital, Shandong University. The clinical and histopathological features of the patients are shown in Supplementary Table S1.
Selection criteria for RGs
2.2
The selection criteria for RGs included: (1) documented use or reported stability in breast cancer or related tissues; (2) representation of different biological categories; and (3) availability of primer pairs that passed preliminary specificity testing. The candidate RGs were pre-screened in four breast cancer cell lines (MDA-MB-231, BT-474, MCF-7, MDA-MB-468) and those showing stable Ct values were advanced to tissue-based stability validation.
RNA extraction and reverse transcription
2.3
Total RNA was extracted from the tissue samples using the RNA-easy Isolation Reagent (Vazyme, China). RNA concentration was determined using a spectrophotometer (SMA4000, Merinton, China). RNA was reverse transcribed into complementary DNA (cDNA) using the ProFlex™ PCR System (Applied Biosystems, USA), catalyzed by HiScript III RT SuperMix for qPCR (+gDNA wiper) (Vazyme, China).
Real-time quantitative PCR
2.4
The RT-qPCR reaction was performed using ChamQ SYBR qPCR Master Mix (Vazyme, China). The reaction conditions were as follows: initial denaturation for 30 seconds at 95 °C, followed by 40 cycles of denaturation for 10 seconds at 95 °C and annealing for 30 seconds at 60 °C, using the QuantStudio 3 PCR instrument (Applied Biosystems, USA). Each sample was repeated three times.
Data analysis
2.5
Statistical analysis was performed by SPSS 19.0 (IBM SPSS Statistics, Armonk, USA) and Graphpad Prism 9.0 (GraphPad Software, San Diego, USA). The normality of the Ct values was assessed using the Shapiro-Wilk test. T-tests or non-parametric tests were employed to examine the differential expression of candidate RGs between breast cancer tissues and matched adjacent tissues. Samples were categorized into subgroups based on clinical and histopathological parameters, and differences in Ct values were evaluated using 2-way ANOVA. P< 0.05 was considered statistically significant.
Five candidate RGs were analyzed using RefFinder, an online tool for the comprehensive evaluation of RGs. RefFinder integrates four widely used algorithms—geNorm, NormFinder, BestKeeper, and ΔCt—to assess the stability of potential RGs (20).
GeNorm is used to evaluate the expression stability of genes across different samples. The Ct values of candidate RGs are converted into M values (average expression stability), with lower M values indicating more stable expression. If the M value exceeds 1.5, the gene is considered unsuitable as an RG. Additionally, the optimal number of RGs is determined by calculating the pairwise variation (Vn/Vn+1). When this value is less than 0.15, the selected number of RGs is considered sufficient for accurate normalization of RT-qPCR data (16). NormFinder ranks RGs based on their stability value (SV), with the gene exhibiting the lowest SV being considered the most stable (17). The ΔCt method ranks candidate RGs based on the average Ct (Avg.Ct) and compares the relative expression of pairs of genes within each sample (19). BestKeeper evaluates the stability of RGs based on the coefficient of variation (CV) and the relative standard deviation (SD), with genes showing an SD greater than 1.0 considered unsuitable (18).
Result
3
Expression analysis of the reference genes by Ct value
3.1
The five candidate reference genes (β-actin, 18S rRNA, PUM1, RPLP0, and TFRC) were pre-validated in four breast cancer cell lines (Supplementary Figure S1). Stable expression of these five candidate reference genes was observed in breast cancer cells, thus they were selected for subsequent tissue-level validation. All reference gene primers exhibited single, specific melting peaks and acceptable amplification efficiencies. After confirming the stability of Ct values, tissue-based stability validation was performed on the stably expressed genes (Supplementary Figure S2).
The Ct values of five candidate RGs (β-actin, 18S rRNA, PUM1, RPLP0, and TFRC) in 30 pairs of cancer tissues and matched adjacent tissues are shown in Table 1 and Figure 1. In cancer tissues, the Ct value range for 18S rRNA was the smallest (Ct Range = 3.96), followed by TFRC (Ct Range = 6.61). The median Ct value for 18S rRNA was 8.43, lower than those of the other candidate RGs, whose Ct values ranged from 16 to 23. In matched adjacent tissues, TFRC exhibited the smallest Ct value range (Ct Range = 6.29), while 18S rRNA showed the largest range (Ct Range = 21.75).
The median and quartile of five candidate RGs in 30 pairs of tissue samples. The line represents the median, and the target value represents the 25th and 75th percentiles.
The differences in candidate RGs between cancer tissues and matched adjacent tissues were analyzed using t-tests or non-parametric tests. Ct values of each candidate RG in cancer tissues were significantly higher than those in matched adjacent tissues (Figure 2).
Comparison of Ct values between cancer tissues and matched adjacent tissues. The Ct values in cancer tissues were significantly higher than those in adjacent tissues. T-tests were used for β-actin and TFRC, while non-parametric tests were applied to 18S rRNA, PUM1, and RPLP0. *** indicates P < 0.001.
The samples were further classified into subgroups based on clinical and histopathological features (Supplementary Figures S3-S7). After subgroup classification by age, grade, tumor diameter, metastasis, ER, PR, Ki67, molecular subtype, and TNM stage, the Ct values of adjacent tissues remained higher than those of cancer tissues (Supplementary Figures S3-S5). In cancer tissues, none of the candidate RGs showed an association with any clinical or histopathological features (Supplementary Figure S6). In adjacent tissues, the Ct value of β-actin was higher in patients younger than 50 years compared to older patients. Additionally, the Ct values of 18S rRNA and PUM1 were lower in patients with Ki67 expression ≤30% compared to those with Ki67 expression >30% (Supplementary Figure S7).
Stability analysis of candidate reference genes by GeNorm
3.2
GeNorm calculates the average pairwise expression ratio to assess the stability of gene expression, with genes having lower M values being more stable. In cancer tissues, only the M values of 18S rRNA and TFRC (both M = 0.912) were less than 1.5 (Figure 3A). In contrast, all M values of the five candidate RGs were greater than 1.5 in adjacent tissues (Figure 3B) and in the total samples (combined cancer tissues and adjacent tissues) (Figure 3C). GeNorm can determine the optimal number of RGs based on a V value of less than 0.15. For the five candidate RGs, the V values were all greater than 0.15 in cancer tissues (Figure 3D), adjacent tissues (Figure 3E), and total samples (Figure 3F).
GeNorm analysis of candidate RGs. Genes with lower average expression stability (M values) indicate greater stability. (A-C) GeNorm analysis of M values in cancer tissues (A), matched adjacent tissues (B), and total samples (C). The most stable candidate RGs were 18S rRNA in cancer tissues, PUM1 and TFRC in matched adjacent tissues, and β-actin and TFRC in total samples. (D-F) V values from GeNorm analysis in cancer tissues (D), matched adjacent tissues (E), and total samples (F).
Stability analysis of candidate reference genes by NormFinder
3.3
Five candidate RGs were ranked based on their stability values (SV) calculated by NormFinder. Genes with higher SV values were considered less stable. The most stable candidate RGs were 18S rRNA and TFRC in cancer tissues (both SV = 0.456), TFRC in matched adjacent tissues (SV = 1.638), and TFRC in total samples (SV = 1.288). The least stable RGs were PUM1 in cancer tissues, 18S rRNA in adjacent tissues, and RPLP0 in total samples (Table 2).
Stability analysis of candidate reference genes by BestKeeper
3.4
BestKeeper evaluated the stability of gene expression based on the standard deviation (SD) and coefficient of variation (CV). SD values greater than 1 suggest unstable gene expression. 18S rRNA was the most stable gene in cancer tissues (SD = 0.84) and total samples (SD = 4.30). TFRC was the most stable gene in adjacent tissues (SD = 1.15). Only the SD value of 18S rRNA in cancer tissues was lower than 1 (Table 2).
Stability analysis of candidate reference genes by ΔCt
3.5
TFRC exhibited the lowest average Ct (Avg.Ct) in cancer tissues, matched adjacent tissues, and total samples. The highest Avg.Ct values were observed for PUM1 in cancer tissues, 18S rRNA in adjacent tissues, and RPLP0 in total samples (Table 2).
Stability analysis of candidate reference genes by RefFinder
3.6
RefFinder calculated the geometric mean (GM) value for comprehensive ranking. The gene with the lowest GM value is considered the most stable. In cancer tissues, TFRC had the best stability (GM = 1.19), followed by 18S rRNA (GM = 1.41). TFRC was also the most stable gene in matched adjacent tissues (GM = 1.00) and total samples (GM = 1.19). The least stable candidate RGs were β-actin in cancer tissues, 18S rRNA in adjacent tissues, and RPLP0 in total samples (Table 2).
Discussion
4
This study evaluated the stability of the five candidate RGs in breast cancer tissues and matched adjacent tissues using RT-qPCR. The results indicated that these genes were not suitable for normalization when both cancer and matched adjacent tissues were analyzed together. Our study suggests that However, 18S rRNA and TFRC were found to be suitable reference genes for normalization when cancer tissues were analyzed individually, although further research is needed to confirm this.
To ensure coverage of distinct biological categories and expression levels, we selected 18S rRNA (a high-abundance rRNA), RPLP0 (a ribosomal protein), PUM1 (an RNA-binding protein), and TFRC and ACTB (commonly used mRNA reference genes). While the five candidate RGs has been shown to be stably expressed in various breast cancer cell lines, it is important to note that gene expression stability in cell lines may not always reflect that in tissue samples. Previous studies have reported that reference gene stability can differ significantly between cell lines and tissue types (27–29). In this study, 18S rRNA and TFRC were identified as potential RGs for breast cancer tissues due to lower variability and lack of association with clinicopathological parameters. 18S rRNA has previously been shown to be stably expressed in various breast cancer cell lines (30). In contrast, the five RGs tested were not suitable for use in adjacent tissues due to their high variability and low expression. Differential expression of β-actin in patients of different ages, and of RPLP0 and PUM1 in patients with varying Ki67 levels, further demonstrated that β-actin, RPLP0, and PUM1 were not suitable as RGs in adjacent tissues. Consistent with our findings, McNeill et al. reported that RPLP0 was differentially expressed in benign and malignant breast tumors (31). β-actin has also been shown to be differentially expressed in normal and malignant breast tissues, and may promote breast cancer cell proliferation and tumor invasiveness (10, 32–34). However, Tilli et al. suggested that PUM1 is a suitable endogenous gene for breast cancer tissue and cellular studies (35). Clinicopathological classification enhances the clinical application of cancer research. To the best of our knowledge, our study is the first to integrate clinicopathological parameters in the selection of RGs for breast cancer research.
Currently, there is no universal standard for evaluating RGs. Widely recognized methods for RG evaluation include GeNorm, NormFinder, BestKeeper, and ΔCt. Thresholds for GeNorm (M value < 1.5) and BestKeeper (SD < 1) are commonly used to screen for stable RGs. In our study, 18S rRNA was the only gene in cancer tissues that met both thresholds (M value = 0.912, SD = 0.84). To minimize differences and select the most suitable RG, we also used RefFinder. RefFinder has been widely employed for the comprehensive evaluation of RGs in both normal and disease states (36, 37). Our results indicated that TFRC ranked first in cancer tissues, followed by 18S rRNA. Therefore, 18S rRNA and TFRC could be used as RGs in breast cancer tissues. Similarly, Majidzadeh et al. concluded that TFRC is a suitable RG for detecting urokinase plasminogen activator in breast cancer (38), and 18S rRNA has been proposed as a potential RG for gastric cancer tissues and cell lines (39).
Some studies have reported that the expression of RGs varies across tissues, cell types, and disease stages (40, 41). For example, 18S rRNA has been used as an RG in research involving the MCF-7 breast cancer cell line (42), while it was the least stable RG in papillary thyroid cancer (43). PUM1 was identified as an appropriate RG in renal and colon cancers, but was the least stable in gastric cancer according to TCGA data analysis (44). These inconsistencies may be attributed to differences in tissue types, sample preparation methods, and experimental conditions.
However, our study is limited by the small sample size and the number of candidate genes tested. The findings of this study should be validated with larger patient cohorts. Future studies could leverage integrative multi-omics analyses and pan-cancer immune profiling to expand and validate candidate reference genes, thereby improving their generalizability and stability across different tissue types, molecular subtypes, and immune microenvironment conditions (45, 46). With advancements in biotechnology, RNA sequencing (RNA-seq) is gradually replacing microarray technology as the preferred method for analyzing gene expression. Combining RNA-seq with RT-qPCR could provide a more accurate approach for identifying RGs (47–50). Furthermore, the use of multiple RGs for data normalization is becoming a key focus of current research (34, 51).
Conclusion
5
Five RGs (β-actin, 18S rRNA, PUM1, RPLP0, and TFRC) were analyzed in both breast cancer and matched adjacent tissues. Our study identified that TFRC and 18S rRNA exhibited potential as reliable RGs in breast cancer tissues. However, the five genes were not suitable as RGs in matched adjacent tissues, either alone or when combined with breast cancer tissues. Further research is needed to identify more appropriate RGs for breast cancer.
The reference list from the paper itself. Each links out to its DOI / PubMed record.
- 1Bray F Laversanne M Sung H Ferlay J Siegel RL Soerjomataram I . Global cancer statistics 2022: GLOBOCAN estimates of incidence and mortality worldwide for 36 cancers in 185 countries. CA Cancer J Clin. (2024) 74:229–63. doi: 10.3322/caac.21834, PMID: 38572751 · doi ↗ · pubmed ↗
- 2Fan L Strasser-Weippl K Li JJ St Louis J Finkelstein DM Yu KD . Breast cancer in China. Lancet Oncol. (2014) 15:e 279–89. doi: 10.1016/s 1470-2045(13)70567-9, PMID: 24872111 · doi ↗ · pubmed ↗
- 3Qu Z Li Z Pei S Lu Y Liu Q Ding P . Global, Regional, and National Burden of Breast Cancer in Adolescents and Young Adults Aged 15–39 Years From 1990 to 2021 Based on the Global Burden of Disease Study 2021. Cancer Innov. (2025) 4:e 70016. doi: 10.1002/cai 2.70016, PMID: 40487561 PMC 12142427 · doi ↗ · pubmed ↗
- 4Loibl S Poortmans P Morrow M Denkert C Curigliano G . Breast cancer. Lancet. (2021) 397:1750–69. doi: 10.1016/s 0140-6736(20)32381-3, PMID: 33812473 · doi ↗ · pubmed ↗
- 5El Hadi H Abdellaoui-Maane I Kottwitz D El Amrani M Bouchoutrouch N Qmichou Z . Development and evaluation of a novel RT-q PCR based test for the quantification of HER 2 gene expression in breast cancer. Gene. (2017) 605:114–22. doi: 10.1016/j.gene.2016.12.027, PMID: 28039034 · doi ↗ · pubmed ↗
- 6Tavoillot J Mateille T Ali N ChappéAM Martin JF . Early Detection of the Root-Knot Nematode Meloidogyne hapla Through Developing a Robust Quantitative PCR Approach Compliant with the Minimum Information for Publication of Quantitative Real-Time PCR Experiments Guidelines. Plant Dis. (2021) 105:2836–43. doi: 10.1094/pdis-11-20-2408-re, PMID: 33900116 · doi ↗ · pubmed ↗
- 7Jacob F Guertler R Naim S Nixdorf S Fedier A Hacker NF . Careful selection of reference genes is required for reliable performance of RT-q PCR in human normal and cancer cell lines. Plo S One. (2013) 8:e 59180. doi: 10.1371/journal.pone.0059180, PMID: 23554992 PMC 3598660 · doi ↗ · pubmed ↗
- 8KılıçY Çelebiler A SakızlıM . Selecting housekeeping genes as references for the normalization of quantitative PCR data in breast cancer. Clin Transl Oncol. (2014) 16:184–90. doi: 10.1007/s 12094-013-1058-5, PMID: 23720140 · doi ↗ · pubmed ↗