Association between neutrophil percentage to albumin ratio and sarcopenia among cancer patients: evidence from both the Chinese and American cohorts
Yang Yu, Bo Chen

TL;DR
This study shows that a blood test measuring neutrophil percentage and albumin can predict muscle loss in cancer patients in both the U.S. and China.
Contribution
The study introduces NPAR as a novel, practical biomarker for sarcopenia risk in cancer patients.
Findings
NPAR was significantly linked to sarcopenia in both U.S. and Chinese cancer patients.
NPAR outperformed other inflammatory markers in predicting sarcopenia.
Systemic inflammation and low protein intake partially explained the NPAR-sarcopenia link.
Abstract
Sarcopenia, the progressive depletion of skeletal muscle mass and strength, worsens quality of life, and survival in cancer patients. Given its multifactorial pathogenesis involving chronic inflammation and malnutrition, integrated biomarkers for early risk assessment are needed. This two-cohort study investigated the clinical utility of the neutrophil percentage-to-albumin ratio (NPAR) for sarcopenia risk stratification. We analyzed data from the US National Health and Nutrition Examination Survey (NHANES, n = 1,586) and a Chinese clinical cohort (n = 705). Associations were assessed using multivariable regression, threshold analysis, and ROC curves. Mediation analyses were performed in the NHANES cohort. Elevated NPAR was significantly associated with higher odds of sarcopenia in both the American (OR = 1.14, 95% CI: 1.06–1.22) and Chinese (OR = 1.10, 95% CI: 1.04–1.14) populations,…
Genes, proteins, chemicals, diseases, species, mutations and cell lines named across the full text — each resolved to its canonical identifier and authoritative record.
Click any figure to enlarge with its caption.
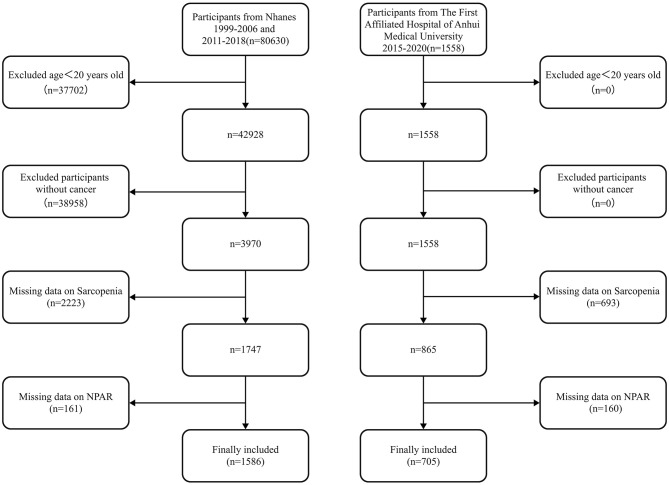 Figure 1
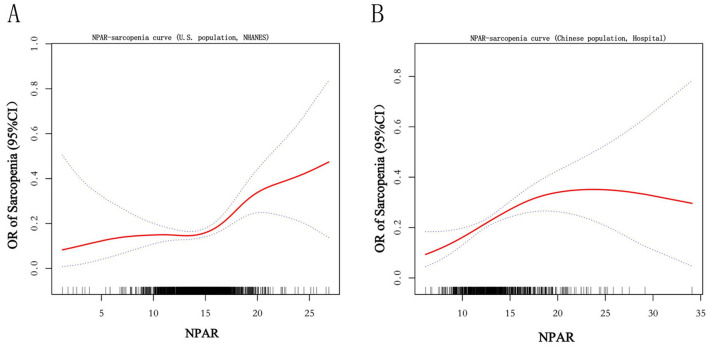 Figure 2
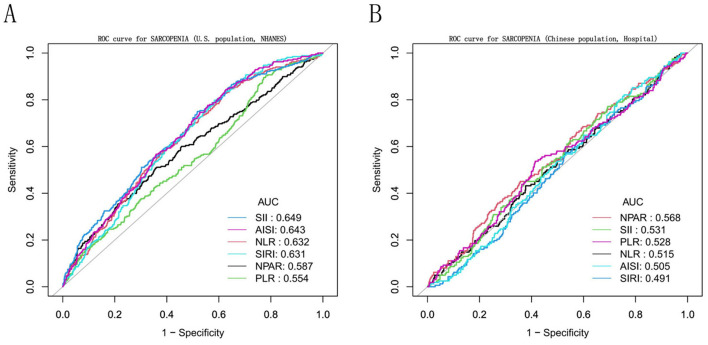 Figure 3
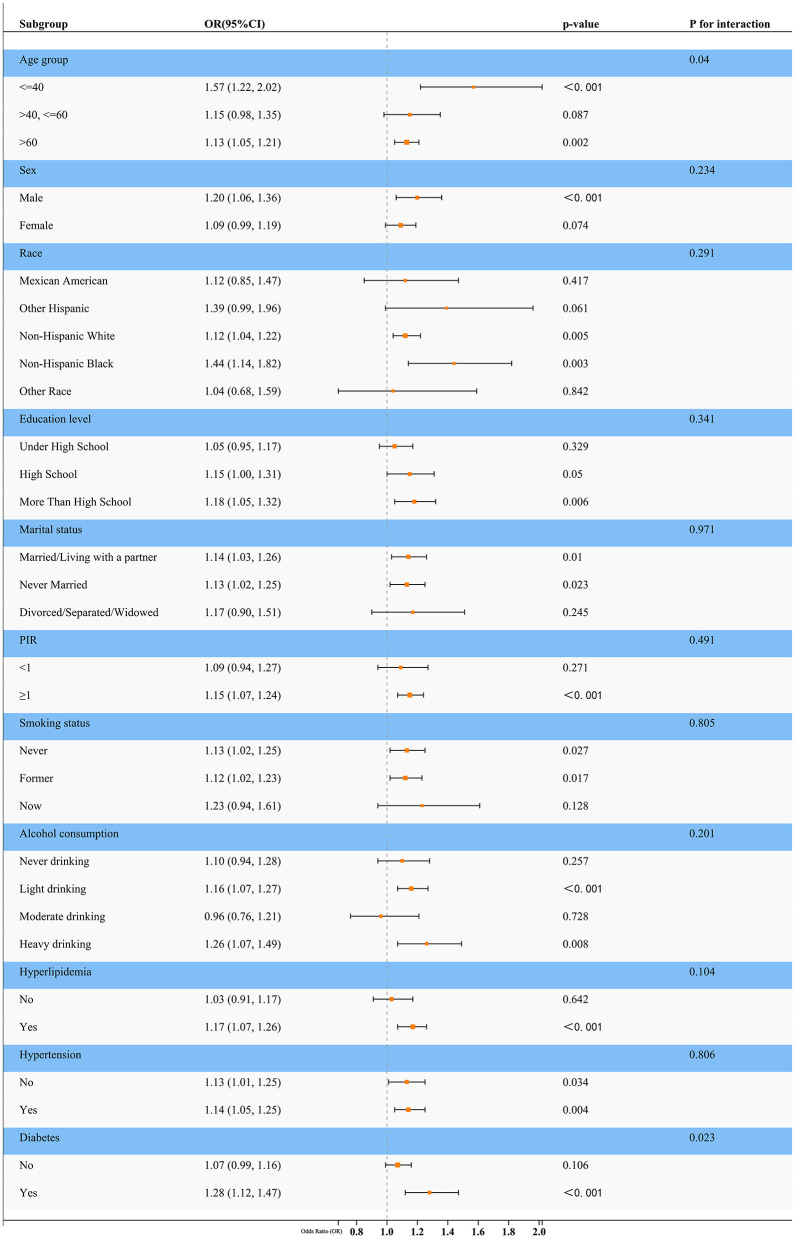 Figure 4
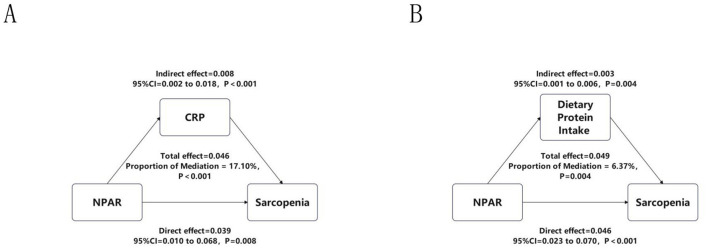 Figure 5
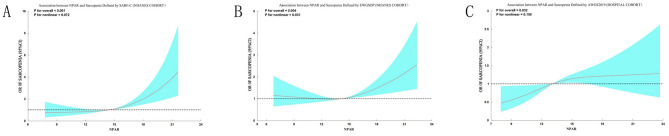 Figure 6
|
|
|
|
|
|
|
|---|---|---|---|---|---|
| Sample size (example) | 1,586 | 1,318 | 168 | 1 | |
| Age (year), mean ± SD | 56.21 ± 0.46 | 55.01 ± 0.47 | 64.86 ± 1.34 | < 0.0001 | |
| NPAR, mean ± SD | 14.06 ± 0.09 | 13.93 ± 0.10 | 14.96 ± 0.21 | < 0.0001 | |
| 0.0118 | |||||
| Female | 61.51 (58.72, 64.23) | 62.87 (59.79, 65.85) | 51.75 (43.39, 60.01) | 14.26 ± 2.64 | |
| Male | 38.49 (35.77, 41.28) | 37.13 (34.15, 40.21) | 48.25 (39.99, 56.61) | 14.15 ± 2.84 | |
| < 0.0001 | |||||
| Mexican American | 2.49 (1.86, 3.34) | 2.04 (1.47, 2.82) | 5.77 (3.68, 8.94) | 14.13 ± 2.49 | |
| Other Hispanic | 2.81 (1.76, 4.47) | 2.27 (1.49, 3.44) | 6.75 (2.72, 15.75) | 13.65 ± 2.10 | |
| Non-Hispanic white | 86.57 (84.21, 88.63) | 87.14 (84.84, 89.13) | 82.52 (74.27, 88.53) | 14.30 ± 2.71 | |
| Non-Hispanic black | 4.99 (4.02, 6.17) | 5.44 (4.39, 6.74) | 1.69 (0.83, 3.42) | 13.84 ± 3.20 | |
| Other race | 3.13 (2.26, 4.33) | 3.12 (2.20, 4.40) | 3.27 (1.48, 7.05) | 14.40 ± 2.45 | |
| < 0.0001 | |||||
| < High school | 15.19 (12.98, 17.70) | 13.72 (11.49, 16.30) | 25.83 (19.67, 33.13) | 14.25 ± 2.92 | |
| High school | 23.42 (20.69, 26.39) | 22.69 (19.78, 25.90) | 28.66 (21.91, 36.53) | 14.03 ± 2.61 | |
| >High school | 61.39 (58.02, 64.64) | 63.59 (60.04, 67.00) | 45.50 (38.14, 53.07) | 14.27 ± 2.70 | |
| 0.2505 | |||||
| Married/living with a partner | 67.96 (65.06, 70.74) | 68.21 (65.15, 71.12) | 66.20 (58.44, 73.17) | 14.27 ± 2.70 | |
| Divorced/separated/widowed | 25.35 (22.78, 28.10) | 24.83 (22.16, 27.71) | 29.05 (22.58, 36.51) | 14.67 ± 2.98 | |
| Never married | 6.69 (5.31, 8.40) | 6.96 (5.43, 8.88) | 4.75 (2.83, 7.87) | 14.34 ± 3.03 | |
| 0.9936 | |||||
| < 1 | 10.52 (8.39, 13.10) | 10.51 (8.48, 12.97) | 10.54 (5.80, 18.39) | 14.41 ± 2.79 | |
| ≥1 | 89.48 (86.90, 91.61) | 89.49 (87.03, 91.52) | 89.46 (81.61, 94.20) | 14.18 ± 2.72 | |
| 0.0001 | |||||
| No | 78.67 (75.79, 81.30) | 80.63 (77.61, 83.33) | 64.53 (55.20, 72.88) | 14.04 ± 2.66 | |
| Yes | 21.33 (18.70, 24.21) | 19.37 (16.67, 22.39) | 35.47 (27.12, 44.80) | 14.70 ± 2.87 | |
| 0.0021 | |||||
| Never drinking | 10.18 (8.57, 12.05) | 9.68 (7.92, 11.77) | 13.77 (9.23, 20.05) | 14.47 ± 2.88 | |
| Light drinking | 57.06 (53.58, 60.48) | 55.43 (51.47, 59.33) | 68.82 (59.64, 76.74) | 14.24 ± 2.80 | |
| Moderate drinking | 16.39 (14.22, 18.83) | 17.26 (14.88, 19.92) | 10.17 (5.37, 18.40) | 13.95 ± 2.31 | |
| Heavy drinking | 16.37 (14.06, 18.96) | 17.63 (15.03, 20.58) | 7.24 (3.83, 13.27) | 14.04 ± 2.58 | |
| 0.0014 | |||||
| Never | 41.78 (38.79, 44.83) | 41.85 (38.85, 44.92) | 41.25 (33.84, 49.08) | 14.29 ± 2.57 | |
| Former | 36.47 (33.55, 39.50) | 35.09 (32.16, 38.15) | 46.42 (39.25, 53.74) | 14.10 ± 2.92 | |
| Now | 21.75 (19.28, 24.43) | 23.05 (20.47, 25.85) | 12.33 (7.51, 19.59) | 14.27 ± 2.67 | |
| < 0.0001 | |||||
| No | 49.42 (45.74, 53.10) | 52.26 (48.52, 55.97) | 28.92 (21.90, 37.11) | 13.97 ± 2.69 | |
| Yes | 50.58 (46.90, 54.26) | 47.74 (44.03, 51.48) | 71.08 (62.89, 78.10) | 14.38 ± 2.75 | |
|
| < 0.0001 | ||||
| No | 22.73 (20.12, 25.58) | 24.21 (21.38, 27.27) | 12.12 (8.53, 16.94) | 14.33 ± 2.81 | |
| Yes | 77.27 (74.42, 79.88) | 75.79 (72.73, 78.62) | 87.88 (83.06, 91.47) | 14.18 ± 2.71 |
|
|
|
|
|
|
|
|---|---|---|---|---|---|
| Sample size (example) | 705 | 543 | 162 | 1 | |
| Age (year), mean ± SD | 62.23 ± 10.15 | 61.27 ± 10.30 | 65.45 ± 8.94 | < 0.001 | |
| NPAR, mean ± SD | 14.08 ± 3.34 | 14.01 ± 3.48 | 14.96 ± 3.29 | < 0.001 | |
| Leukocyte (109/L), mean ± SD | 5.58 ± 1.94 | 5.57 ± 2.04 | 5.63 ± 1.57 | 0.203 | |
| 0.986 | |||||
| Female | 165 (23.40%) | 127 (23.39) | 38 (23.46) | 13.48 ± 3.65 | |
| Male | 540 (76.60%) | 416 (76.61) | 124 (76.54) | 13.66 ± 3.35 | |
| 0.906 | |||||
| Married/living with a partner | 568 (80.57%) | 438 (80.67) | 130 (80.25) | 13.36 ± 3.20 | |
| Never married/divorced/separated/widowed | 137 (19.43%) | 105 (19.33) | 32 (19.75) | 13.68 ± 3.47 | |
| 0.409 | |||||
| No | 614 (87.09) | 476 (87.66) | 138 (85.19) | 13.65 ± 3.38 | |
| Yes | 91 (12.91) | 67 (12.34) | 24 (14.81) | 13.78 ± 3.75 | |
| 0.308 | |||||
| Never drinking | 591 (83.82) | 451 (83.06) | 140 (86.42) | 13.63 ± 3.55 | |
| Drinking | 114 (16.18) | 92 (16.94) | 22 (13.58) | 13.58 ± 3.09 | |
| 0.203 | |||||
| Never smoking | 558 (79.14) | 424 (78.08) | 134 (82.71) | 13.63 ± 3.56 | |
| Smoking | 147 (20.86) | 119 (21.92) | 28 (17.29) | 13.47 ± 2.92 | |
| 0.972 | |||||
| No | 536 (76.02) | 413 (76.06) | 123 (75.92) | 13.72 ± 3.59 | |
| Yes | 169 (23.98) | 130 (23.94) | 39 (24.08) | 13.37 ± 2.84 | |
|
| 0.856 | ||||
| I | 113 (16.03%) | 89 (16.39) | 24 (14.81) | 13.71 ± 3.13 | |
| II | 151 (21.42%) | 116 (21.36) | 35 (21.60) | 13.53 ± 3.35 | |
| III | 304 (43.12%) | 236 (43.46) | 68 (41.98) | 13.61 ± 3.63 | |
| IV | 137 (19.43%) | 102 (18.78) | 35 (21.60) | 13.66 ± 3.30 |
|
|
|
|
|
|---|---|---|---|
| NPAR (continuousa) | 1.17 (1.09, 1.25) < 0.0001 | 1.13 (1.05, 1.23) | 1.14 (1.06, 1.22) 0.0007 |
|
| |||
| Q1 | [Reference] | [Reference] | [Reference] |
| Q2 | 0.88 (0.51, 1.53) 0.6593 | 0.90 (0.51, 1.58) | 0.92 (0.52, 1.62) 0.7647 |
| Q3 | 1.11 (0.66, 1.88) 0.6978 | 1.00 (0.57, 1.76) | 1.06 (0.61, 1.84) 0.8494 |
| Q4 | 2.17 (1.36, 3.47) 0.0017 | 1.78 (1.05, 3.00) | 1.79 (1.05, 3.06) 0.0349 |
| 0.0017 | 0.0354 | 0.0304 | |
|
|
|
|
|
|---|---|---|---|
| NPAR (continuousa) | 1.09 (1.03, 1.14) 0.0010 | 1.09 (1.04, 1.15) | 1.10 (1.04, 1.14) 0.0007 |
|
| |||
| Q1 | [Reference] | [Reference] | [Reference] |
| Q2 | 1.83 (1.06, 3.18) 0.0303 | 1.84 (1.05, 3.22) | 1.77 (0.96, 3.23) 0.065 |
| Q3 | 1.78 (1.02, 3.08) 0.0409 | 1.91 (1.09, 3.34) | 1.84 (0.98, 3.38) 0.0536 |
| Q4 | 2.80 (1.65, 4.74) 0.0001 | 3.03 (1.77, 5.20) | 2.99 (1.63, 5.32) 0.0003 |
| 0.0003 | < 0.0001 | 0.0003 | |
|
|
|
|
|
|
|---|---|---|---|---|
| Scenario I | Linear effect | Overall effect | 1.11 (1.05, 1.17) | < 0.001 |
| Scenario II | Non-linear effect | Threshold (K) | 14.7 | – |
| Scenario II | Non-linear effect | Effect below K | 1.00 (0.91, 1.10) | 0.976 |
| Scenario II | Non-linear effect | Effect above K | 1.21 (1.11, 1.33) | < 0.001 |
| Scenario II | Non-linear effect | Difference in effects (2 vs. 1) | 1.21 (1.04, 1.41) | 0.014 |
| Scenario II | Non-linear effect | Likelihood ratio test | – | 0.016 |
|
|
|
|
|
|
|---|---|---|---|---|
| Scenario I | Linear effect | Overall effect | 1.09 (1.03, 1.14) | 0.001 |
| Scenario II | Non-linear effect | Threshold (K) | 17.07 | – |
| Scenario II | Non-linear effect | Effect below K | 1.17 (1.08, 1.27) | 0.0002 |
| Scenario II | Non-linear effect | Effect above K | 0.96 (0.85, 1.09) | 0.5319 |
| Scenario II | Non-linear effect | Difference in effects (2 vs. 1) | 0.82 (0.69, 0.98) | 0.0270 |
| Scenario II | Non-linear effect | Likelihood ratio test | – | 0.022 |
Peer Reviews
No public reviews on file for this paper yet. If you reviewed it on a platform where reviews are public (OpenReview, ICLR, NeurIPS, ICML), you can paste yours below so the community can read it here.
Videos
No videos yet. Explain this paper in a talk, walkthrough, or lecture? Add one.
Taxonomy
TopicsNutrition and Health in Aging · Inflammatory Biomarkers in Disease Prognosis · Adipokines, Inflammation, and Metabolic Diseases
Introduction
1
Sarcopenia, characterized by the progressive loss of skeletal muscle mass and function, is a common complication among cancer patients and significantly impacts their quality of life, treatment tolerance, and survival outcomes (1–6). The pathogenesis of sarcopenia in cancer patients is multifactorial, involving factors such as cancer-related inflammation, altered metabolism, and nutritional deficiencies (7–9). Developing validated biomarkers for early-phase detection and longitudinal monitoring of sarcopenia is imperative to implement precision clinical protocols through targeted interventions, thereby enhancing functional preservation in at-risk populations.
In recent years, the neutrophil percentage-to-albumin ratio (NPAR) has emerged as a promising biomarker for assessing inflammation and nutritional status (10, 11). NPAR is calculated by dividing the percentage of neutrophils by the serum albumin level and has been shown to be associated with various clinical conditions, including cardiovascular diseases, diabetes, Ulcerative Colitis, and liver diseases (12–15). NPAR's prognostic value in sarcopenia has garnered growing interest through its dual quantification of inflammatory dysregulation and nutritional depletion–recognized pathophysiological drivers of this condition (16).
Emerging research has systematically investigated NPAR correlations with diverse clinical endpoints. For instance, Ding et al. (17) demonstrated elevated NPAR levels served as an independent predictor for rheumatoid arthritis incidence in cohort studies. Similarly, Li et al. (18) reported that NPAR was associated with chronic kidney disease, emphasizing its prognostic value. Additionally, Wang et al. (19) demonstrated that NPAR was associated with nonalcoholic fatty liver disease, further supporting its utility as a biomarker for metabolic and inflammatory disorders.
Despite these findings, the relationship between NPAR and sarcopenia among cancer patients remains largely unexplored. Given the significant impact of sarcopenia on cancer patients' prognosis and the potential of NPAR to reflect both inflammation and nutritional status, investigating this association could provide valuable insights for early identification and intervention. We posit that NPAR holds particular promise as a composite reflector of the core pathophysiology. In contrast to tools that rely on subjective reporting (e.g., SARC-F) or are resource-intensive (e.g., full AWGS/EWGSOP assessment), NPAR is derived objectively from routine blood tests, offering a practical “first-line” signal for muscle wasting risk. The selection of NPAR is grounded in the multifactorial pathogenesis of cancer-related sarcopenia, which is driven by the synergistic effects of chronic inflammation and nutritional depletion. An elevated NPAR, irrespective of its primary driver (neutrophilia or hypoalbuminemia), provides an integrated signal of the pro-catabolic and anti-anabolic milieu that predisposes to muscle wasting.
Therefore, the present study aims to explore the association between NPAR and sarcopenia among cancer patients. This study enhances sarcopenia biomarker research by elucidating NPAR's potential as a clinical indicator in cancer populations, particularly addressing chemotherapy-associated metabolic dysregulation that may exacerbate muscle wasting processes.
Methods
2
Survey description
2.1
The analysis employed data from the NHANES, a nationally representative cross-sectional surveillance system administered by the CDC's National Center for Health Statistics (NCHS). Utilizing a stratified multistage probability sampling design (20), NHANES integrates demographic interviews, physical assessments, and laboratory analyses to monitor health parameters in community-dwelling Americans. This study incorporated data from discontinuous cycles spanning 1999–2006 and 2011–2018, excluding interim years to align with Dual-energy X-ray Absorptiometry (DXA) availability protocols (20, 21). More detailed information on the DXA examination protocol is documented in the NHANES Body Composition Procedures Manual. To externally validate our findings, we supplemented this with a clinical cohort of gastrointestinal cancer patients (2015–2020) from the Department of Gastrointestinal Surgery, the First Affiliated Hospital of Anhui Medical University.
Study population
2.2
The initial sample consisted of 80,630 participants from the NHANES 1999–2018 database. After excluding individuals aged < 20 years (n = 37,702), 42,928 participants remained. From this cohort, those without a cancer diagnosis were further excluded (n = 38,958), resulting in 3,970 cancer survivors. Subsequent exclusions due to missing data on sarcopenia (n = 2,223) and NPAR (n = 161) yielded a final analytical sample of 1,586 individuals from NHANES. Concurrently, an external validation cohort was derived from the First Affiliated Hospital of Anhui Medical University, comprising 1,558 gastrointestinal cancer patients treated between 2015 and 2020. Patients with gastrointestinal cancers were specifically selected for this validation cohort due to their high prevalence of cancer-related sarcopenia, which is often driven by nutritional impairment and systemic inflammation, making them a highly relevant population for evaluating an inflammatory-nutritional biomarker like NPAR (22). After excluding patients with missing sarcopenia (n = 693) and NPAR (n = 160) data, 705 patients were included in the validation analysis. The participant selection process for both cohorts is detailed in Figure 1.
Flow chart of participant selection. This figure details the participant selection process for this bicontinental study. The left panel shows the derivation of the US cohort from the National Health and Nutrition Examination Survey (NHANES, 1999–2006 and 2011–2018), starting with 80,630 participants. The right panel shows the derivation of the Chinese validation cohort from The First Affiliated Hospital of Anhui Medical University (2015–2020), starting with 1,558 gastrointestinal cancer patients. Participants were excluded based on age, cancer diagnosis, and the availability of key data (sarcopenia and NPAR), resulting in two final analytical cohorts (NHANES: n = 1,586; Chinese: n = 705) for the comparative analysis.
Calculation of NPAR and other inflammatory indices
2.3
The NPAR was computed as: NPAR = (Neutrophil [%]/Albumin [g/dl]) × 10^2^. Where neutrophil percentage represents the proportion of neutrophils in total white blood cells, and albumin concentration is measured in grams per deciliter (23, 24). In the NHANES cohort, a complete blood count (CBC) with white blood cell differential, which includes the neutrophil percentage, was performed on automated hematology analyzers. Albumin concentration was measured using the standard biochemistry profile. Detailed laboratory procedures and instrument information are available on the NHANES website: https://wwwn.cdc.gov/nchs/nhanes/default.aspx. In the Chinese hospital-based cohort, the neutrophil percentage was determined from the CBC analysis, and serum albumin level was measured. Both assays were conducted using standard automated clinical analyzers in the hospital's central laboratory, following standardized clinical protocols. Concurrently, the following hematologic indices were calculated using absolute cell counts (expressed as × 10^9^/L) from CBC analysis: NLR = Neutrophil count (NC)/Lymphocyte count (LC); PLR = Platelet count (PC)/Lymphocyte count (LC); SII = Platelet count (PC) × Neutrophil count (NC)/Lymphocyte count (LC); SIRI = Neutrophil count (NC) × Monocyte count (MC)/Lymphocyte count (LC); AISI = Neutrophil count (NC) × Platelet count (PC) × Monocyte count (MC)/Lymphocyte count (LC).
Definition of sarcopenia
2.4
In this study, a widely accepted criterion that focuses on the assessment of skeletal muscle mass was used to define sarcopenia. Specifically, sarcopenia was identified as having a Skeletal Muscle Index (SMI) below a threshold value. For males, this threshold was set at 0.789, and for females, it was 0.512 (25, 26). This SMI criterion has been validated and widely used in recent studies of cancer survivors, supporting its applicability in our study context (27, 28). SMI was derived using appendicular skeletal muscle mass (ASM; kg) by BMI (kg/m^2^), where ASM denotes the aggregate muscle quantity in bilateral extremities measured by DXA. To ensure the robustness of our findings, we conducted sensitivity analyses using alternative diagnostic criteria. In the NHANES cohort, we applied the European Working Group on Sarcopenia in Older People (EWGSOP) consensus, defining sarcopenia as an appendicular skeletal muscle index (ASMI = ASM/height^2^) of < 7.26 kg/m^2^ for men and < 5.45 kg/m^2^ for women (29, 30), and the SARC-F questionnaire, with a score >4 indicating sarcopenia (31–33). In the Chinese hospital cohort, we applied the Asian Working Group for Sarcopenia (AWGS) 2019 consensus, defining low muscle mass as an ASMI < 7.0 kg/m^2^ for men and < 5.4 kg/m^2^ for women (5, 34).
Covariates
2.5
To mitigate confounding bias in assessing the NPAR-sarcopenia relationship, we implemented a hierarchical covariate adjustment framework across three tiers: demographic characteristics, lifestyle factors and health conditions, referring to published articles and clinical knowledge. In the NHANES cohort, demographic attributes covered age, gender, ethnicity, marital status, poverty index ratio (PIR), and educational level. Lifestyle elements included alcohol consumption and smoking habits. Smoking behavior was assessed through a detailed questionnaire, categorizing participants as never smoking, former smoking and now smoking. Drinking behavior was defined as never drinking, light drinking, moderate drinking and heavy drinking based on regular alcohol consumption patterns. Health conditions such as diabetes, hypertension, and hyperlipidemia were assessed based on physician diagnoses or self-reports. For the external validation cohort from the First Affiliated Hospital of Anhui Medical University, available covariates included age, gender, marital status, smoking (defined as never or ever smoking), alcohol consumption (defined as never or ever drinking), hypertension, diabetes, leukocyte count, and TNM stage, all of which were based on physician diagnoses or medical records. It should be noted that data on dietary protein intake were not available for the Chinese hospital-based cohort.
Statistical analysis
2.6
For both the NHANES cohort and the external validation cohort from the First Affiliated Hospital of Anhui Medical University, baseline characteristics of the study participants were summarized according to their sarcopenia status. Continuous variables were expressed as mean ± standard deviation, and categorical variables were presented as numbers and percentages. Group comparisons between participants with and without sarcopenia were conducted using Student's t-test for normally distributed continuous variables, the Mann-Whitney U test for non-normally distributed variables, and the Chi-square test (or Fisher's exact test where appropriate) for categorical variables.
The association between NPAR and sarcopenia was evaluated using multivariable logistic regression models, from which odds ratios (ORs) and their 95% confidence intervals (CIs) were derived. Three progressive adjustment strategies were employed: a crude model (unadjusted), an intermediate model adjusted for demographic covariates, and a fully adjusted model incorporating demographic, lifestyle, and clinical parameters. Continuous NPAR values were quartiled for trend testing.
To explore the potential nonlinear relationship between NPAR and sarcopenia, we employed generalized additive models (GAM) with smoothed curve fitting (penalized spline method). If a nonlinear association was identified, a two-piecewise linear regression model was further fitted to calculate the inflection point (threshold) using a likelihood ratio test.
The predictive performance of NPAR was quantified and compared with other novel inflammatory biomarkers (including NLR, PLR, SII, SIRI, and AISI) using receiver operating characteristic (ROC) curve analysis in both cohorts. The area under the curve (AUC) was calculated to assess the discriminative ability of each biomarker.
Additional analyses were conducted specifically in the NHANES cohort due to data availability. Mediation analyses were performed using a linear regression-based approach with bootstrapping (5,000 iterations) to examine the potential mediating roles of systemic inflammation (C-reactive protein, CRP) and dietary protein intake (DPI) in the association between NPAR and sarcopenia. The total, direct, and indirect effects were calculated, and the proportion mediated was reported.
Subgroup analyses based on the original sarcopenia diagnostic criteria and extensive sensitivity analyses employing multiple sarcopenia diagnostic criteria (including EWGSOP, AWGS 2019, and SARC-F) were conducted to rigorously evaluate the robustness of the primary findings. All statistical analyses were performed using EmpowerStats (v2.0) and R (v4.2.3), with the “pROC” package utilized for ROC analysis. A significance threshold of α = 0.05 was applied.
Results
3
Baseline characteristics
3.1
Baseline characteristics stratified by sarcopenia status are presented in Table 1 for the NHANES cohort (n = 1,586) and Table 2 for the hospital validation cohort (n = 705). In both cohorts, participants with sarcopenia were significantly older and had higher NPAR values compared to those without sarcopenia (all p < 0.001). While the NHANES cohort showed significant differences in ethnicity, education, lifestyle behaviors and metabolic comorbidities between groups, the hospital cohort of gastrointestinal cancer patients demonstrated no significant differences in sex distribution, marital status, diabetes prevalence, alcohol use, smoking status, TNM Stage, leukocyte or hypertension prevalence between sarcopenia and non-sarcopenia groups (all p > 0.05). Furthermore, the distribution of NPAR across key demographic and clinical subgroups is detailed in Tables 1, 2. For instance, in the NHANES cohort, higher NPAR levels were observed in participants with conditions such as diabetes (Yes: 14.70 ± 2.87) compared to those without (No: 14.04 ± 2.66). Similar trends were noted across other subgroups, providing a comprehensive overview of the biomarker's variation within the study populations.
Consistent association of NPAR with sarcopenia across cohorts with dose-response relationship
3.2
A consistent positive association between NPAR and sarcopenia was observed in both the NHANES and hospital-based validation cohorts across multiple adjusted models (Tables 3, 4). In the hospital cohort, per-unit increase in NPAR as a continuous variable was significantly associated with elevated sarcopenia risk in the unadjusted model (OR = 1.09, 95% CI: 1.03–1.14, p = 0.0010), after adjusting for age, sex, and marital status (OR = 1.09, 95% CI: 1.04–1.15, p = 0.0005), and further controlling for smoking, alcohol use, hypertension, diabetes, leukocyte count, and TNM stage (OR = 1.10, 95% CI: 1.04–1.14, p = 0.0007). When analyzed in quartiles, participants in the highest NPAR quartile (Q4) had markedly increased odds of sarcopenia compared to the lowest quartile (Q1), with ORs of 2.80 (95% CI: 1.65–4.74, p < 0.0001), 3.03 (95% CI: 1.77–5.20, p < 0.0001), and 2.99 (95% CI: 1.63–5.32, p = 0.0003) in Models 1, 2, and 3, respectively. A significant dose-response trend was consistently identified (p for trend: 0.0003, < 0.0001, and 0.0003 in Models 1, 2, and 3).
Smooth curve fitting and threshold effect analysis
3.3
The relationship between NPAR and sarcopenia was further explored using smooth curve fitting analysis (Figure 2; unadjusted for covariates in Model 1). The results revealed a complex association that encompassed both linear and nonlinear components. Threshold effect analysis (Tables 5, 6) was conducted to identify critical points in this relationship. In the NHANES cohort, a threshold was identified at NPAR = 14.7, below which the association was non-significant (OR = 1.00, 95% CI: 0.91–1.10, p = 0.976) and above which each unit increase in NPAR significantly raised sarcopenia risk by 21% (OR = 1.21, 95% CI: 1.11–1.33, p < 0.001). Conversely, the hospital cohort exhibited a distinct threshold at NPAR = 17.07, with a significant effect below this value (OR = 1.17, 95% CI: 1.08–1.27, p = 0.0002) but no significant association above it (OR = 0.96, 95% CI: 0.85–1.09, p = 0.5319). Notably, both cohorts demonstrated statistically significant nonlinearity (likelihood ratio test p = 0.016 and p = 0.022, respectively).
Smooth curve. The figure depicts the unadjusted, nonlinear relationship between the Neutrophil Percentage-to-Albumin Ratio (NPAR) and the odds of sarcopenia using generalized additive models. The solid curve represents the estimated odds ratio (OR), and the shaded area represents the 95% confidence interval. Results are presented for the (A) U.S. cohort (NHANES) and the (B) Chinese hospital-based validation cohort.
ROC curve analysis
3.4
The ROC analysis was performed to evaluate the predictive performance of NPAR and other inflammatory biomarkers for sarcopenia in both cohorts (Figure 3). In the NHANES cohort, the SII demonstrated the highest discriminative ability (AUC = 0.649), followed by AISI (0.643), NLR (0.632), SIRI (0.631), NPAR (0.587), and PLR (0.554). In contrast, within the hospital validation cohort, NPAR achieved an AUC of 0.568, outperforming other biomarkers including PLR (0.528), SII (0.531), NLR (0.515), AISI (0.505), and SIRI (0.491).
Receiver operating characteristic (ROC) curve between NPAR and other inflammatory biomarkers for sarcopenia in cancer survivors. The figure displays ROC curves evaluating the discriminative ability of the Neutrophil Percentage-to-Albumin Ratio (NPAR) and other systemic inflammatory indices (NLR, PLR, SII, SIRI, AISI) for sarcopenia in the (A) U.S. NHANES cohort and the (B) Chinese hospital-based validation cohort. The area under the curve (AUC) value for each biomarker is provided in the legend.
Subgroup analysis
3.5
In NHANES cohort, subgroup analyses (Figure 4) were performed to assess potential interactions between covariates. Significant interactions were identified in the age group (p for interaction = 0.04) and diabetes status (p for interaction = 0.023). Specifically, the association between NPAR and sarcopenia varied across age strata: the strongest effect was observed in individuals aged < 40 years (OR = 1.57, 95% CI: 1.22–2.02, p < 0.001), with attenuated effects in older subgroups (e.g., >60 years: OR = 1.13, 95% CI: 1.05–1.21, p = 0.002). Similarly, the relationship was more pronounced in participants with diabetes (OR = 1.28, 95% CI: 1.12–1.47, p < 0.001) compared to those without (OR = 1.07, 95% CI: 0.99–1.16, p = 0.106). No significant interactions were detected for sex, race, education level, marital status, PIR, smoking status, alcohol consumption, hyperlipidemia, or hypertension (all p for interaction >0.05). These findings suggest that age and diabetes status may modify the impact of NPAR on sarcopenia risk, whereas other demographic and clinical factors do not exhibit substantial effect heterogeneity.
Forest plot for subgroup analysis. This forest plot presents the odds ratios (ORs) and 95% confidence intervals (CIs) for the association between NPAR (per unit increase) and sarcopenia across various demographic and clinical subgroups in the NHANES cohort. A p-value for interaction was calculated for each subgroup to assess effect modification. The analysis revealed significant interactions for age (p for interaction = 0.04) and diabetes status (p for interaction = 0.023), indicating that the strength of the NPAR-sarcopenia association varies within these subgroups. No significant interactions were observed for the other covariates, suggesting a consistent association across those strata.
Mediation analyses of inflammatory and nutritional pathways
3.6
To further explore mechanistic pathways underlying the association between NPAR and sarcopenia, as shown in Figure 5, we evaluated two biologically plausible mediators: systemic inflammation (CRP) and nutritional adequacy (DPI). It is important to note that this mediation analysis was conducted exclusively in the NHANES cohort due to data availability. Mediation analyses revealed a significant indirect effect of CRP (β = 0.008, 95% CI: 0.002–0.018, p < 0.001), accounting for 17.10% of the total effect (β = 0.046, p < 0.001), indicating a substantial mediation by inflammatory pathways. In parallel, DPI exhibited a smaller yet statistically robust mediation effect (β = 0.003, 95% CI: 0.001–0.006, p = 0.004), explaining 6.37% of the total effect (β = 0.049, p = 0.004), consistent with evidence linking suboptimal protein intake to muscle atrophy.
Mediation analyses of CRP and DPI. This figure illustrates the mediating effects of (A) systemic inflammation, assessed by C-reactive protein (CRP), and (B) nutritional status, assessed by dietary protein intake (DPI), on the relationship between NPAR and sarcopenia. This analysis was performed specifically in the NHANES cohort. The total effect, direct effect, and indirect (mediating) effect are presented as beta coefficients with 95% confidence intervals (calculated using the bootstrap method with 5,000 iterations) and p-values. The proportion of the total effect mediated by each pathway is indicated.
Sensitivity analyses
3.7
To rigorously evaluate the robustness of our primary findings against variations in sarcopenia definition, we conducted comprehensive sensitivity analyses using three alternative diagnostic criteria. When sarcopenia was redefined using the SARC-F questionnaire in the NHANES cohort, restricted cubic spline (RCS) analysis confirmed a significant positive association with NPAR (p for overall < 0.001). Threshold effect analysis identified an inflection point at NPAR = 14.9, below which the association was not significant (OR = 1.04, 95% CI: 0.92–1.17, p = 0.521) and above which each unit increase in NPAR significantly elevated sarcopenia risk by 26% (OR = 1.26, 95% CI: 1.14–1.40, p < 0.001; Supplementary Table S1). Similarly, application of the EWGSOP criteria in the NHANES cohort also revealed a significant overall association (p for overall = 0.0146) and a nonlinear relationship (p for nonlinear = 0.031). The risk of EWGSOP-defined sarcopenia increased significantly once NPAR exceeded a threshold of 13.2 (OR = 1.11, 95% CI: 1.05–1.18, p < 0.001; Supplementary Table S2). In the Chinese hospital cohort, using the AWGS 2019 criteria, a significant linear association was observed (OR = 1.06, 95% CI: 1.01–1.11, p = 0.021). The RCS curves for all three alternative criteria are presented in Figure 6.
Sensitivity analyses of the association between NPAR and sarcopenia using alternative diagnostic criteria. Restricted cubic spline analyses demonstrate the consistent positive association between NPAR and sarcopenia risk when defined by different criteria: (A) SARC-F questionnaire (score > 4) in the NHANES cohort; (B) EWGSOP criteria (ASMI < 7.26 kg/m2 for men, < 5.45 kg/m2 for women) in the NHANES cohort; (C) AWGS 2019 criteria (ASMI < 7.0 kg/m2 for men, < 5.4 kg/m2 for women) in the hospital cohort. Solid curves represent odds ratios (ORs), and shaded areas indicate 95% confidence intervals. All models used three knots and were unadjusted for covariates. The significant overall associations (p for overall < 0.05 for all) and detailed threshold effect analyses (Supplementary Tables S1–S3) confirm the robustness of the NPAR-sarcopenia relationship across multiple diagnostic frameworks.
Discussion
4
The investigation identifies elevated NPAR as an independent predictor of sarcopenia risk in both American and Chinese oncologic cohorts, demonstrating consistent dose-response relationships across diverse populations. This association remained robust after comprehensive adjustment for demographic, lifestyle, and clinical confounders in both the NHANES and hospital-based validation cohorts. Notably, threshold analysis revealed that sarcopenia risk increased with rising NPAR within specific critical ranges—when NPAR exceeded 14.7 in the NHANES cohort and remained below 17.07 in the hospital cohort—highlighting a nonlinear yet consistently positive association within these intervals. While systemic inflammatory indices, including SII, AISI, and NLR, exhibited marginally higher diagnostic accuracy in the NHANES cohort, NPAR demonstrated superior performance compared to other biomarkers in the clinical validation cohort, underscoring its particular utility in a patient care setting.
The consistent association of NPAR with sarcopenia underscores its utility as a composite biomarker. A key strength of NPAR lies in its ability to integrate two fundamental pathophysiological drivers of cancer-related sarcopenia: neutrophil-derived inflammatory activity and hypoalbuminemia-associated nutritional deficiency (35–37). A pertinent consideration is that an identical NPAR value can result from differing contributions of its components. However, we posit that this integrated nature is precisely its strength for assessing a multifactorial syndrome. It simultaneously quantifies the inflammatory drive for muscle catabolism (via neutrophil percentage) and the nutritional capacity for muscle anabolism (via albumin). Our mediation analyses provide empirical support for this dual-pathway model, demonstrating that both systemic inflammation (CRP) and nutritional intake (dietary protein) significantly mediated the NPAR-sarcopenia relationship (Figure 5). This confirms that the biological pathways represented by both constituents of NPAR are mechanistically involved in muscle wasting.
The observed association may be mechanistically linked to the interplay between neutrophilia and hypoalbuminemia. Neutrophils, key mediators of cancer-related inflammation, release reactive oxygen species and proteolytic enzymes that promote muscle protein degradation (38). Concurrently, hypoalbuminemia—a marker of malnutrition and chronic disease—compromises muscle synthesis and repair, further accelerating sarcopenia progression (39). Our subgroup analyses revealed effect modification by age and diabetes status, suggesting that older patients and those with metabolic dysregulation may be more vulnerable to NPAR-driven sarcopenia. This aligns with studies emphasizing the role of age-related immunosenescence and insulin resistance in exacerbating inflammatory muscle loss (40, 41).
Clinically, the primary utility of NPAR lies in risk stratification and initial screening during routine oncology care. Its accessibility through routine blood tests positions it as a pragmatic tool, serving not as a standalone diagnostic, but as an objective “red flag.” This addresses a key practical need by complementing more resource-intensive or subjective assessments. An elevated NPAR should prompt definitive assessments (e.g., DXA scans) and guide timely, targeted interventions. For instance, a ratio driven predominantly by neutrophilia might prioritize anti-inflammatory strategies, whereas one driven by hypoalbuminemia would necessitate aggressive nutritional support. This actionable nature, stemming from its ability to integrate two critical pathological states, is a key clinical advantage. While this study focused on cancer patients, NPAR's predictive utility across diverse conditions (15, 17, 42) reinforces its versatility as a biomarker of the inflammation-nutrition axis, a common pathway in many chronic diseases.
Several limitations should be considered when interpreting our findings. First, the use of cross-sectional data in each cohort precludes the establishment of causal relationships between NPAR and sarcopenia; longitudinal or interventional studies are required to confirm temporal associations and its predictive utility over time. Second, in the hospital cohort, NPAR was obtained preoperatively, and its levels may be influenced by underlying cancer or pre-treatment conditions, which could bias the observed associations. Future studies incorporating serial body composition assessments from pre-diagnosis through treatment are needed to establish the dynamic prognostic value of NPAR. Third, the generalizability of our findings from the clinical cohort to other cancer populations may be limited, as it consisted exclusively of patients with gastrointestinal cancers, who were selected due to the high prevalence of sarcopenia driven by nutritional issues and inflammation in this group. Fourth, certain limitations in data availability should be noted, despite expanding adjustments in the hospital cohort to include TNM stage and leukocyte count, other key oncologic variables (e.g., treatment modality, active infection) were not available. Furthermore, dietary protein intake was not available in this cohort, which precluded external validation of the nutritional mediation analysis and may influence the comparability of effect estimates between the two study populations. Future research should also compare NPAR's performance against sarcopenia-specific biomarkers (e.g., myostatin, IGF-1) (43) and validate its prognostic value in large, multicenter prospective cohorts.
Conclusions
5
This study establishes NPAR as a practical and informative biomarker for sarcopenia risk stratification in cancer patients, integrating both inflammatory and nutritional dimensions into a single accessible measure. Its derivation from routine blood tests enables cost-effective early identification of high-risk individuals during standard oncology care. These findings support the use of NPAR in guiding timely interventions—such as nutritional therapy and anti-inflammatory support—to preserve muscle mass and improve clinical outcomes in cancer populations.
The reference list from the paper itself. Each links out to its DOI / PubMed record.
- 1Prado CM Lieffers JR Mc Cargar LJ Reiman T Sawyer MB Martin L . Prevalence and clinical implications of sarcopenic obesity in patients with solid tumours of the respiratory and gastrointestinal tracts: a population-based study. Lancet Oncol. (2008) 9:629–35. doi: 10.1016/S 1470-2045(08)70153-018539529 · doi ↗ · pubmed ↗
- 2Baracos VE Arribas L. Sarcopenic obesity: hidden muscle wasting and its impact for survival and complications of cancer therapy. Ann Oncol. (2018) 29(suppl_2):ii 1–9. doi: 10.1093/annonc/mdx 81032169202 · doi ↗ · pubmed ↗
- 3Prado CM Cushen SJ Orsso CE Ryan AM. Sarcopenia and cachexia in the era of obesity: clinical and nutritional impact. Proc Nutr Soc. (2016) 75:188–98. doi: 10.1017/S 002966511500427926743210 · doi ↗ · pubmed ↗
- 4Biolo G Cederholm T Muscaritoli M. Muscle contractile and metabolic dysfunction is a common feature of sarcopenia of aging and chronic diseases: from sarcopenic obesity to cachexia. Clin Nutr. (2014) 33:737–48. doi: 10.1016/j.clnu.2014.03.00724785098 · doi ↗ · pubmed ↗
- 5Chen LK Woo J Assantachai P Auyeung TW Chou MY Iijima K . Asian working group for sarcopenia: 2019 consensus update on sarcopenia diagnosis and treatment. J Am Med Dir Assoc. (2020) 21:300–7.e 2. doi: 10.1016/j.jamda.2019.12.01232033882 · doi ↗ · pubmed ↗
- 6Cruz-Jentoft AJ Bahat G Bauer J Boirie Y Bruyère O Cederholm T . Sarcopenia: revised European consensus on definition and diagnosis. Age Ageing. (2019) 48:16–31. doi: 10.1093/ageing/afy 16930312372 PMC 6322506 · doi ↗ · pubmed ↗
- 7Lipshitz M Visser J Anderson R Nel DG Smit T Steel HC . Emerging markers of cancer cachexia and their relationship to sarcopenia. J Cancer Res Clin Oncol. (2023) 149:17511–27. doi: 10.1007/s 00432-023-05465-937906352 PMC 10657295 · doi ↗ · pubmed ↗
- 8Setiawan T Sari IN Wijaya YT Julianto NM Muhammad JA Lee H . Cancer cachexia: molecular mechanisms and treatment strategies. J Hematol Oncol. (2023) 16:54. doi: 10.1186/s 13045-023-01454-037217930 PMC 10204324 · doi ↗ · pubmed ↗