Synaptic Tuning of Brain Rhythms: From Chemical Signalling to Cortical Oscillations
Maxime O. Baud, Dimitri Van De Ville

TL;DR
This paper explains how different brain regions produce specific rhythms based on the balance of excitatory and inhibitory receptors.
Contribution
The study links EEG data from epilepsy patients with receptor density maps to explain regional brain oscillations.
Findings
Regional oscillations depend on balanced excitatory and inhibitory receptor densities.
Neuromodulatory receptors have subtler effects on brain rhythms.
Dynamic causal modelling connects receptor types to specific oscillatory frequencies.
Abstract
Stoof et al. investigate why distinct brain regions exhibit characteristic oscillatory frequencies, such as occipital alpha and frontal beta rhythms. Their work elegantly links openly available intracranial EEG spectra from 106 epilepsy patients to synaptic receptor densities from available autoradiography maps in three healthy donors. In the framework of dynamic causal modelling, they show that regional oscillations emerge from balanced combinations of excitatory (AMPAR, NMDAR) and inhibitory receptors (GABAR A or B), while neuromodulatory receptors exert subtler influences. Synaptic tuning of brain rhythms. A network of neurons communicating via different synaptic receptors may give rise to brain oscillations at different frequencies in different brain regions. Left: schematic network of neurons communicating via different synaptic receptors. Right: brain oscillations at different…
Genes, proteins, chemicals, diseases, species, mutations and cell lines named across the full text — each resolved to its canonical identifier and authoritative record.
Click any figure to enlarge with its caption.
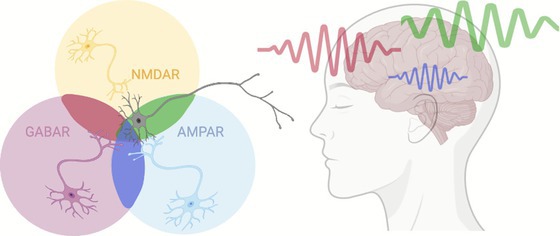 Figure 1
Peer Reviews
No public reviews on file for this paper yet. If you reviewed it on a platform where reviews are public (OpenReview, ICLR, NeurIPS, ICML), you can paste yours below so the community can read it here.
Videos
No videos yet. Explain this paper in a talk, walkthrough, or lecture? Add one.
Taxonomy
TopicsNeural dynamics and brain function · Functional Brain Connectivity Studies · Neuroscience and Neuropharmacology Research
Why does the alpha rhythm predominate in the occipital lobe and beta oscillations characterize the frontal cortex? Could regional variations in the excitatory‐inhibitory ratio and its tuning by neuromodulators account for these differences?
These are the key questions that Stoof et al. elegantly sought to address in an original study entitled “Topographic variation in human neurotransmitter receptor densities explains differences in intracranial EEG spectra” in this issue (Stoof et al. 2025).
Their work essentially explores how synaptic receptor densities may shape regional brain oscillations, leveraging several assets. First, it relies on existing autoradiography maps of 15 ionotropic or metabotropic synaptic receptors from three human donors aged 72–77 (Zilles and Palomero‐Gallagher 2017), here interpolated and integrated into a shared brain template alongside available power spectra of brain oscillations from 106 patients with epilepsy aged 33 ± 11 years (Frauscher et al. 2018). The latter were derived from previously published intracranial EEG data, recorded directly from non‐epileptic brain regions among 106 patients who underwent a presurgical work‐up of their epilepsy with penetrating electrodes. Arguably, such iEEG recordings are the best currently available, as they exquisitely capture brain oscillations with millimeter and millisecond precision. Second, in their search for correlations between recorded oscillations and receptor densities, the authors used the dynamic causal modelling (DCM) framework. Therein, coupled neural mass models include excitatory and inhibitory populations, and account for neuromodulatory effects to produce oscillatory behaviour. Specifically, canonical microcircuit models were fitted to the iEEG traces, and a Bayesian approach was used to incorporate the influence of multiple receptors and improve information gain. As a validation approach, a null model in which synaptic receptor maps were shuffled was considered. In their original work, the authors convincingly use mesoscale models (coupled neural masses) to link micro‐scale synaptic properties (receptor densities) to macro‐scale functional properties, namely brain oscillations at specific frequencies.
The main finding of Stoof et al. is that no single neurotransmitter receptor explains any specific oscillatory frequency in isolation. Instead, regional oscillatory spectra arise from a balanced combination of synaptic receptors, summarised as four principal components in a data‐driven decomposition of receptor density maps. The inclusion of densities of three primary synaptic receptors—AMPAR, NMDAR, and GABAR (A or B)—significantly improved the fit of canonical neural mass models to better render oscillatory spectra compared to null and baseline configurations, suggesting a dominant role of the excitatory/inhibitory balance in setting oscillation frequency. The addition of receptors mediating neuromodulatory control by acetylcholine, dopamine, serotonin, and noradrenaline only marginally enhanced the fits, suggesting that neuromodulation exerts subtler, likely context‐dependent effects on momentary brain oscillations.
As with any pioneering multimodal study, several limitations exist and present opportunities for future research. A primary caveat is that spatially sparse iEEG data and receptor densities were obtained from different cohorts, necessitating ample interpolation of both datasets into a common MNI template space. While such spatial normalisation is standard practice in MRI research, its emerging application to iEEG poses additional problems because recordings are very sparse and biased towards sampling of epileptic brain regions. Here, iEEG traces were recorded over only 60 s of wakefulness from 1770 electrodes crossing relatively healthy brain tissue on their way to putative seizure foci (Frauscher et al. 2018). The data did not include actual probing of the excitability in different brain regions, which is achievable with iEEG (Friedrichs‐Maeder et al. 2025). Receptor density data (Zilles and Palomero‐Gallagher 2017) was limited to post‐mortem in vitro layer‐specific receptor autoradiography from three healthy, but aged donors. Thus, this limited static map of synaptic receptors cannot reflect the variability in synaptic receptor density possibly found in a broader and/or younger population. To scale up the approach, future similar work could leverage existing PET (positron emission tomography) atlases of synaptic receptors collated among 1200 individuals (Hansen et al. 2022) or magnetic resonance spectroscopy imaging (MRSI) data that is emerging as a complementary modality to probe neurotransmitter content at the timescale of minutes (Kasten et al. 2016; Bogner et al. 2021).
Furthermore, the canonical microcircuit model used for DCM did not explicitly include neuromodulatory synapses, nor a connectome. In each brain region, iEEG sampled a few nodes (here, electrodes), and the recorded data were represented as fixed spectra, thereby capturing the stationary characteristics of regional oscillations in isolation, but not the temporally evolving nature of coupled oscillatory networks.
In sum, Stoof et al. provide a compelling step forward in our understanding of synaptic tuning of brain rhythms, which will undoubtedly stimulate refined efforts to integrate receptor mapping, iEEG, and network modelling into a unified framework of brain function and dysfunction. Ultimately, apprehending the spatiotemporal unfolding of brain oscillations will require moving beyond static maps of neuromodulators and integrating them into models that capture the full electrochemical and network complexity of the human brain.
Funding
The authors have nothing to report.
Conflicts of Interest
The authors declare no conflicts of interest.
The reference list from the paper itself. Each links out to its DOI / PubMed record.
- 1Bogner, W. , R. Otazo , and A. Henning . 2021. “Accelerated MR Spectroscopic Imaging—A Review of Current and Emerging Techniques.” NMR in Biomedicine 34: e 4314.32399974 10.1002/nbm.4314 PMC 8244067 · doi ↗ · pubmed ↗
- 2Frauscher, B. , N. von Ellenrieder , R. Zelmann , et al. 2018. “Atlas of the Normal Intracranial Electroencephalogram: Neurophysiological Awake Activity in Different Cortical Areas.” Brain 141, no. 4: 1130–1144. 10.1093/brain/awy 035.29506200 · doi ↗ · pubmed ↗
- 3Friedrichs‐Maeder, C. , G. Lepeu , and M. O. Baud . 2025. “Gauging and Controlling Excitability in Cortical Disorders.” Current Opinion in Neurology 38, no. 2: 140–150. 10.1097/WCO.0000000000001345.39960270 · doi ↗ · pubmed ↗
- 4Hansen, J. Y. , G. Shafiei , R. D. Markello , et al. 2022. “Mapping Neurotransmitter Systems to the Structural and Functional Organization of the Human Neocortex.” Nature Neuroscience 25: 1569–1581. 10.1038/s 41593-022-01186-3.36303070 PMC 9630096 · doi ↗ · pubmed ↗
- 5Kasten, J. A. , A. Klauser , F. Lazeyras , and D. Van De Ville . 2016. “Magnetic Resonance Spectroscopic Imaging at Superresolution: Overview and Perspectives.” Journal of Magnetic Resonance 263: 193–208.26766215 10.1016/j.jmr.2015.11.003 · doi ↗ · pubmed ↗
- 6Stoof, U. M. , K. J. Friston , M. Tisdall , G. K. Cooray , and R. E. Rosch . 2025. “Topographic Variation in Human Neurotransmitter Receptor Densities Explains Differences in Intracranial EEG Spectra.” Human Brain Mapping 46, no. 16: e 70393. 10.1002/hbm.70393.41171139 PMC 12576962 · doi ↗ · pubmed ↗
- 7Zilles, K. , and N. Palomero‐Gallagher . 2017. “Multiple Transmitter Receptors in Regions and Layers of the Human Cerebral Cortex.” Frontiers in Neuroanatomy 11: 78. 10.3389/fnana.2017.00078.28970785 PMC 5609104 · doi ↗ · pubmed ↗