Ameliorative Effects of Aerobic Exercise Combined With Lycium barbarum Polysaccharide‐Mediated Gut Microbiota Remodeling on Glycolipid Abnormalities in Type 2 Diabetic Rats
Jing‐feng Wang, Shuo Feng, Xuan Cao, Xiao‐lin Li

TL;DR
Aerobic exercise and Lycium barbarum polysaccharide improve type 2 diabetes in rats by reshaping gut bacteria and enhancing metabolism.
Contribution
The study reveals a combined effect of exercise and LBP on gut microbiota and T2DM via the AMPK/PGC-1α pathway.
Findings
Aerobic exercise and LBP modulate gut microbiota to reduce harmful bacteria and promote beneficial ones.
The combination of exercise and LBP improves insulin sensitivity and lipid metabolism in T2DM rats.
Isobutyric acid and gut microbiota are linked to the therapeutic effects of the interventions.
Abstract
Exercise plays an important role in improving type 2 diabetes (T2DM) by regulating systemic metabolism and enhancing glycemic control. Lycium barbarum polysaccharide (LBP), a natural bioactive component, also exhibits potential for lowering blood glucose and alleviating diabetes‐related symptoms. However, the underlying mechanisms by which exercise, LBP, or their combination alleviate T2DM remain largely unclear from the perspective of gut microbiota. In this study, we used 16S rDNA sequencing to analyze gut microbiota, aiming to investigate the roles of aerobic exercise and LBP in T2DM and explore their molecular mechanisms. We found that both aerobic exercise and LBP could modulate gut microbiota—promoting the proliferation of beneficial bacteria, reducing harmful bacteria, and optimizing intestinal microecology—while regulating gut microbial composition and metabolism to inhibit…
Genes, proteins, chemicals, diseases, species, mutations and cell lines named across the full text — each resolved to its canonical identifier and authoritative record.
Click any figure to enlarge with its caption.
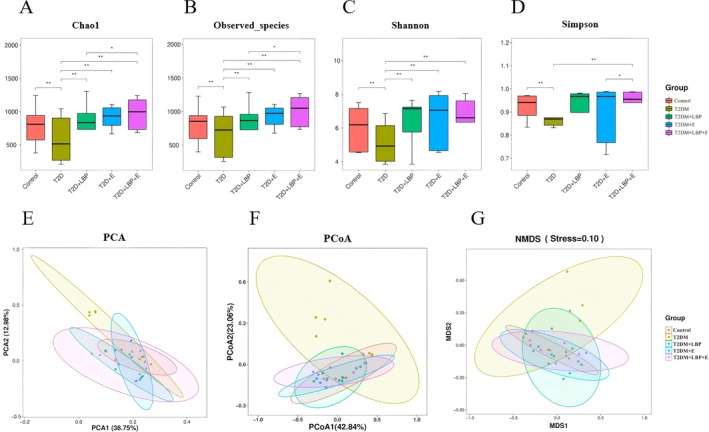 FIGURE 1
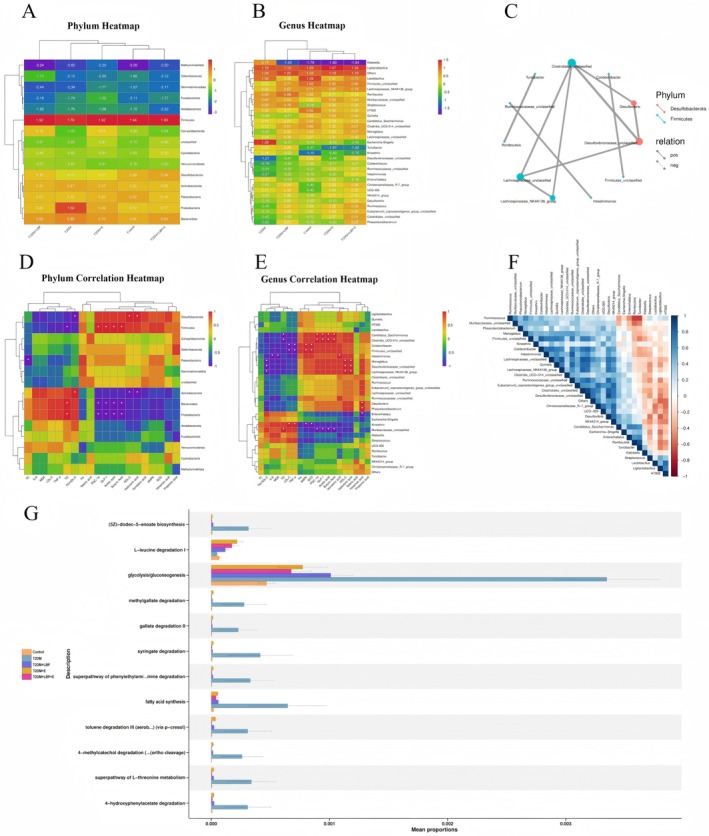 FIGURE 2
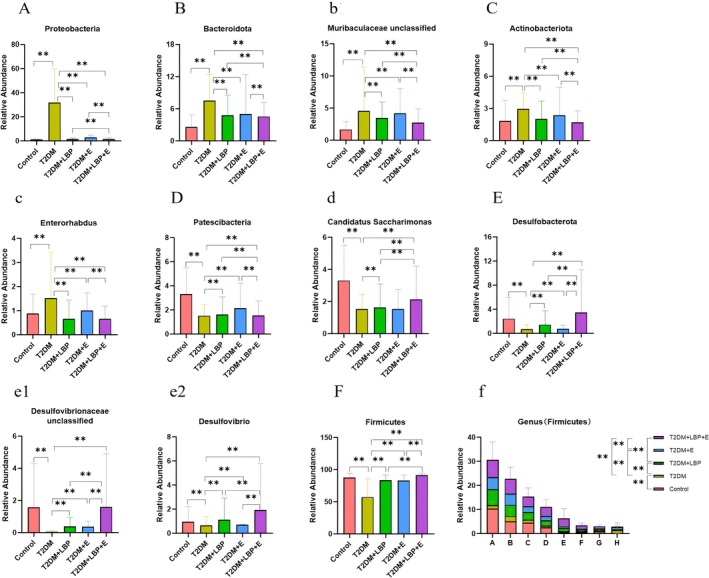 FIGURE 3
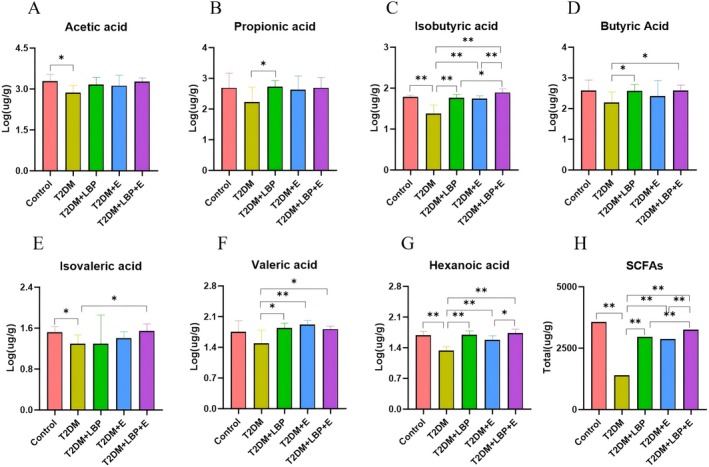 FIGURE 4
 FIGURE 5
 FIGURE 6
| Phylum | Genus | Acetic acid | Butyric acid | Hexanoic acid | Isobutyric acid | Isovaleric acid | Propionic acid | Valeric acid | |||||||
|---|---|---|---|---|---|---|---|---|---|---|---|---|---|---|---|
| a | b | a | b | a | b | a | b | a | b | a | b | a | b | ||
|
| +* | 0.017 | +* | 0.025 | + | 0.233 | + | 0.083 | + | 0.133 | + | 0.233 | N | 1.000 | |
|
| + | 0.950 | + | 0.942 | N | 1.000 | + | 0.783 | + | 0.350 | − | 0.517 | + | 0.517 | |
|
| + | 0.683 | + | 0.691 | − | 0.683 | + | 0.950 | + | 0.783 | − | 0.683 | − | 0.133 | |
|
| + | 0.083 | + | 0.095 | + | 0.450 | + | 0.133 | + | 0.083 | + | 0.517 | + | 0.950 | |
|
| + | 0.083 | + | 0.078 | + | 0.083 | +* | 0.017 | + | 0.083 | + | 0.350 | + | 0.950 | |
|
| − | 0.950 | − | 0.935 | N | 1.000 | − | 0.783 | − | 0.350 | + | 0.517 | − | 0.517 | |
|
| + | 0.783 | + | 0.792 | − | 0.45 | − | 0.950 | + | 0.783 | − | 0.683 | − | 0.783 | |
|
| − | 0.233 | − | 0.225 | − | 0.783 | − | 0.350 | − | 0.133 | N | 1 | + | 0.783 | |
|
| +* | 0.017 | +* | 0.022 | + | 0.233 | + | 0.083 | + | 0.133 | + | 0.233 | N | 1.000 | |
|
| + | 0.083 | + | 0.090 | + | 0.083 | +* | 0.017 | + | 0.083 | + | 0.350 | + | 0.950 | |
|
| + | 0.950 | + | 0.940 | N | 1.000 | + | 0.783 | + | 0.350 | − | 0.517 | + | 0.517 | |
|
| + | 0.517 | + | 0.505 | + | 0.083 | + | 0.233 | + | 0.350 | + | 0.450 | + | 0.350 | |
|
| + | 0.517 | + | 0.510 | + | 0.083 | + | 0.233 | + | 0.350 | + | 0.450 | + | 0.350 | |
|
| + | 0.517 | + | 0.525 | + | 0.083 | + | 0.233 | + | 0.350 | + | 0.450 | + | 0.350 | |
|
| + | 0.683 | + | 0.670 | + | 0.233 | + | 0.350 | + | 0.233 | + | 0.783 | + | 0.233 | |
|
| N | 1.000 | N | 0.995 | + | 0.233 | + | 0.517 | + | 0.683 | + | 0.783 | + | 0.45 | |
|
| − | 0.783 | − | 0.770 | + | 0.450 | + | 0.950 | − | 0.783 | + | 0.683 | + | 0.783 | |
|
| + | 0.233 | + | 0.220 | +* | 0.017 | + | 0.083 | + | 0.233 | + | 0.233 | + | 0.683 | |
|
| − | 0.683 | − | 0.668 | + | 0.783 | N | 1.000 | + | 0.783 | − | 0.783 | + | 0.133 | |
|
| − | 0.950 | − | 0.958 | N | 1.000 | − | 0.783 | − | 0.350 | + | 0.517 | − | 0.517 | |
|
| + | 0.450 | + | 0.442 | + | 0.350 | + | 0.233 | + | 0.083 | + | 0.950 | + | 0.450 | |
|
| + | 0.133 | + | 0.125 | + | 0.233 | + | 0.083 | +* | 0.017 | + | 0.683 | + | 0.783 | |
|
| − | 0.083 | − | 0.075 | − | 0.45 | − | 0.133 | − | 0.083 | − | 0.517 | − | 0.950 | |
|
| + | 0.083 | + | 0.068 | + | 0.450 | + | 0.133 | + | 0.083 | + | 0.517 | + | 0.950 | |
|
| −* | 0.017 | −* | 0.019 | − | 0.233 | − | 0.083 | − | 0.133 | − | 0.233 | N | 1 | |
|
| − | 0.517 | − | 0.502 | − | 0.083 | − | 0.233 | − | 0.35 | − | 0.450 | − | 0.350 | |
|
| − | 0.450 | − | 0.435 | − | 0.350 | − | 0.233 | − | 0.083 | − | 0.950 | − | 0.450 | |
|
| −* | 0.017 | −* | 0.027 | − | 0.233 | − | 0.083 | − | 0.133 | − | 0.233 | N | 1 | |
|
| −* | 0.017 | −* | 0.020 | − | 0.233 | − | 0.083 | − | 0.133 | − | 0.233 | N | 1 | |
|
| − | 0.083 | − | 0.080 | − | 0.083 | −* | 0.017 | − | 0.083 | − | 0.350 | − | 0.950 | |
|
| − | 0.233 | − | 0.215 | −* | 0.017 | − | 0.083 | − | 0.233 | − | 0.233 | − | 0.683 | |
|
| + | 0.350 | + | 0.342 | + | 0.950 | + | 0.683 | + | 0.517 | + | 0.450 | + | 0.517 | |
|
| +* | 0.017 | +* | 0.023 | + | 0.233 | + | 0.083 | + | 0.133 | + | 0.233 | N | 1 | |
|
| + | 0.083 | + | 0.091 | + | 0.083 | +* | 0.017 | + | 0.083 | + | 0.350 | + | 0.950 | |
|
| + | 0.083 | + | 0.942 | + | 0.083 | +* | 0.017 | + | 0.083 | + | 0.350 | + | 0.950 | |
|
| + | 0.233 | + | 0.225 | +* | 0.017 | + | 0.083 | + | 0.233 | + | 0.233 | + | 0.683 | |
| Phylum | Genus | TC | TG | HDL‐C | LDL‐C | TG/HDL‐C | Ins | GLP‐1 | TNF‐α | IL‐6 | AMPK | PGC‐1α | SOD | MDA | |||||||||||||
|---|---|---|---|---|---|---|---|---|---|---|---|---|---|---|---|---|---|---|---|---|---|---|---|---|---|---|---|
| a | b | a | b | a | b | a | b | a | b | a | b | a | b | a | b | a | b | a | b | a | b | a | b | a | b | ||
|
| − | 0.35 | −* | 0.031 | + | 0.092 | − | 0.083 | − | 0.096 | + | 0.126 | +* | 0.019 | − | 0.088 | − | 0.142 | + | 0.078 | +* | 0.035 | + | 0.079 | − | 0.140 | |
|
| − | 0.683 | − | 0.965 | + | 0.795 | − | 0.450 | − | 0.798 | + | 0.342 | + | 0.938 | − | 0.455 | − | 0.359 | + | 0.444 | + | 0.957 | + | 0.446 | − | 0.360 | |
|
| − | 0.95 | − | 0.675 | + | 0.963 | − | 0.517 | − | 0.965 | + | 0.775 | + | 0.700 | − | 0.522 | − | 0.792 | + | 0.511 | + | 0.688 | + | 0.512 | − | 0.791 | |
|
| − | 0.233 | − | 0.072 | + | 0.145 | −* | 0.017 | − | 0.147 | + | 0.075 | + | 0.101 | −* | 0.022 | − | 0.092 | +* | 0.012 | + | 0.088 | +* | 0.013 | − | 0.091 | |
|
| − | 0.683 | − | 0.099 | +* | 0.031 | − | 0.133 | − | 0.032 | + | 0.076 | + | 0.065 | − | 0.138 | − | 0.093 | + | 0.128 | + | 0.100 | + | 0.129 | 0.090 | ||
|
| + | 0.683 | + | 0.968 | − | 0.796 | + | 0.45 | + | 0.797 | − | 0.341 | − | 0.947 | + | 0.456 | + | 0.358 | − | 0.443 | − | 0.952 | − | 0.445 | + | 0.359 | |
|
| − | 0.35 | − | 0.775 | − | 0.964 | − | 0.450 | + | 0.962 | + | 0.774 | + | 0.800 | − | 0.452 | − | 0.793 | + | 0.444 | + | 0.788 | + | 0.447 | − | 0.790 | |
|
| + | 0.45 | + | 0.241 | − | 0.363 | + | 0.083 | + | 0.365 | − | 0.125 | − | 0.218 | + | 0.087 | + | 0.141 | − | 0.077 | − | 0.239 | − | 0.079 | + | 0.140 | |
|
| − | 0.35 | −* | 0.030 | + | 0.094 | − | 0.083 | − | 0.095 | + | 0.127 | +* | 0.018 | − | 0.089 | − | 0.142 | + | 0.076 | +* | 0.028 | + | 0.078 | − | 0.141 | |
|
| − | 0.683 | − | 0.075 | +* | 0.030 | − | 0.133 | −* | 0.031 | + | 0.074 | + | 0.085 | − | 0.139 | − | 0.092 | + | 0.127 | + | 0.098 | + | 0.128 | − | 0.090 | |
|
| − | 0.683 | − | 0.962 | + | 0.794 | − | 0.450 | − | 0.795 | + | 0.340 | + | 0.932 | − | 0.454 | − | 0.359 | + | 0.445 | + | 0.955 | + | 0.446 | − | 0.360 | |
|
| N | 1 | − | 0.528 | + | 0.246 | − | 0.683 | − | 0.247 | + | 0.342 | + | 0.499 | − | 0.688 | − | 0.358 | + | 0.677 | + | 0.532 | + | 0.679 | − | 0.357 | |
|
| N | 1 | − | 0.530 | + | 0.245 | − | 0.683 | − | 0.244 | + | 0.341 | + | 0.502 | − | 0.689 | − | 0.359 | + | 0.676 | + | 0.522 | + | 0.678 | − | 0.358 | |
|
| N | 1 | − | 0.508 | + | 0.246 | − | 0.683 | − | 0.245 | + | 0.343 | + | 0.535 | − | 0.687 | − | 0.360 | + | 0.678 | + | 0.519 | + | 0.677 | − | 0.359 | |
|
| − | 0.95 | − | 0.695 | + | 0.362 | − | 0.517 | − | 0.363 | + | 0.225 | + | 0.685 | − | 0.523 | − | 0.242 | + | 0.510 | + | 0.698 | + | 0.511 | − | 0.241 | |
|
| + | 0.517 | N | 1.012 | + | 0.530 | + | 0.950 | − | 0.531 | − | 0.675 | N | 0.988 | + | 0.956 | − | 0.692 | − | 0.943 | N | 1.005 | − | 0.945 | − | 0.691 | |
|
| + | 0.35 | + | 0.795 | + | 0.963 | + | 0.450 | − | 0.964 | − | 0.776 | − | 0.802 | + | 0.453 | + | 0.792 | − | 0.445 | − | 0.781 | − | 0.444 | + | 0.790 | |
|
| − | 0.95 | − | 0.245 | + | 0.095 | − | 0.450 | − | 0.094 | + | 0.224 | + | 0.230 | − | 0.455 | − | 0.243 | + | 0.447 | + | 0.250 | + | 0.446 | − | 0.240 | |
|
| + | 0.95 | + | 0.692 | N | 1.014 | + | 0.950 | N | 1.015 | N | 0.775 | − | 0.702 | + | 0.957 | − | 0.793 | − | 0.946 | − | 0.680 | − | 0.944 | − | 0.791 | |
|
| + | 0.683 | + | 0.938 | − | 0.796 | + | 0.450 | + | 0.797 | − | 0.342 | − | 0.969 | + | 0.454 | + | 0.358 | − | 0.448 | − | 0.945 | − | 0.443 | + | 0.359 | |
|
| − | 0.683 | − | 0.465 | + | 0.246 | − | 0.233 | − | 0.245 | + | 0.075 | + | 0.438 | − | 0.238 | − | 0.091 | + | 0.227 | + | 0.457 | + | 0.228 | − | 0.090 | |
|
| − | 0.517 | − | 0.141 | + | 0.094 | − | 0.083 | − | 0.095 | + | 0.076 | + | 0.118 | − | 0.088 | −* | 0.028 | + | 0.079 | + | 0.139 | + | 0.077 | −* | 0.027 | |
|
| + | 0.233 | + | 0.092 | − | 0.146 | +* | 0.017 | + | 0.145 | − | 0.074 | − | 0.085 | +* | 0.023 | + | 0.092 | −* | 0.010 | − | 0.102 | −* | 0.011 | + | 0.090 | |
|
| − | 0.233 | − | 0.098 | + | 0.147 | − | 0.017 | − | 0.146 | + | 0.075 | + | 0.079 | −* | 0.021 | − | 0.093 | +* | 0.013 | + | 0.089 | +* | 0.012 | − | 0.091 | |
|
| + | 0.35 | +* | 0.032 | − | 0.095 | + | 0.083 | + | 0.094 | − | 0.126 | −* | 0.024 | + | 0.089 | + | 0.142 | − | 0.076 | −* | 0.018 | − | 0.078 | + | 0.140 | |
|
| N | 1 | + | 0.533 | − | 0.246 | + | 0.683 | + | 0.245 | − | 0.341 | − | 0.515 | + | 0.689 | + | 0.359 | − | 0.677 | − | 0.529 | − | 0.678 | + | 0.360 | |
|
| + | 0.683 | + | 0.468 | − | 0.244 | + | 0.233 | + | 0.243 | − | 0.076 | − | 0.447 | + | 0.239 | + | 0.092 | − | 0.226 | − | 0.452 | − | 0.228 | + | 0.090 | |
|
| + | 0.35 | +* | 0.035 | − | 0.093 | + | 0.083 | + | 0.092 | − | 0.125 | −* | 0.015 | + | 0.087 | + | 0.141 | − | 0.077 | −* | 0.029 | − | 0.079 | + | 0.140 | |
|
| + | 0.35 | + | 0.033 | − | 0.094 | + | 0.083 | + | 0.095 | − | 0.127 | −* | 0.016 | + | 0.088 | + | 0.142 | − | 0.076 | −* | 0.025 | − | 0.078 | + | 0.141 | |
|
| + | 0.683 | + | 0.095 | −* | 0.030 | + | 0.133 | +* | 0.031 | − | 0.074 | − | 0.070 | + | 0.138 | + | 0.093 | − | 0.127 | − | 0.103 | − | 0.129 | + | 0.091 | |
|
| + | 0.95 | + | 0.248 | − | 0.095 | + | 0.45 | + | 0.094 | − | 0.226 | − | 0.229 | + | 0.455 | + | 0.242 | − | 0.446 | − | 0.235 | − | 0.444 | + | 0.241 | |
|
| −* | 0.017 | − | 0.365 | + | 0.696 | − | 0.233 | − | 0.697 | + | 0.509 | + | 0.338 | − | 0.238 | − | 0.526 | + | 0.228 | + | 0.357 | + | 0.227 | − | 0.525 | |
|
| − | 0.35 | −* | 0.031 | + | 0.094 | − | 0.083 | − | 0.093 | + | 0.125 | +* | 0.018 | − | 0.089 | − | 0.141 | + | 0.078 | +* | 0.026 | + | 0.077 | − | 0.140 | |
|
| − | 0.683 | − | 0.075 | +* | 0.030 | − | 0.133 | −* | 0.031 | + | 0.075 | + | 0.100 | − | 0.139 | − | 0.092 | + | 0.129 | + | 0.088 | + | 0.128 | − | 0.090 | |
|
| − | 0.683 | − | 0.965 | +* | 0.032 | − | 0.133 | − | 0.031 | +* | 0.076 | + | 0.938 | − | 0.138 | − | 0.093 | + | 0.128 | + | 0.957 | + | 0.127 | − | 0.091 | |
|
| − | 0.95 | − | 0.241 | + | 0.095 | − | 0.450 | − | 0.094 | + | 0.225 | + | 0.218 | − | 0.456 | − | 0.243 | + | 0.443 | + | 0.239 | + | 0.445 | − | 0.240 | |
- —Harbin sport university Intra‐school Doctoral Talent Research Initiation Fund Project
- —Natural Science Foundation of Heilongjiang Province10.13039/501100005046
Peer Reviews
No public reviews on file for this paper yet. If you reviewed it on a platform where reviews are public (OpenReview, ICLR, NeurIPS, ICML), you can paste yours below so the community can read it here.
Videos
No videos yet. Explain this paper in a talk, walkthrough, or lecture? Add one.
Taxonomy
TopicsGut microbiota and health · Polysaccharides and Plant Cell Walls · Adipokines, Inflammation, and Metabolic Diseases
Introduction
1
Maintaining a balanced, reciprocal interaction between the host and intestinal microecology is crucial, as gut microbiota is a key regulator of host health. Many chronic diseases, including type 2 diabetes mellitus (T2DM)—a globally prevalent metabolic disorder—are linked to intestinal microecological dysbiosis; changes in gut microbial composition, a major environmental variable, further associate with metabolic impairments (Yehualashet and Yikna 2021). T2DM incidence and mortality continue to rise, posing a significant public health challenge. Currently incurable, its interventions primarily focus on glycemic control and managing complications, with gut microbiota playing a critical regulatory role in its development. External factors like dietary imbalance and physical inactivity have also driven a marked increase in T2DM incidence (Kang et al. 2022).
As a non‐pharmacological intervention, exercise prevents and improves T2DM by boosting energy expenditure, metabolic rate, glucose homeostasis, and insulin sensitivity (Balducci et al. 2014). It also enhances gut microbial biodiversity, beneficial bacterial abundance, and microbial metabolic capacity (Motiani et al. 2020; Li and Guo 2023), while reducing tumor necrosis factor levels in intestinal lymphocytes, stimulating antioxidant synthesis, and inhibiting inflammatory factor release (Campbell and Wisniewski 2017)—making it a key lifestyle strategy for improving health and reducing chronic disease risk (Keirns et al. 2020). Modulating gut microbiota via probiotics, prebiotics, synbiotics, or fecal microbial transplantation is another promising T2DM treatment (Iatcu et al. 2022). For instance, *Lycium barbarum
- polysaccharide (LBP) exhibits prebiotic activity, balancing intestinal microbial composition, enhancing host bacterial abundance, and improving immunity (Zhu et al. 2020). Recent studies further highlight its health benefits, including antioxidant, anti‐inflammatory, anti‐tumor, neuroprotective, glucose‐lowering, and lipid‐lowering effects (Li et al. 2024).
Most existing T2DM studies focus on either aerobic exercise (e.g., its effects on metabolic indices) or LBP (e.g., its hypoglycemic efficacy), with few exploring their combination. This study is the first to use aerobic exercise combined with LBP as an intervention, investigating their individual and synergistic effects on T2DM from a gut microbiota perspective. This innovative combined intervention may yield more pronounced benefits than single interventions, potentially providing a more effective non‐pharmacological treatment option for T2DM patients.
Materials and Methods
2
Laboratory Animals and Reagents
2.1
Purchased from the Centre for Safety Assessment of Heilongjiang University of Traditional Chinese Medicine, 35 SPF‐grade 8‐week‐old male SD rats served as experimental animals in this work. LBP came from Shanghai Yuanye Biotechnology Co. LTD. Detailed experimental reagents and equipment are listed in Tables S1 and S2. The study was approved by the Academic Ethics Committee of Harbin Sport University (2024056).
Experimental Grouping and Animal Model Establishment
2.2
The 35 male SD rats were chosen; 6 of them were randomly chosen to create a blank control group (Control, 6 rats) following 1 week of adaptive eating on normal feed; the remaining 29 rats were T2DM modeled. Eight weeks of high‐sugar, high‐fat diet produced insulin resistance in the modeled rats. First fed high‐sugar and high‐fat chow (Feed ratio: 10% lard, 20% sucrose, 2.5% cholesterol, 0.5% sodium cholate, 67% maintenance feed) for 8 weeks to establish insulin resistance, the modeling rats were fasted without water for 12 h at the end of the feeding period. A single injection of 1% streptozotocin solution (35 mg/kg) was administered into the tail vein to simulate the onset of T2DM. The fasting blood glucose concentration of the rats was measured 72 h after the injection, and the modeling was considered successful if the concentration was ≥ 16.7 mmol/L. The final modeling was successful in 24 rats. Finally, 24 rats were successfully modeled. By means of a random grouping technique, the 24 T2DM rats were split into four groups: blank control group (T2DM group, 6), LBP intervention group (T2DM + LBP group, 6), exercise training group (T2DM + E group, 6), and exercise combined with LBP group (T2DM + LBP + E group, 6). Relative humidity of 55%–70%, a room temperature of 20°C–25°C, and a clean, orderly environment defined the well‐ventilated laboratory. The rats were housed in separate cages, 6 rats per cage, with 12 h of light exposure per day, and the rats were free to eat and drink.
Aerobic Exercise Intervention Program
2.3
Means of exercise intervention: Week 1 was the adaptive intervention phase. In order to allow the rats' bodies to gradually adapt to the running platform exercise and to avoid injuries or excessive fatigue caused by high‐intensity exercise at the beginning, the rats in the exercise group were acclimatized to the running platform at a speed of 10 m/min for 10 min, and then the running platform speed was incremented by 2 m/min each day, and the training time was increased by 10 min, until reaching a speed of 20 m/min for 60 min on the 6th day, and resting on the 7th day (Kleinert et al. 2018; Saraceni and Broderick 2007; Chiasera et al. 2000). The slope was set at 5° to simulate an environment closer to the actual exercise scenario and also to help exercise the leg muscle strength and balance of the rats (Lin et al. 2021). Weeks 2 through 13 were the formal training phase. In order to maintain and further improve the aerobic metabolic capacity, cardiovascular function, and muscular endurance of the rats, the present study entered the formal intervention phase at the speed, time, and incline of day 6 of the acclimatization training from week 2 until the end of the intervention cycle (Haram et al. 2009). In order to be able to ensure sufficient exercise stimulation to promote adaptive changes in various body systems and also to give the rats appropriate rest time to avoid fatigue and injury caused by overtraining, all rats in this study were trained once a day for 5 days per week (Zhang et al. 2023).
Dosage Information/Dosage Regimen
2.4
Administration was performed at 1 h after the rats' morning feeding daily. LBP was prepared as an aqueous solution at a concentration of 200 mg/(kg·bw·day) and was given 2 mL per dose by gavage. The gavage is carried out once a day for 12 weeks. Rationalization: 200 mg/(kg·bw·day) based on body weight, which can be administered accurately according to the individual differences of rats, and this dose can ensure that the drug can achieve certain pharmacological effects without producing serious toxic side effects due to overdose. The gastrointestinal tract of rats is active 1 h after feeding in the early morning. Fixed administration at this time is conducive to the maintenance of stable blood concentration and makes it easy to assess the efficacy of the drug. The use of distilled water as a solvent will not interfere with the drug and will help in accurate dispensing. The volume of 2 mL per gavage is suitable to ensure the distribution of the drug without increasing the gastrointestinal burden on the rats. The dosing arrangement of once daily for 12 weeks can maintain the sustained action of the drug and provide sufficient data for the study by observing the long‐term efficacy and mechanism of the drug. In addition, dosage of LBP could be supplemented either by regular diet (LBP) or by corresponding supplements. The human equivalent dose is calculated using the following formula: HEDhuman equivalent dose=Animal dosemg/kg ×Animal weightkgHuman weightkg×Human body surface areams²Animal body surface areams². The human equivalent dose is 44.3 mg/(kg·bw·day) (Ma et al. 2022; Liu et al. 2019, 2021; Ding et al. 2022; Lai et al. 2022).
General and Fasting Blood Sugar Test
2.5
Rats in every group had daily mental state and activity level observed. Every week, the weight of the rats was noted concurrently. For every group of rats, a fasting blood glucose test was performed simultaneously every week; the rats were fasted 12 h before the test. Rats' blood samples were taken by tail vein punctures, and test strips and a matching blood glucose detector were used to ascertain blood glucose content.
Enzyme‐Linked Immunosorbent Assay (ELISA)
2.6
Serum triglyceride (TG), total cholesterol (TC), high‐density lipoprotein (HDL‐C/LDL‐C), insulin (Ins), interleukin‐6 (IL‐6), tumor necrosis factor‐α (TNF‐α), glucagon peptide (GLP‐1), malondialdehyde (MDA), and superoxide dismutase (SOD) levels were detected by an ELISA kit matching the indexes. The rat serum samples were thoroughly mixed with 1 mL of PBS (pH 7.2–7.4). Next, set up a 96‐well plate by adding 50 μL of different standard concentrations into the standard wells, leaving the blank wells without samples or enzyme‐labeled reagent. For the test wells, dilute the samples by mixing 10 μL of serum with 40 μL of diluent—make sure to pipette this mixture to the bottom of the well without touching the sides, and mix it gently. Then, add 100 μL of enzyme‐labeled reagent to all wells except the blanks, cover the plate, and let it sit at 37°C for 60 min. At the same time, prepare a 20× wash buffer by mixing it 1:20 with distilled water for later use. After incubation, add 50 μL each of Developer A and B to all wells, mix gently, and incubate in the dark at 37°C for 15 min. Stop the reaction by adding 50 μL of stop solution, which will quickly change the color from blue to yellow, and then measure the absorbance (OD) at 450 nm within 15 min after adding the stop solution.
qRT‐PCR
2.7
Total RNA was extracted from rat pancreas, colon, and liver using TRIzol reagent (Invitrogen) as follows: 10 μg of total RNA was purified from organic solvents, treated with RNase‐free DNase I (Roche), and then reverse transcribed to synthesize cDNA using oligo dT primer and SuperScript II RT enzyme (Invitrogen). The cDNA was synthesized by reverse transcription using oligo dT primer and SuperScript II RT enzyme (Invitrogen). The resulting cDNA served as a template for quantitative real‐time PCR, with rp49 as the internal reference gene for RNA normalization. Reactions were carried out in triplicate on an ABI7300 equipment (Applied Biosystems) using SYBR Green, and gene expression was examined using the comparative CT approach (Applied Biosystems). AMPK: S: 5′‐GTCAAGGTGGCCGTCAAGATA‐3′, A: 5′‐CAACTTGATGATGTGCGGATG‐3′. PGC‐1α: S: 5′‐ACCTGGCGATTCTGATTATGACT‐3′, A: 5′‐CCTTTACATTGTCCACATAGCGT‐3′.
High‐Throughput Sequencing of 16S rDNA From Gut Microbiota
2.8
Fresh fecal samples from 6 mice per group were collected and subjected to total microbial DNA extraction using the CTAB method, with extraction quality verified by agarose gel electrophoresis and DNA concentration quantified via UV spectrophotometry. PCR amplification targeted multiple variable regions—V3‐V4 (primers 341F/805R), V4 (515F/806R), V4‐V5 (F/R primers), and archaea‐specific regions (F/R primers)—to generate amplicons, which were purified using AMPure XT beads, quantified with Qubit, and validated for library quality using the Agilent 2100 Bioanalyzer and Illumina's library kit. Libraries that met the quality standard (at least 2 nM) were combined, heated with NaOH to create single strands, and then sequenced on a NovaSeq 6000 sequencer using 250 bp paired‐end reads. After sequencing, the data were sorted by barcode, trimmed to get rid of adapter and barcode sequences, and checked for quality using the QIIME DADA2 pipeline to produce ASV (Amplicon Sequence Variant) feature sequences. These sequences were annotated to microbial species against the SILVA database, and relative abundances of taxa across samples were calculated from the resulting ASV abundance table.
Determination of Short‐Chain Fatty Acids by Liquid Chromatography‐Mass Spectrometry
2.9
Weigh 50 mg of sample, add sufficient 80% methanol–water, grind thoroughly, and centrifuge at 20,000 × g for 15 min at 4°C. Transfer 20 μL of the supernatant to a 1.5 mL centrifuge tube, add EDC solution and 3‐NPH for derivatization, dilute to 500 μL with the initial mobile phase (water as phase A and methanol‐acetonitrile (1:1, v/v) as phase B), vortex mix, and transfer 200 μL to an injection vial. Agilent Poroshell 120 EC‐C18 column (2.7 μm, 2.1 × 100 mm) is run chromatographically at 40°C using a 2 μL injection volume. Mass spectrometry uses multiple reaction monitoring (MRM) in negative ion mode. Compounds are identified by comparing retention times and MRM fragment ions with standards and quantified via the internal standard method; samples with concentrations exceeding the calibration curve range are reanalyzed after appropriate dilution, with results based on diluted measurements.
Statistical Analyses
2.10
Data analysis of gut microbiota was performed using R language software. Correlation clustering heatmap and heatmap: the data was analyzed by clustering using the pheatmap package and presented as a clustered heatmap. Correlation network graph: use the igraph package to calculate the correlation matrix between variables, and then use the correlation function to convert it into a network graph and visualize it. Alpha diversity: Use the vegan package to calculate the metrics, such as species richness, the Shannon diversity index, etc., and combine them with the plotting packages, such as ggplot2, for the visualization. Beta diversity: Use the functions in the vegan package to visualize the data in terms of PCA, PCoA, and NMDS functions for principal component, principal coordinate, and non‐metric multidimensional scaling analysis and plotting presentation. Statistical significance for weight and blood glucose levels was assessed via log‐rank testing. Independent samples t‐tests, multifactor ANOVA (using SPSS software), and post hoc LSD testing examined group comparisons for notable differences. Prism software was utilized in the test for data analysis as well as for graphing. α = 0.05 (or 0.01) was used as the level of significance. Statistical differences are expressed as follows: *p < 0.05; **p < 0.01; ns for not statistically significant.
Results
3
Effects of Aerobic Exercise and LBP on the Diversity of Gut Microbiota in T2DM Rats
3.1
α‐Diversity
3.1.1
Compared with the T2DM group, Observed species, Chao1, and Shannon were significantly higher in the Control, T2DM + LBP, T2DM + E, and T2DM + LBP + E groups (p < 0.01) (Figure 1A–C). Compared with the T2DM group, Simpson was significantly higher in Control and T2DM + LBP + E (p < 0.01) (Figure 1D).
Alpha diversity analysis and Beta diversity analysis. (A, B) Chao1 and Observed_species: assessment of the number of species included in the gut microbiota. (C, D) Shannon and Simpson: assessment of gut microbiota diversity. (E) PCA: Principal Component Analysis. (F) PCoA: Principal Coordinates Analysis. (G) NMDS, nonmetric multidimensional scaling. * indicates p < 0.05, ** indicates p < 0.01.
Compared with the T2DM + LBP group, Chao1 and Observed species were significantly higher in the T2DM + LBP + E group (p < 0.05) (Figure 1A,B).
Compared with the T2DM + E group, Simpson was significantly higher in the T2DM + LBP + E group (p < 0.05) (Figure 1D).
Results of the multifactor ANOVA: The combined intervention of exercise and LBP significantly outperformed either exercise or LBP alone in influencing α‐diversity: Chao1 (p = 0.0013 < 0.01); Observed species (p = 0.0018 < 0.01); Simpson (p = 0.0254 < 0.05) (Figure 1A,B,D).
β‐Diversity
3.1.2
According to PCA, PCoA, and NMDS, there was a significant difference in the compositional structure of the gut microbiota in the T2DM group versus the control, T2DM + LBP, T2DM + E, and T2DM + LBP + E groups (Figure 1E–G).
Based on PCA, PCoA and NMDS analyses, the compositional structure of the gut microbiota of the T2DM + LBP + E group showed significant differences from that of the T2DM + LBP and T2DM + E groups (Figure 1E–G).
Correlation of Gut Microbiota With SCFAs, Glucolipid Metabolism, Insulin Resistance, Inflammation, Oxidative Stress, and Molecular Pathway Indicators
3.2
Effects of Aerobic Exercise and LBP on the Correlation of Intestinal Bacterial Phylum With SCFAs, Glucolipid Metabolism, Insulin Resistance, Inflammation, Oxidative Stress, and Molecular Pathway Indices in T2DM Rats
3.2.1
Phylum: Firmicutes was significantly positively correlated with butyric acid, acetic acid, GLP‐1, and PGC‐1α (p < 0.05), and significantly negatively correlated with TG (p < 0.05). Both Proteobacteria and Bacteroidota were significantly negatively correlated with acetic acid, butyric acid, GLP‐1, and PGC‐1α (p < 0.05), and significantly positively correlated with TG (p < 0.05). Actinobacteriota was significantly negatively correlated with isobutyric acid and HDL‐C (p < 0.05), and significantly positively correlated with TG/HDL‐C (p < 0.05). Patescibacteria was significantly negatively correlated with TC (p < 0.05). Desulfobacterota was significantly positively correlated with isobutyric acid and HDL‐C (p < 0.05), and significantly negatively correlated with TG/HDL‐C (p < 0.05) (Figure 2D; Tables 1 and 2).
Analysis of gut microbiota abundance and its correlation with SCFAs, glucolipid metabolism, insulin resistance, inflammation, oxidative stress, and molecular pathway indicators. (A, B) Heatmap of phylum and genus. (D, E) Clustered heat maps of the correlations of phylum and genus with SCFAs, glucolipid metabolism, insulin resistance, inflammation, oxidative stress, and various indicators of molecular pathways. (C, F) Correlation network diagram of phylum and genus. (G) PICRUSt2 gut microbiota functional prediction (Pathways).
Effects of Aerobic Exercise and LBP on the Correlation of Intestinal Bacterial Genus With SCFAs, Glucolipid Metabolism, Insulin Resistance, Inflammation, Oxidative Stress, and Molecular Pathway Indices in T2DM Rats
3.2.2
Genus: Firmicutes unclassified showed a significant negative correlation with TNF‐α and LDL‐C (p < 0.05), and a significant positive correlation with SOD and AMPK (p < 0.05). Lachnospiraceae NK4A136 group exhibited positive correlations with isobutyric acid and HDL‐C (p < 0.05), and a negative correlation with TG/HDL‐C (p < 0.05). Clostridia UCG‐014 unclassified was positively correlated with butyric acid, acetic acid, and PGC‐1α (p < 0.05), and negatively correlated with TG and GLP‐1 (p < 0.05). Monoglobus demonstrated positive associations with isobutyric acid and HDL‐C (p < 0.05), and a negative association with TG/HDL‐C (p < 0.05). Phascolarctobacterium showed a positive correlation with hexanoic acid (p < 0.05). Intestinimonas was positively correlated with isovaleric acid (p < 0.05) and negatively correlated with IL‐6 and MDA (p < 0.05). Kineothrix exhibited positive correlations with LDL‐C and TNF‐α (p < 0.05), and negative correlations with SOD and AMPK (p < 0.05). Colidextribacter showed negative correlations with LDL‐C and TNF‐α (p < 0.05), and positive correlations with SOD and AMPK (p < 0.05). Muribaculaceae unclassified was negatively correlated with acetic acid, butyric acid, and PGC‐1α (p < 0.05), and positively correlated with GLP‐1 and TG (p < 0.05). Enterorhabdus demonstrated a negative correlation with hexanoic acid (p < 0.05). Candidatus Saccharimonas showed positive correlations with acetic acid, butyric acid, and PGC‐1α (p < 0.05), and negative correlations with GLP‐1 and TG (p < 0.05). Desulfovibrionaceae unclassified was positively correlated with isobutyric acid, HDL‐C, and Ins (p < 0.05). Desulfovibrio exhibited a positive correlation with hexanoic acid (p < 0.05) (Figure 2E; Tables 1 and 2).
PICRUSt2 Gut Microbiota Functional Prediction
3.2.3
Glucose Metabolism Pathway: As the core pathway of glucose metabolism, the average proportion of glycolysis/gluconeogenesis in the T2DM group was significantly higher than that in the Control group, suggesting aggravated glucose metabolism disorders under the diabetic state. Compared with the T2DM group, the abundance of this pathway in the T2DM + LBP group, T2DM + E group, and T2DM + LBP + E group decreased in a gradient manner, with the most significant decrease observed in the T2DM + LBP + E group. This indicates that Lycium barbarum polysaccharides (LBP) combined with exercise can effectively regulate the glucose metabolism pathway and improve glucose metabolism disorders (Figure 2G).
Lipid Metabolism Pathway: The abundance of the fatty acid synthesis pathway in the T2DM group showed an increasing trend compared with the Control group, reflecting lipid metabolism abnormalities under the diabetic state. The T2DM + LBP group, T2DM + E group, and T2DM + LBP + E group all exerted different degrees of inhibitory effects on the abundance of this pathway, and the T2DM + LBP + E group exhibited the most prominent regulatory effect. This suggests that the intervention (LBP combined with exercise) can improve lipid metabolism disorders by regulating the lipid metabolism pathway (Figure 2G).
Other Metabolic Pathways: The average proportions of other metabolic pathways, including (5Z)‐dodec‐5‐enoate biosynthesis, L‐leucine degradation I, methylgallate degradation, gallate degradation II, syringate degradation, the superpathway of phenylethylamine degradation, toluene degradation III (aerobic; via p‐cresol), 4‐methylcatechol degradation (…ortho cleavage), the superpathway of L‐threonine metabolism, and 4‐hydroxyphenylacetate degradation, were generally low. However, the abundance of these pathways in the T2DM group was still relatively prominent compared with other groups. It can be seen that each intervention group (T2DM + LBP, T2DM + E, T2DM + LBP + E) also exerted a certain regulatory effect on these pathways, which reflects the effect of the interventions (Figure 2G).
Effects of Aerobic Exercise and LBP on the Abundance of Gut Microbiota in T2DM Rats
3.3
Phylum: Compared with the T2DM group, Firmicutes, Desulfobacterota, and Patescibacteria were significantly higher in the Control, T2DM + LBP, T2DM + E, and T2DM + LBP + E groups (p < 0.01), and Proteobacteria, Bacteroidota, and Actinobacteriota were significantly lower (p < 0.01) (Figures 2A and 3A–F). Genus: Compared to the T2DM group, Control, T2DM + LBP, T2DM + E, and T2DM + LBP + E groups were Lachnospiraceae NK4A136 group, Firmicutes unclassified, Clostridia UCG‐014 unclassified, Monoglobus, Phascolarctobacterium, Intestinimonas, Colidextribacter, Candidatus Saccharimonas, Desulfovibrionaceae unclassified, and Desulfovibrio were significantly higher (p < 0.01), and Kineothrix, Muribaculaceae unclassified, and Enterorhabdus were significantly lower (p < 0.01) (Figures 2B and 3b–d,e1,e2,f).
Effects of aerobic exercise and LBP on the abundance of gut microbiota in T2DM rats. (A–F) Denotes the comparison of differences in the abundance of gut microbiota phylum in each group. (b) Affiliation to Bacteroidota indicates a comparison of differences in genus abundance of enteric flora across groups. (c) Affiliation to Actinobacteriota indicates a comparison of differences in genus abundance of enteric flora across groups. (d) Affiliation to Patescibacteria indicates a comparison of differences in genus abundance of enteric flora across groups. (e1, e2) Affiliation to Desulfobacterota indicates a comparison of differences in genus abundance of enteric flora across groups. (f) Affiliation to the Firmicutes indicates differences in the abundance of gut microbiota genera between groups. A, Firmicutes_unclassified; B, Lachnospiraceae_NK4A136_group; C, Clostridia_UCG‐014_unclassified; D, Monoglobus; E, Phascolarctobacterium; F, Intestinimonas; G, Colidextribacter; H, Kineothrix. * indicates p < 0.05, ** indicates p < 0.01.
Phylum: Compared with the T2DM + LBP group, Firmicutes, Patescibacteria, and Desulfobacterota were significantly higher in the T2DM + LBP + E group (p < 0.01), and Proteobacteria, Bacteroidota, and Actinobacteriota were significantly lower (p < 0.01) (Figures 2A and 3A–F). Genus: Compared with the T2DM + LBP group, the T2DM + LBP + E group had Lachnospiraceae NK4A136 group, Firmicutes unclassified, Clostridia UCG‐014 unclassified, Monoglobus, Phascolarctobacterium, Intestinimonas, Colidextribacter, Candidatus Saccharimonas, Desulfovibrionaceae unclassified, and Desulfovibrio significantly higher (p < 0.01) and significantly lower (p < 0.01) for Kineothrix and Muribaculaceae unclassified (Figures 2B and 3b–e1,e2,f).
Phylum: Compared with the T2DM + E group, the levels of Firmicutes, Patescibacteria, and Desulfobacterota in the T2DM + LBP + E group were significantly increased (p < 0.01). Proteobacteria, Bacteroidota, and Actinobacteriota were significantly decreased (p < 0.01) (Figures 2A and 3A–F). Genus: Compared with the T2DM + E group, Lachnospiraceae NK4A136 group, Firmicutes unclassified, Clostridia UCG‐014 unclassified, Monoglobus in the T2DM + LBP + E group, Phascolarctobacterium, Intestinimonas, Colidextribacter, Desulfovibrionaceae unclassified, and Desulfovibrio were significantly elevated (p < 0.01), and Kineothrix, Muribaculaceae unclassified, and Enterorhabdus were significantly lower (p < 0.01) (Figures 2B and 3b,c,e1,e2,f).
Results of the multifactorial ANOVA: The combined intervention of exercise and LBP significantly outperformed either exercise or LBP alone in affecting gut microbiota abundance: Proteobacteria (p = 0.0073 < 0.01); Bacteroidota (p = 0.0092 < 0.01); Muribaculaceae unclassified (p = 0.0035 < 0.05); Actinobacteriota (p = 0.0009 < 0.01); Enterorhabdus (p = 0.0061 < 0.01); Patescibacteria (p = 0.0047 < 0.05); Candidatus Saccharimonas (p = 0.0085 < 0.01); Desulfobacterota (p = 0.0022 < 0.01); Desulfovibrionaceae unclassified (p = 0.0058 < 0.05); Desulfovibrio (p = 0.0011 < 0.01); Firmicutes (p = 0.0079 < 0.01); Firmicutes_unclassified (p = 0.0039 < 0.05); Lachnospiraceae_NK4A136_group (p = 0.0006 < 0.01); Clostridia_UCG‐014_unclassified (p = 0.0068 < 0.01); Monoglobus (p = 0.0029 < 0.05); Phascolarctobacterium (p = 0.0081 < 0.01); Intestinimonas (p = 0.0043 < 0.01); Colidextribacter (p = 0.0015 < 0.05); Kineothrix (p = 0.0052 < 0.01) (Figure 3A,B,b,C,c,D,E,e1,e2,F,f1,f2).
Effects of Aerobic Exercise and LBP on SCFAs in T2DM Rats
3.4
Compared with the T2DM group, isobutyric acid, acetic acid, hexanoic acid, isovaleric acid, and total SCFAs were significantly higher in the control group (p < 0.05 or p < 0.01) (Figure 4A,C,E,G,H). Propionic acid, isobutyric acid, butyric acid, valeric acid, hexanoic acid, and total SCFAs were significantly increased in the T2DM + LBP group (p < 0.01) (Figure 4B–D,F–H). Isobutyric acid, hexanoic acid, valeric acid, and total SCFAs were significantly increased in the T2DM + E group (p < 0.01) (Figure 4C,F–H). Isobutyric acid, isovaleric acid, butyric acid, hexanoic acid, valeric acid, and total SCFAs were significantly increased in the T2DM + LBP + E group (p < 0.05 or p < 0.01) (Figure 4C–H).
Effects of aerobic exercise and LBP on SCFAs in T2DM rats. (A) Indicates the comparison of the difference of Acetic acid in each group. (B) Indicates the comparison of the difference of Propionic acid in each group. (C) Indicates the comparison of the differences of Isobutyric acid in each group. (D) Indicates the difference of Butyric acid in each group. (E) Indicates the difference of Isovaleric acid in each group. (F) Indicates the difference of Valeric acid in each group. (G) Indicates the difference of Hexanoic acid in each group. (H) Comparison of total SCFAs by group. * indicates p < 0.05, ** indicates p < 0.01.
Compared with the T2DM + LBP group, isobutyric acid and total SCFAs were significantly higher in the T2DM + LBP + E group (p < 0.05 or p < 0.01) (Figure 4C,H).
Compared with the T2DM + E group, isobutyric acid, hexanoic acid, and total SCFAs were significantly higher in the T2DM + LBP + E group (p < 0.05 or p < 0.01) (Figure 4C,G,H).
Results of the multifactor ANOVA: The combined intervention of exercise and LBP significantly outperformed either exercise or LBP alone in affecting short‐chain fatty acids: isobutyric acid (p = 0.0041 < 0.05); butyric acid (p = 0.0413 < 0.05); isovaleric acid (p = 0.0497 < 0.05); hexanoic acid (p = 0.0271 < 0.05); total SCFAs (p = 0.0095 < 0.01) (Figure 4C–E,G,H).
Effects of Aerobic Exercise and LBP on Glycolipid Metabolism, Insulin Resistance and Inflammatory Response in T2DM Rats
3.5
Compared with the T2DM group, LDL‐C, TC, TG, fasting blood glucose change, weight change, TG/HDL‐C, TNF‐α, and IL‐6 were significantly lower (p < 0.01), and HDL‐C, Ins, and GLP‐1 were significantly higher (p < 0.01) in the control group (Figures 5A–I and 6A,B). The T2DM + LBP group had significantly lower TG, LDL‐C, TG/HDL‐C, IL‐6, TNF‐α, and weight change (p < 0.05 or p < 0.01), and significantly higher HDL‐C, Ins, and fasting blood glucose change (p < 0.01) (Figures 5B–E,G–I and 6A,B). The T2DM + E group had significantly lower TC, TG, TG/HDL‐C, IL‐6, TNF‐α, and weight change (p < 0.05 or p < 0.01) and significantly higher HDL‐C, Ins, and fasting blood glucose change (p < 0.05 or p < 0.01) (Figures 5A,B,D,E,G–I and 6A,B). The T2DM + LBP + E group had significantly lower TG, LDL‐C, weight change, TG/HDL‐C, IL‐6, and TNF‐α (p < 0.05 or p < 0.01), and significantly higher HDL‐C, Ins, GLP‐1, and fasting blood glucose change (p < 0.01) (Figures 5B–I and 6A,B).
Effects of aerobic exercise and LBP on glycolipid metabolism and insulin resistance in T2DM rats. (A) Indicates the difference of TC (total cholesterol) in each group. (B) Comparison of differences in TG (triglyceride) between groups. (C, D) Comparison of HDL‐C/LDL‐C (high/low density lipoprotein) in each group. (E) Comparison of the differences in INS (insulin) between groups. (F) Comparison of GLP‐1 (glucagon peptide) by group. (G) Indicates the difference of weight change in each group. (H) Indicates the difference of fasting blood glucose change in each group. (I) Indicates the difference of TG/HDL‐C in each group, which reflects the level of insulin resistance. (J) Indicates the trend of weight change in each group. (K) Indicates the trend of fasting blood glucose changes in each group. * indicates p < 0.05, ** indicates p < 0.01.
Effects of aerobic exercise and LBP on inflammatory responses, oxidative stress, and molecular pathways in T2DM rats. (A) Indicates the comparison of the difference of IL‐6 (Interleukin‐6) in each group. (B) Indicates the comparison of differences in TNF‐α (Tumor Necrosis Factor‐α) in each group. (C) Differences in SOD (Superoxide Dismutase) between groups. (D) Comparison of MDA (Malondialdehyde) in each group. (E) Comparison of AMPK (AMP‐activated protein kinase) in each group. (F) Comparison of PGC‐1α (Peroxisome proliferator‐activated receptor‐gamma co‐activator 1‐alpha) in each group. * indicates p < 0.05, ** indicates p < 0.01.
Compared to the T2DM + LBP group, weight change, TG/HDL‐C, TNF‐α, and IL‐6 were significantly lower (p < 0.01), and GLP‐1 and fasting blood glucose change were significantly higher (p < 0.01) in the T2DM + LBP + E group (Figures 5F,H,I and 6A,B).
Compared with the T2DM + E group, weight change, TG/HDL‐C, TNF‐α, and IL‐6 were significantly lower (p < 0.01), and HDL‐C, GLP‐1, and fasting blood glucose change were significantly higher (p < 0.05 or p < 0.01) in the T2DM + LBP + E group (Figures 5C,F,H,I and 6A,B).
Long‐term diabetes mellitus elevated weight and blood glucose levels in rats, which were ameliorated by aerobic exercise and LBP intervention (Figure 5J,K).
Results of the multifactorial ANOVA: The combined intervention of exercise and LBP significantly outperformed either exercise or LBP alone in improving glucose and lipid metabolism, insulin resistance, and inflammatory responses: TG (p = 0.0496 < 0.05); HDL‐C (p = 0.0089 < 0.01); LDL‐C (p = 0.0371 < 0.05); GLP‐1 (p = 0.0028 < 0.05); TG/HDL‐C (p = 0.0019 < 0.05); IL‐6 (p = 0.0006 < 0.01); TNF‐α (p = 0.0017 < 0.05) (Figures 5B–D,F,G,I and 6A,B).
Effects of Aerobic Exercise and LBP on Oxidative Stress and Molecular Pathways in T2DM Rats
3.6
Compared with the T2DM group, the control group showed a significant decrease in the levels of MDA (p < 0.01) and a significant increase in the levels of SOD vigor, the relative expression of AMPK, and the relative expression of PGC‐1α (p < 0.01) (Figure 6C–F). The levels of MDA were significantly decreased (p < 0.01), and the levels of SOD vigor, relative expression of AMPK, and relative expression of PGC‐1α were significantly increased (p < 0.01) in the T2DM + LBP group (Figure 6C–F). The levels of MDA were significantly decreased (p < 0.01), and the levels of SOD vigor, relative expression of AMPK, and relative expression of PGC‐1α were significantly increased (p < 0.01) in the T2DM + E group (Figure 6C–F). The levels of MDA were significantly decreased in the T2DM + LBP + E group (p < 0.01), and the levels of SOD vigor, relative expression of AMPK, and relative expression of PGC‐1α were significantly increased (p < 0.01) (Figure 6C–F).
Compared with the T2DM + LBP group, the T2DM + LBP + E group showed a significant decrease in the levels of MDA (p < 0.01) and a significant increase in the levels of SOD vitality, the relative expression of PGC‐1α, and the relative expression of AMPK (p < 0.05 or p < 0.01) (Figure 6C–F).
Compared with the T2DM + E group, the T2DM + LBP + E group showed significantly higher relative expression of PGC‐1α (p < 0.01) (Figure 6F).
Results of the multifactor ANOVA: The combined intervention of exercise and LBP significantly outperformed either exercise or LBP alone in their effects on molecular pathways and oxidative stress: SOD (p = 0.0332 < 0.05); MDA (p = 0.0269 < 0.05); AMPK (p = 0.0473 < 0.05); PGC‐1α (p = 0.0078 < 0.01) (Figure 6C–F).
Discussion
4
Effects of T2DM on Gut Microbiota
4.1
Gut microbiota play a crucial role in human health, and their ecological dysregulation is associated with various pathologic processes (Han et al. 2021). Patients with T2DM often exhibit intestinal dysbiosis and dysfunction involving multiple organs (Liu et al. 2022), and maintaining or reestablishing microbial diversity is key to preventing gut homeostasis imbalances linked to such dysbiosis. Gut microbiota may contribute to T2DM via insulin resistance (IR) and disrupted lipid metabolism (Pedersen et al. 2016). Notably, obesity—characterized by abnormal visceral fat accumulation—is a major risk factor for T2DM (Frank et al. 2021), as fat accumulation exacerbates IR, suppresses insulin secretion, reduces cellular glucose uptake, elevates blood glucose, and ultimately induces T2DM (Henao‐Mejia et al. 2012; Zheng et al. 2018).
Short‐chain fatty acids (SCFAs), metabolites produced by intestinal microbes via indigestible polysaccharide degradation, exhibit a reciprocal regulatory relationship with the gut microbiota: the microbiota shapes SCFA composition and metabolism, while SCFAs in turn modulate microbial diversity, homeostasis, and proliferation (Yi et al. 2025). Disturbed SCFAs metabolism markedly drives hepatocellular lipogenesis and abnormal triglyceride deposition in adipose tissue (Palmas et al. 2021). Specifically, SCFAs regulate lipid metabolism through two pathways: they inhibit the activity of key fatty acid synthesis enzymes and activate thermogenesis‐related signaling pathways, ultimately suppressing lipid synthesis, promoting energy consumption, and reducing fat deposition (Li and Guo 2023). In addition, one of the targets of SCFAs‐induced signaling is glucose homeostasis (Mokkala et al. 2020). One acknowledged modulator of glucose homeostasis is GLP‐1. Notably, administration of SCFAs via the rectal route significantly enhanced GLP‐1 secretion levels (Aragón‐Vela et al. 2021), a finding that provides direct evidence for a physiological regulatory relationship between the two (Peng et al. 2022).
Inflammation and elevated pro‐inflammatory cytokines (e.g., IL‐6, TNF‐α) are hallmarks of T2DM. Alterations in the gut microbial ecosystem can induce a pro‐inflammatory state in adipose tissue (Yehualashet and Yikna 2021), while SCFAs inhibit inflammation and modulate metabolic/immune homeostasis (He et al. 2020). Dysregulated gut microbiota reduce SCFAs biosynthesis, weakening the anti‐inflammatory defense of intestinal tissues—a process considered critical for inducing intestinal inflammation (Ma et al. 2019). SCFAs also promote repair of damaged mucosal tissues by downregulating pro‐inflammatory cytokine expression, further suppressing inflammatory responses (Koh et al. 2016; Sawicki et al. 2017).
Probiotics inhibit harmful bacterial growth, enhance intestinal barrier function, improve natural killer cell cytotoxicity, and reduce inflammatory cytokine release (La Fata et al. 2018). While pathogenic bacteria account for a small fraction of gut microbiota (Bäumler and Sperandio 2016), inflammation can induce their virulence gene expression and promote mucosal colonization (Perdijk et al. 2024). In the present study, T2DM rats had significantly lower overall gut microbiota abundance than normal rats, with increased abundances of Kineothrix (Firmicutes), Escherichia‐Shigella and Klebsiella (Proteobacteria), Muribaculaceae unclassified (Bacteroidota), and Enterorhabdus (Actinobacteriota)—suggesting these may act as pathogenic taxa in T2DM. T2DM also induced systemic inflammation, enhanced host cell lipogenesis and triglyceride accumulation, and disrupted glucose homeostasis, consistent with previous findings. Additionally, SCFAs levels depend heavily on commensal microbiota ratios (Ratajczak et al. 2019), and commensal dysbiosis alters SCFA production balance. Thus, in‐depth analysis of T2DM gut microbiota structure and its correlation with glucose/lipid metabolism indicators will provide a critical scientific basis for elucidating the microbiota's role in T2DM pathophysiology.
The most abundant intestinal phyla were Bacteroidota, Firmicutes, and Actinobacteriota: Bacteroidota primarily produces propionate and acetate, while Firmicutes uses butyrate as its main metabolic end product (den Besten et al. 2013). Other SCFAs include hexanoic, valeric, isovaleric, and isobutyric acids. In this study, T2DM rats showed no significant changes in butyrate, propionate, or valerate levels, but markedly downregulated hexanoic, isovaleric, isobutyric, and acetic acid levels—suggesting microbiota mediating the metabolism of these four SCFAs may drive T2DM‐related metabolic disorders. Specifically: Unclassified Clostridia UCG‐014 (Firmicutes), Muribaculaceae unclassified (Bacteroidota), and Candidatus Saccharimonas (Patescibacteria) were significantly associated with acetic acid; Lachnospiraceae NK4A136 group, Monoglobus (Firmicutes), and Desulfovibrionaceae unclassified (Desulfobacterota) with isobutyric acid; Intestinimonas (Firmicutes) with isovaleric acid; Phascolarctobacterium (Firmicutes), Enterorhabdus (Actinobacteriota), and Desulfovibrio (Desulfobacterota) with hexanoic acid.
This provides direct evidence for our above speculations. Additionally, problems with glycolipid metabolism caused by T2DM have been linked to the previously mentioned imbalance between microbiota and SCFAs, while inflammation control has been connected to Firmicutes unclassified and Colidextribacter. Moreover, nutritional modification of the human microbiota has demonstrated numerous health advantages for the host. To prevent or mitigate the onset of diabetes in at‐risk groups, straightforward treatment methods focused on reducing chronic inflammation and insulin resistance are urgently required (Sowmiya and Silambanan 2023).
Effects of LBP on T2DM
4.2
Polysaccharides exhibit diverse biological activities (e.g., immunoregulation, metabolic regulation) that are closely linked to gut microbiota (Guo et al. 2023). For instance, dendrobium polysaccharides promote niacin production by Bacteroidota to activate intestinal GPR109a, enhancing intestinal barrier function and thereby improving IR in T2DM (Pi et al. 2024). Similarly, Ganoderma lucidum polysaccharides modulate gut microbiota structure in diabetic mice, significantly reducing the Firmicutes/Bacteroidota (F/B) ratio and regulating lipid metabolism (Ren et al. 2021). Chronic inflammation is tightly associated with IR and T2DM, and anti‐inflammatory polysaccharides alleviate inflammation by inhibiting pro‐inflammatory cytokine production and modulating intestinal‐systemic immune responses (Pi et al. 2024). LBP possesses strong anti‐inflammatory properties and enhances immune function (Cao, Wang, Gong, et al. 2022). For example, its arabinogalactoside isoform mitigates chronic inflammation via metabolome modulation (Cao, Wang, Ai, et al. 2022). Polysaccharides are ultimately metabolized into SCFAs, which alter gut microbiota ecology by reshaping the ratio of specific microorganisms (Wang et al. 2018). Additionally, gut microbial enzymes decompose microbe‐associated carbohydrates into simpler, host‐ and microbe‐assimilable molecules, increasing microbial diversity and abundance (Yi et al. 2025). Thus, bioactive components like LBP hold significant potential for regulating intestinal microecological balance, and their disease‐related mechanisms warrant in‐depth investigation (Zhou et al. 2022).
Polysaccharides exert hypolipidemic effects by lowering blood lipids (e.g., cholesterol, triglycerides) (Pi et al. 2024). In the present study, LBP increased HDL‐C and decreased TC, TG, and LDL‐C in T2DM rats. It also reduced IL‐6, TNF‐α, and blood glucose levels while increasing INS and GLP‐1 levels—consistent with findings that Ganoderma lucidum polysaccharides alleviate inflammation and lower blood glucose in diabetic mice (Ma et al. 2022). Polysaccharides can enable the gut microbiota to be in equilibrium (Pi et al. 2024). LBP further restored gut microbiota equilibrium: T2DM rats treated with LBP exhibited significantly higher gut microbial biodiversity than untreated T2DM rats. While an elevated F/B ratio is typically linked to obesity and gut dysbiosis (Zhang et al. 2020), the T2DM group in this study had a significantly lower F/B ratio than the LBP group—suggesting severe inflammation in T2DM rats, where Bacteroidota may play a pathogenic role. LBP ameliorated this response by regulating gut microbiota composition: it significantly increased the relative abundances of Lachnospiraceae NK4A136 group, Firmicutes unclassified, Clostridia UCG‐014 unclassified, Monoglobus, Phascolarctobacterium, Intestinimonas, Colidextribacter, Candidatus Saccharimonas, and Desulfovibrionaceae unclassified, while reducing those of Kineothrix, Muribaculaceae unclassified, and Enterorhabdus. Collectively, LBP enriched beneficial bacteria and depleted harmful bacteria, protecting the host from damage by pathogenic microbes and their metabolites.
Gut microbiota dysbiosis contributes to numerous metabolic diseases, making microbiota remodeling critical for host health (Tanca et al. 2017). We therefore explored correlations between gut microbiota and biochemical indices: TG was negatively correlated with Clostridia UCG‐014 unclassified and Candidatus Saccharimonas, but positively correlated with Muribaculaceae unclassified; HDL‐C was positively correlated with Lachnospiraceae NK4A136 group, Monoglobus, and Desulfovibrionaceae unclassified; LDL‐C was negatively correlated with Colidextribacter and Firmicutes unclassified, but positively correlated with Kineothrix (suggesting these taxa are linked to lipid metabolism); TG/HDL‐C was negatively correlated with Lachnospiraceae NK4A136 group and Monoglobus; GLP‐1 was positively correlated with Clostridia UCG‐014 unclassified and Candidatus Saccharimonas, but negatively correlated with Muribaculaceae unclassified (indicating involvement in glucose control and IR); IL‐6 was negatively correlated with Monoglobus and Intestinimonas; TNF‐α was negatively correlated with Colidextribacter and Firmicutes unclassified, but positively correlated with Kineothrix (supporting roles in inflammatory control).
Furthermore, this study discovered that LBP can reduce inflammation and control gut microbiota proportions while also increasing SCFAs production. Propionate, acetate, and butyrate prevent diet‐induced obesity and insulin resistance, while propionate and butyrate induce gut hormones and reduce food intake (Lin et al. 2012). Butyrate and propionate activate intestinal gluconeogenesis through complementary mechanisms (de Vadder et al. 2014). In our study, we found that LBP significantly increased the amount of butyric acid. And in combination with the above results, involving Clostridia UCG‐014 unclassified, Candidatus Saccharimonas, and Muribaculaceae unclassified, they are likely to be involved in the regulation of butyric acid production to improve glycolipid metabolism in T2DM rats. Isovaleric and isobutyric acids are used as by‐products of protein fermentation, especially in microbial protein fermentation (Williams et al. 2016). In our study, we found that the increase in isobutyric acid may be related to LBP regulation of microbial protein fermentation processes (Ma et al. 2022). And involving the Lachnospiraceae NK4A136 group, Monoglobus and Desulfovibrionaceae unclassified are likely to be involved in regulating isobutyric acid production to suppress insulin resistance and improve lipid metabolism. These results suggest that remodeling the composition of gut microbiota is a key strategy to reduce the risk of developing diabetes.
Effects of Exercise and Combined LBP on T2DM
4.3
Exercise has several health benefits, including a lower risk of chronic diseases caused by intestinal permeability (Keirns et al. 2020). Exercise, for example, can enhance body composition, reduce weight gain, and mitigate the decline in microbial diversity caused by a high‐fat diet (Campbell et al. 2016). However, the effects of exercise are not limited to increasing microbial diversity (Campbell and Wisniewski 2017). Exercise has been shown to be an effective modulator of SCFAs composition, with specific effects on short‐chain fatty acid salt concentrations. It has been shown that exercise affects the composition of the gut microbiota, increasing SCFAs production and plasma SCFAs concentration to improve IR in skeletal muscle (Yang et al. 2020). The present study also showed that aerobic exercise greatly enhanced the abundance of gut microbiota, raised the levels of SCFAs (particularly isobutyric acid, valeric acid, and hexanoic acid), and lowered blood glucose levels as well as body weight loss in T2DM rats. Additionally, exercise is regarded as an effective non‐pharmacological therapy for reducing inflammatory signaling pathways (Aragón‐Vela et al. 2021). For example, exercise diminishes inflammatory mediators, enhances antioxidant enzymes, and lowers TNF‐α expression in intestinal lymphocytes, while also promoting immune surveillance, thereby exerting an anti‐inflammatory effect on the gut (Campbell and Wisniewski 2017; Rojas‐Valverde et al. 2023). And we proved it in this study.
Further investigation into the gut microbiota's role in exercise is needed to inform personalized interventions for improving glucose‐lipid metabolism and insulin sensitivity, with SCFAs identified as key mediators in these processes (Ticinesi et al. 2019). Our study explored the correlations between gut bacteria, SCFAs, and exercise responses, revealing that aerobic exercise and LBP exerted generally consistent effects on the gut microbiota—though with subtle differences in SCFA modulation. Notably, the Lachnospiraceae NK4A136 group, Monoglobus, Desulfovibrionaceae unclassified, Phascolarctobacterium, Desulfovibrio, Enterorhabdus, and their associated SCFAs (hexanoic and isobutyric acids) likely play critical roles in aerobic exercise‐induced T2DM improvement. In addition, it has been shown that isobutyric acid can regulate energy metabolic processes in the human body through certain signaling pathways (Nogal et al. 2021). This is supported by the finding in our study that gut microbiota involving isobutyric acid was also significantly correlated with HDL‐C and TG/HDL‐C (which indirectly reflects insulin resistance). Additionally, research indicates that alterations in microbiota due to exercise can mitigate the clinical manifestations of inflammatory bowel disease (Bilski et al. 2016). This study found that the increased abundances of Intestinimonas and Colidextribacter and the decreased abundance of Kineothrix significantly improved the inflammatory response (reducing the levels of IL‐6 and TNF‐α). In contrast, SCFAs involved in the effects of aerobic exercise were not found to be involved in the regulation of the inflammatory response, suggesting that the three genera mentioned above may influence the inflammatory process in T2DM rats in other ways.
Building on prior studies of aerobic exercise or LBP alone, our study added a combined intervention group to elucidate the synergistic mechanisms of exercise and LBP in T2DM. Results showed that combined intervention significantly upregulated isovaleric, isobutyric, butyric, and hexanoic acids in T2DM rats, accompanied by activation of functionally relevant gut microbiota (e.g., Lachnospiraceae NK4A136 group, Clostridia UCG‐014, Monoglobus, Phascolarctobacterium, Intestinimonas, Muribaculaceae, Enterorhabdus, Candidatus Saccharimonas, and Desulfovibrionaceae unclassified). Compared to single interventions, aerobic exercise combined with LBP exerted more pronounced effects on regulating glucose‐lipid metabolism, reducing inflammation, and improving IR—providing new theoretical and practical insights for the comprehensive prevention and treatment of T2DM.
Effect of Exercise and Combined LBP on Molecular Pathways in Type 2 Diabetes Through Gut Microbiota
4.4
AMPK serves as a crucial regulator of lipid and carbohydrate metabolism. Its activation promotes ATP‐generating pathways, including glucose transport and fatty acid oxidation (Cantó and Auwerx 2009; Huang et al. 2019). A recent study found that AMPK activation reduced cardiac apoptosis in diabetic mice (Xue et al. 2022). Furthermore, SCFAs can directly activate AMPK by increasing the AMP/ATP ratio, which regulates the activity of lipid metabolism‐related proteins and cholesterol‐glucose levels in muscles (Wegierska et al. 2022). As a downstream molecule of the AMPK pathway, PGC‐1α is involved in regulating mitochondrial gene synthesis and plays a key role in glucose homeostasis regulation (Wang et al. 2020). Moreover, the dysregulation of oxidative stress and apoptosis mediated by PGC‐1α is linked to diabetes and its complications. Decreased levels of PGC‐1α have been noted in multiple kidney disease models, while activated PGC‐1α has been shown to mitigate oxidative damage and apoptosis in vitro (Liao et al. 2019). In this study, we studied the relative expression levels of the AMPK/PGC‐1α pathway. We discovered that the activity of this system was down‐regulated and the degree of oxidative stress was heightened in T2DM rats (decreased SOD activity and increased MDA content). Furthermore, aerobic exercise and LBP may affect the expression of AMPK/PGC‐1α pathway by regulating Firmicutes unclassified (increased abundance) and Kineothrix (decreased abundance), thereby improving oxidative stress and promoting lipid metabolism.
Additionally, studies have shown that butyric acid can effectively alleviate inflammatory responses and insulin resistance and play an important role in intestinal barrier function (Knudsen et al. 2018). Furthermore, butyrate has the ability to affect mitochondrial function. Butyrate has been shown to alleviate mitochondrial dysfunction and kidney injury in rats with diabetic nephropathy through the AMPK/PGC‐1α pathway (Lu et al. 2024). In our study, we also found that aerobic exercise combined with LBP intervention increased butyric acid content in the bodies of T2DM rats. Moreover, Clostridia UCG‐014 unclassified, Muribaculaceae unclassified, and Candidatus Saccharimonas were significantly associated with butyric acid, suggesting that the above genera are likely to be involved in butyric acid synthesis in the context of aerobic exercise combined with the intervention of LBP and, by doing so, influence the expression of the AMPK/PGC‐1α pathway to improve the disease in T2DM rats. It is suggested that the above genera may be involved in butyric acid synthesis in the context of aerobic exercise combined with LBP intervention and, through this, affect the expression of the AMPK/PGC‐1α pathway to improve the disease in T2DM rats.
Conclusion
5
Aerobic exercise and LBP can improve insulin resistance caused by T2DM, promote the proliferation of beneficial bacteria, reduce harmful bacteria, optimize the intestinal microecology, and then enhance the sensitivity of body cells to insulin, helping to control sugar smoothly. At the same time, aerobic exercise and LBP can regulate the composition and metabolism of gut microbiota and effectively inhibit inflammatory response. At the level of glucose and lipid metabolism, the two can optimize the process of sugar decomposition and metabolism, regulate lipid metabolism, reduce the abnormal accumulation of blood lipids, and regulate the metabolic imbalance in all aspects of the body, which is helpful for the improvement of the condition of T2DM by improving the environment of gut microbiota. Aerobic exercise combined with LBP has a more significant effect on the regulation of gut microbiota, which has a better effect on the improvement of T2DM.
In addition, the molecular mechanisms by which aerobic exercise and LBP regulate the gut microbiota of T2DM rats both involve AMPK/PGC‐1α regulation, which may be a key pathway between gut microbiota and T2DM. Aerobic exercise and LBP may affect the expression of AMPK/PGC‐1α pathway by regulating Firmicutes unclassified and Kineothrix, thereby improving oxidative stress and promoting lipid metabolism. Moreover, Clostridia UCG‐014 unclassified, Muribaculaceae unclassified, and Candidatus Saccharimona are likely to be involved in butyric acid synthesis under the intervention of aerobic exercise in combination with LBP, and in this way affect the expression of the AMPK/PGC‐1α pathway to play a role in ameliorating inflammation in T2DM rats. In addition, isobutyric acid and the gut microbiota associated with it may play a key role in the improvement of T2DM with aerobic exercise and LBP, which could be focused on in the future.
Author Contributions
Conceptualization: J.W. Data curation: J.W., X.C. Formal analysis: J.W., X.L. Funding acquisition: X.L. Investigation: S.F. Methodology: J.W., S.F., X.C, X.L. Project administration: X.L. Resources: X.L. Software: J.W., S.F., X.C. Supervision: X.L. Validation: S.F., X.L. Visualization: J.W., S.F., X.C. Writing – original draft: J.W. Writing – review and editing: J.W., X.L.
Funding
This work is supported by the Natural Science Foundation of Heilongjiang Province (LH2024G003) and Harbin sport university Intra‐school Doctoral Talent Research Initiation Fund Project (RCYJ‐2105).
Conflicts of Interest
The authors declare no conflicts of interest.
Supporting information
Table S1: Experimental reagents.
Table S2: Experimental equipment.
The reference list from the paper itself. Each links out to its DOI / PubMed record.
- 1Aragón‐Vela, J. , P. Solis‐Urra , F. Ruiz‐Ojeda , A. Alvarez‐Mercado , J. Olivares‐Arancibia , and J. Plaza‐Diaz . 2021. “Impact of Exercise on Gut Microbiota in Obesity.” Nutrients 13, no. 11: 3999.34836254 10.3390/nu 13113999 PMC 8624603 · doi ↗ · pubmed ↗
- 2Balducci, S. , M. Sacchetti , J. Haxhi , et al. 2014. “Physical Exercise as Therapy for Type 2 Diabetes Mellitus.” Diabetes/Metabolism Research and Reviews 30: 13–23.24353273 10.1002/dmrr.2514 · doi ↗ · pubmed ↗
- 3Bäumler, A. , and V. Sperandio . 2016. “Interactions Between the Microbiota and Pathogenic Bacteria in the Gut.” Nature 535: 85–93.27383983 10.1038/nature 18849 PMC 5114849 · doi ↗ · pubmed ↗
- 4Bilski, J. , A. MAZUR‐Bialy , B. Brzozowski , et al. 2016. “Can Exercise Affect the Course of Inflammatory Bowel Disease? Experimental and Clinical Evidence.” Pharmacological Reports 68: 827–836.27255494 10.1016/j.pharep.2016.04.009 · doi ↗ · pubmed ↗
- 5Campbell, S. , and P. Wisniewski . 2017. “Exercise Is a Novel Promoter of Intestinal Health and Microbial Diversity.” Exercise and Sport Sciences Reviews 45: 41–47.27782912 10.1249/JES.0000000000000096 · doi ↗ · pubmed ↗
- 6Campbell, S. , P. Wisniewski , M. Noji , et al. 2016. “The Effect of Diet and Exercise on Intestinal Integrity and Microbial Diversity in Mice.” P Lo S One 11, no. 3: e 0150502.26954359 10.1371/journal.pone.0150502 PMC 4783017 · doi ↗ · pubmed ↗
- 7Cantó, C. , and J. Auwerx . 2009. “PGC‐1α, SIRT 1 and Ampk, an Energy Sensing Network That Controls Energy Expenditure.” Current Opinion in Lipidology 20: 98–105.19276888 10.1097/MOL.0b 013e 328328 d 0a 4PMC 3627054 · doi ↗ · pubmed ↗
- 8Cao, C. , L. Wang , C. Ai , et al. 2022. “Impact of Lycium barbarum Arabinogalactan on the Fecal Metabolome in a DSS‐Induced Chronic Colitis Mouse Model.” Food & Function 13: 8703–8716.35912853 10.1039/d 2fo 01283 a · doi ↗ · pubmed ↗